Connection between orbital modulation of H and gamma-rays in the Be/X-ray binary LS I
Abstract
We studied the average orbital modulation of various parameters (-ray flux,
H emission line, optical V band brightness) of the radio- and -ray emitting Be/X-ray binary LS I.
Using the Spearman rank correlation test, we found highly significant correlations between the orbital variability of
the equivalent width of the blue hump of the H and -LAT flux with a Spearman p-value ,
and the equivalent widths ratio and -LAT flux with p-value .
We also found a significant anti-correlation between -LAT flux and V band magnitude
with p-value .
All these correlations refer to the average orbital variability, and we conclude
that the H and -ray emission processes in LS I are connected.
The possible physical scenario is briefly discussed.
Key Words.
Stars: individual: LS I – Gamma rays: stars – X-rays: binaries – Stars: winds, outflows1 Introduction
LS I (V615 Cas) is a high-mass X-ray binary whose remarkable nature was illustrated following the discovery of its strong, non-thermal, and periodic radio outbursts (Gregory & Taylor 1978). It was first detected as a strong -ray source by the COS B satellite (Hermsen et al. 1977). More recently, it has also been reported as a source of high-energy (HE) and very high-energy (VHE) -rays by the Fermi Large Area Telescope (LAT, Abdo et al. 2009), the MAGIC Cherenkov telescope (Albert et al. 2006), and by the VERITAS collaboration (Maier et al. 2012). Indeed, it is currently considered one of the few confirmed representatives of the selected class of -ray binaries since the system’s luminosity in this energy range dominates the whole spectral energy distribution.
LS I consists of a massive B0Ve star and a compact object orbiting the primary every 26.5 d. According to the most recent radial velocity measurements of the absorption lines of the primary (Casares et al. 2005, Aragona et al. 2009), the orbit is elliptical (), with periastron passage determined to occur around phase . The compact object interacts with the Be circumstellar disk thereby sampling a wide range of physical parameters and producing remarkable, periodic flaring events each orbital cycle. Such a strong orbital modulation in the LS I emission is observed across the whole electromagnetic spectrum, especially in the radio (Taylor et al. 1992), optical (Mendelson & Mazeh 1994), X-ray (Paredes et al. 1997, Leahy 2001), HE (Abdo et al. 2009), and VHE -ray (Albert et al. 2009) domains. In the optical, the orbital period signature is evident not only in visible broad band photometry, but also in the spectral properties of the H emission line (Zamanov et al. 1999; Grundstrom et al. 2007). The scenario of compact companion interaction with the Be disk is currently favored by Very Long Baseline Interferometry (VLBI) images that show a cometary structure on milli-arcsecond angular scales that rotates with the orbital period (Dhawan et al. 2006).
In addition to the orbital periodicity, another clock is operating in the system. A periodic modulation of about 4.4 yr in the phase and amplitude of the radio outbursts was first reported by Paredes (1987) and Gregory et al. (1989). This super-orbital modulation has also been detected in H (Zamanov et al. 1999), X-rays (Li et al. 2012), and -rays (Ackermann et al. 2013). It could be due to precession of the Be disk (Lipunov & Nazin 1994), a beat frequency between the orbital and precessional rates (Massi & Jaron 2013), or quasi-cyclical variability of the equatorial outflow of the Be star.
Previous multiwavelength observations have revealed interesting correlations between the X-ray and VHE gamma-ray flares (Albert et al. 2008, Anderhub et al. 2009). This suggests that the same relativistic electrons that radiate inverse Compton VHE photons also produce synchrotron X-ray emission. In this Letter, we further explore the multiwavelength behavior of LS I in different spectral domains and search for correlations among them that could help to better characterize the physical mechanism behind the system’s orbital flaring episodes. In particular, we focus our attention on the two LS I extensive observational monitorings that are currently available, namely in -rays and in H high-resolution spectroscopy. Other observational databases in the radio and optical domains are also included in our study.
2 Observations
To create the folded light curve of LS I, we used the following data:
For HE -rays, the Fermi team monitors flux values for a number of bright sources and transient sources that cross their monitoring flux threshold. Here we downloaded the Fermi LAT daily-averaged flux values for LS I in the energy range from 0.1 to 300 GeV. At the time of writing, this data set covered the time interval from JD 2454688.5 (2008 August) to JD 2456358.5 (2013 March).
Johnson V band magnitudes were taken from Lipunova (1988), Paredes et al. (1994), Zaitseva & Borisov (2003). Among the photometry available in the literature, we used only those observations that are reduced to Johnson’s system. We also calculated average orbital variability using the unfiltered optical magnitudes (149 measurements) from the Northern Sky Variability Survey (Woźniak et al. 2004). These unfiltered magnitudes are not plotted here, but they do confirm the detected V band variability.
H spectroscopic data were taken from Paredes et al. (1994), Steele et al. (1996), Liu & Yan (2005), Grundstrom et al. (2007), McSwain et al. (2010), and Zamanov et al. (1999, 2013). Among the various parameters of the H emission line we used here are the total equivalent width of the H emission line, hereafter , the equivalent width of the blue hump EW(B), the equivalent width of the red hump EW(R), the ratio between the equivalent widths of the blue and red humps , and the distance between the peaks, .
In radio photometry, flux densities were retrieved from the old Green Bank Interferometer (GBI), which is a facility of the USA National Science Foundation operated by NRAO in support of the NASA High Energy Astrophysics program. A total of 7234 observations of the flux density at 2.25 GHz and 8.3 GHz obtained from JD2450410 (November 1996) untill 2451664 (April 2000) are available for study.

3 Orbital variability of different parameters
The orbital phase is calculated using P days, a value derived from Bayesian analysis of the radio observations (Gregory 2002). The zero of phase is by convention JD0=2,443,366.775, the date of the first radio detection of the star (Gregory & Taylor 1978).
To calculate the average orbital variability, we separated the data in 20 non-overlapping bins.
The bins are all of the same size – 0.05 in phase each.
In each phase bin we calculated the average value, median value, and standard deviation of the mean.
The values were calculated separately for every data type.
In this way we obtained 20 points per orbital period and plotted them
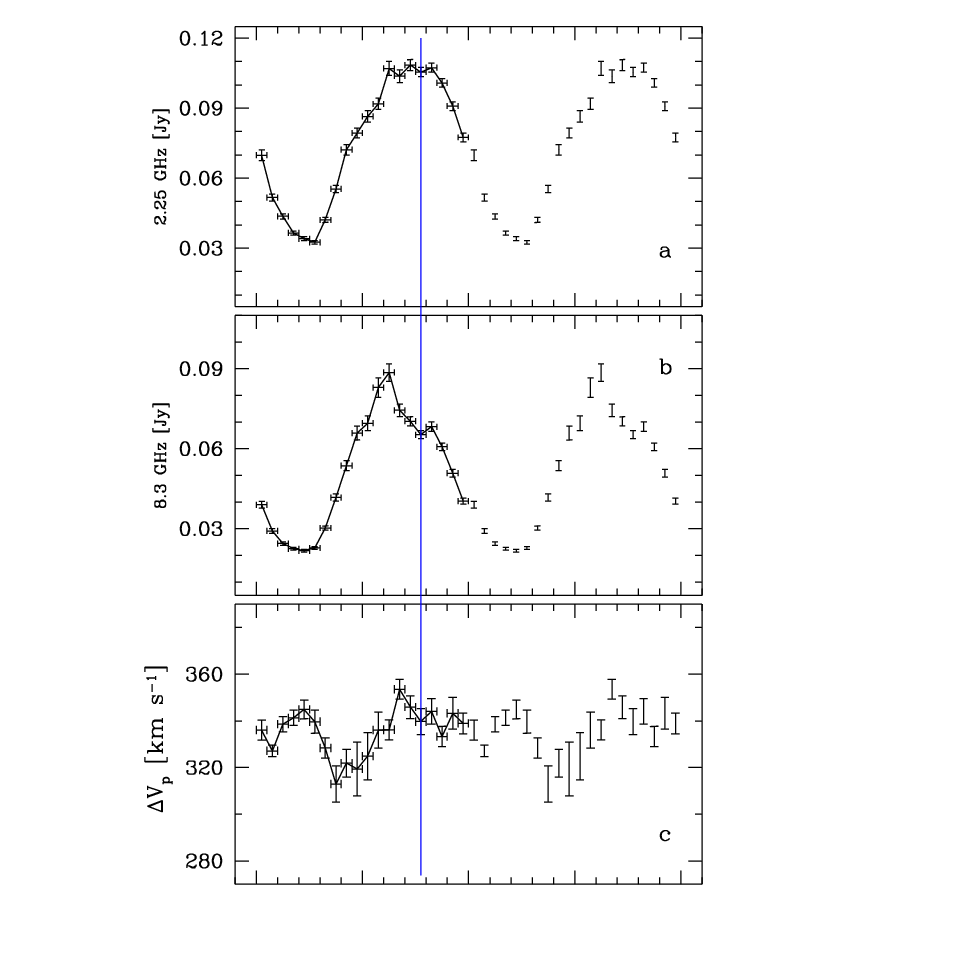
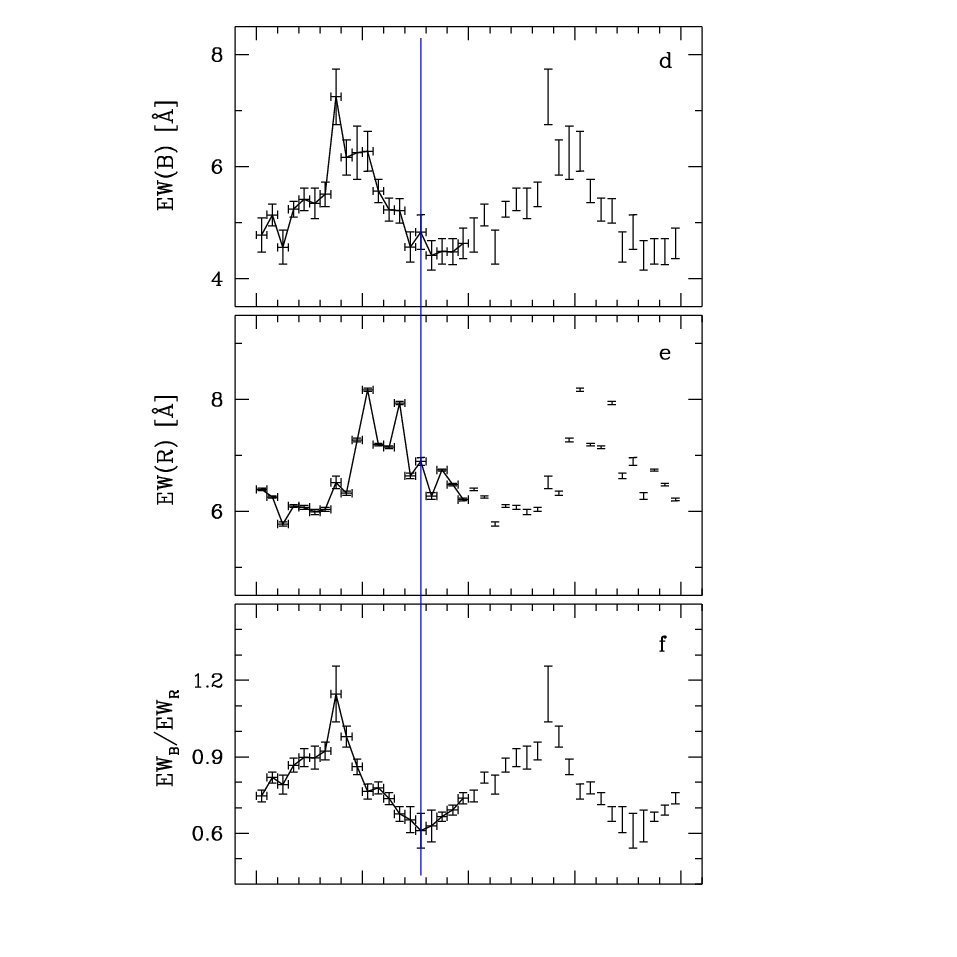
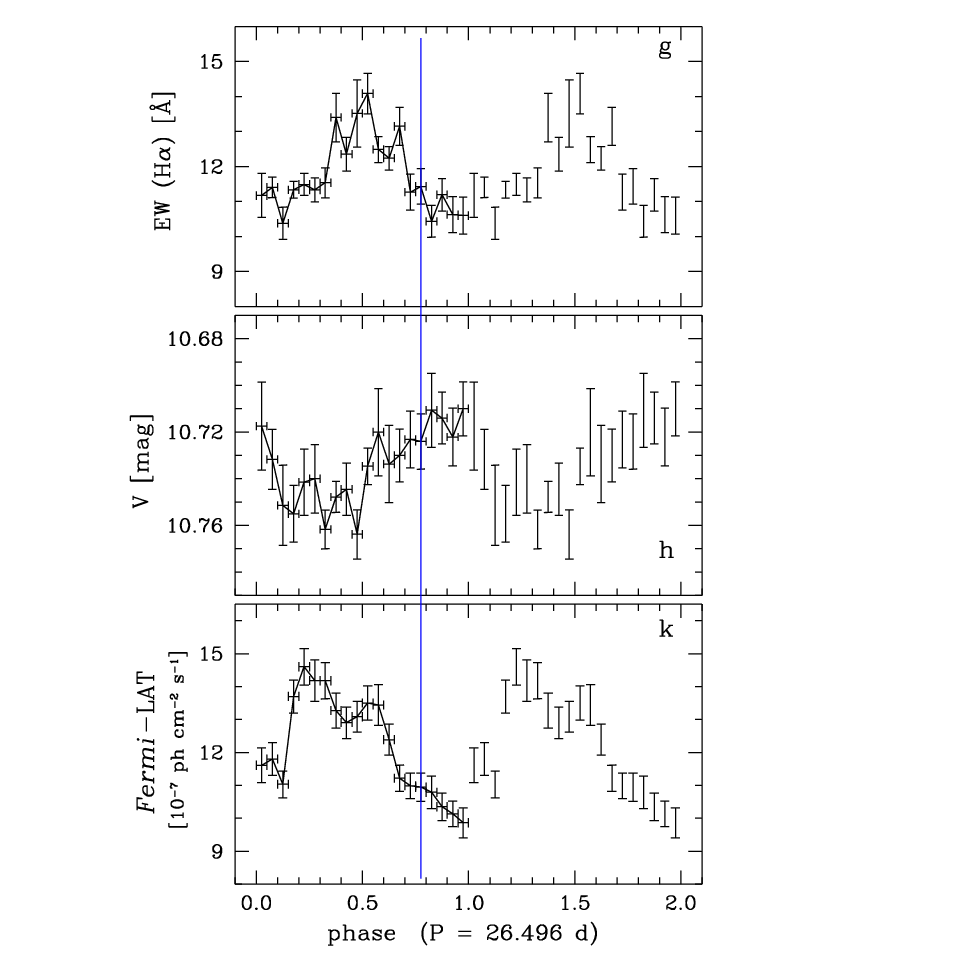
in Fig. 1. The data are repeated over two cycles for clarity.
In Fig. 1 from top to bottom we plot
a- radio flux density at 2.25 GHz (in Jy),
b- radio flux density at 8.3 GHz (in Jy),
c- the distance between the peaks of the H emission line, , in km s-1,
d- equivalent width of the blue hump of H, EW(B), in Å,
e- equivalent width of the red hump of H, EW(R), in Å,
f- the dimensionless ratio between equivalent widths of the blue and red humps of H ,
g- the total equivalent width of H emission line, EW(H), in Å,
h- the optical (Johnson) V band magnitude,
k- the Fermi-LAT photon flux in the 0.1-300 GeV energy range (in units photons cm-2 s-1).
In this figure, it can be seen that the minimum of the -ray production is around the time of the apastron and after it. This corresponds to the maximum of the optical V brightness. At the same orbital phases a very pronounced minimum is visible in EW(H), EW(B), and .
| Parameters | Spearman test | Result | Fig. | |
|---|---|---|---|---|
| coeff. | p-value | |||
| - radio | 0.12 | 2a | ||
| - | -0.32 | 2b | ||
| - | 0.80 | highly sign. | 2c | |
| - | -0.16 | 2d | ||
| - | 0.76 | highly sign. | 2e | |
| - EW(H) | 0.58 | significant | 2f | |
| - | 0.69 | highly sign. | 2g | |
| - | 0.65 | significant | ||
| - | -0.23 | |||
| EW(H) - | 0.45 | |||
| -LAT flux. | ||||
3.1 Phase lags
In Fig. 1 it is visible that the averaged radio fluxes peak at phase , while magnitude peaks at phase , EW(H) at phase , at phase , -LAT flux at phase .
To estimate the phase shift between the different bands, we used a cross correlation function (CCF) with the Fermi-LAT flux as a reference. The delay of the other parameters is as follows: radio flux at 2.25 GHz is delayed by 0.36, radio flux at 8.3 GHz is delayed by 0.30, band brightness is delayed by 0.47, EW(H) is delayed by 0.14 , is delayed by 0.06, and is delayed by 0.28. The typical error of these shifts is .
3.2 Correlations: H, magnitude, and radio versus -rays
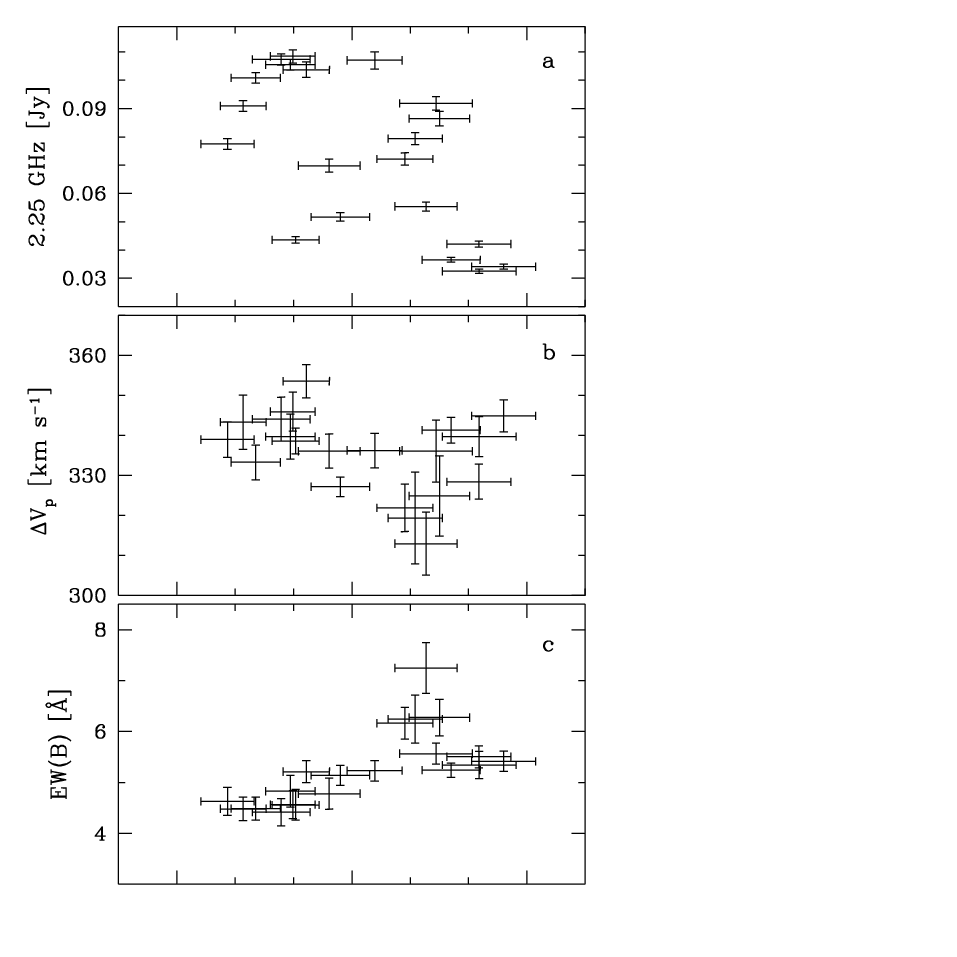
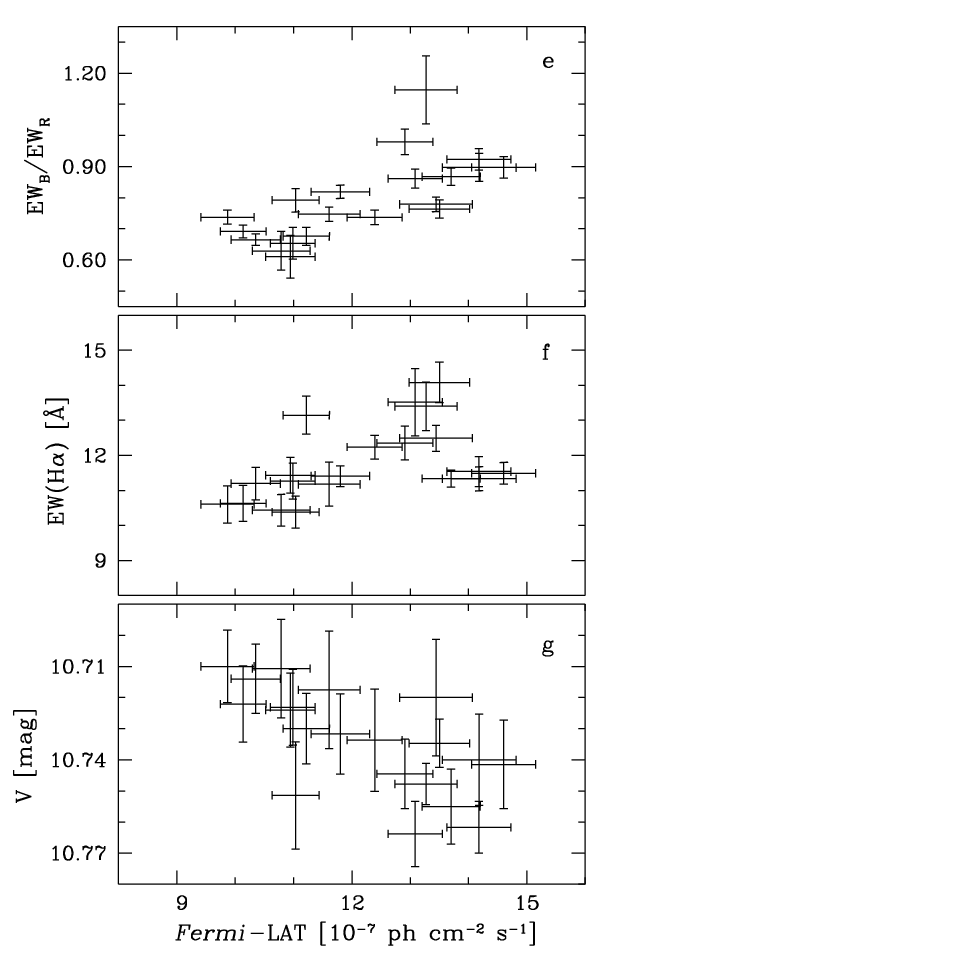
The various optical and radio parameters are plotted versus -LAT flux in Fig. 2. In each panel there are 20 data points, plotted with their errors. For each panel of this figure we performed Spearman’s (rho) rank correlation test. The results of the test (correlation coefficient and p-value) are summarized in Table 1, where the first column lists the correlated parameters, and the second the correlation coefficient and its significance (-value). The third column notes our result, and if no correlation is detected it is empty. The fourth column refers to the figure where the data are plotted.
The highest correlations are between -LAT and , as well as -LAT and . It is worth noting that is one of the H emission parameters where the orbital period is most visible (Zamanov et al. 2013). The correlation is also highly significant () for -rays and and for -rays and the optical V band magnitude. Between -rays and the optical V band, there is an anti-correlation, and the optical brightness decreases when the flux increases. There is also a correlation between -LAT flux and total H, which seems to be significant (). The statistical significance of the correlations, with chance probability values , indicates a relationship between the H and -ray emission processes.
It is worth noting that (i) there is no correlation between the EW(H) and V. However, a correlation does exist between and V brightness. (ii) If we use the phase lags to match up the orbital modulation, the Spearman test gives a worse result for (0.76, ), better result for - (0.78, ), considerably better result for - EW(H) (0.80 ), and an even better result for - (0.75 ), in comparison with the values in Table 1.
4 Discussion and conclusions
The type of the secondary in LS I is still unknown. Several models have been proposed for the nature of the compact object in LS I several models have been proposed: an accreting black hole launching relativistic jets (microquasar, e.g., Massi et al. 2012), rotation-powered pulsar (Dubus 2013), ejector-propeller (Zamanov et al. 2001), and accretor-ejector model (Maraschi & Treves 1981). The properties of the short bursts recently observed are typical of those shown by high magnetic field neutron stars (magnetars), so they provide one more indication of neutron star (Papitto, Torres & Rea 2012). During the ejector stage (pulsar) the gamma ray emission is thought to originate in the shock front at the boundary of the pulsar and stellar winds and/or inverse Compton process. Electrons and hadrons can also be accelerated to relativistic energies by a propeller-acting neutron star (accretion onto the magnetosphere of magnetar). These relativistic particles will produce -ray and neutrino emission (see Bednarek 2011, and references therein).
The H emission in Be stars and Be/X-ray binaries is coming from a Keplerian disk around the Be star (e.g., Hanuschik et al. 1988). This circumstellar disk also supplies the material that feeds the accretion onto the X-ray pulsars in the Be/X-ray binaries.
Phase lags: We detected and calculated the phase lags between -rays from one side and optical, H, and radio parameters from the other side (see Sect.3.1 and Fig.1). Chernyakova et al. (2012) used simultaneous X-ray and radio observations to show that periodic radio flares always lag behind the X-ray flare by , a behavior predicted by the ejector - propeller model. The radio outbursts are probably due to an expansion of a synchrotron emitting source (plasmon), with a prolonged injection of energetic particles (Paredes et al. 1991). In this model the phase shifts between the high-energy emission and other bands are probably connected with the ejection of relativistic wind (or jets) from the compact object, the appearance, and the expansion of the plasmon, which achieves the maximum of the radio flux a few (2 - 8) days after its appearance.
Correlations: We detected a highly significant anti-correlation between -LAT flux and optical V brightness. This could be due to changes in the ionization in the Be circumstellar disk in response to the high-energy emission, which changes the opacity and the emission. The gamma-ray bright blazars in the sample of Bonning et al. (2012) have optical emission correlated with gamma-rays. Bonning et al. (2012) suggest that this strongly supports leptonic models for the gamma-ray production. We have the opposite situation, which is hard to reconcile with leptonic models based on the inverse Compton origin of the -LAT photons from LS I.
The -LAT flux achieves the maximum at about the time of the periastron passage. The highest values of the are reached in the phase interval 0.3 - 0.6, The highest values of are about the orbital phase 0.40. The highest values of the total EW(H) are also reached in the phase interval 0.3 - 0.6. That the -LAT flux correlates with and , and not with EW(R) indicates that the high-energy emission does not influence all the Be disk but only the vicinity around the compact object.
For rotationally dominated profiles the peak separation can be regarded as a measure of the outer radius (e.g., Hanuschik et al. 1988). Because there is no correlation of /LAT flux and , it means that the the size of the H emitting disk does not respond to the changes of the -ray flux. This in agrees with the above that only the surroundings of the compact object star are involved.
Conclusions: We detected highly significant correlations (chance probability value ) between the orbital modulation of the blue hump of H emission line and -LAT flux and between the ratio and -LAT flux, as well as an anti-correlation between V band brightness and -LAT flux. This implies a direct link between the H and -ray emission processes.
Acknowledgements.
We are very grateful to the referee, E. Grundstrom, for valuable comments. This work was partially supported the OP "HRD", ESF, and Bulgarian Ministry of Education and Science (BG051PO001-3.3.06-0047). JM acknowledges support by grant AYA2010-21782-C03-03 from the Spanish Government, and Consejería de Economía, Innovación y Ciencia of Junta de Andalucía as research group FQM-322, as well as FEDER funds.References
- Abdo et al. (2009) Abdo, A. A., Ackermann, M., Ajello, M., et al. 2009, ApJ, 701, L123
- Ackermann et al. (2013) Ackermann, M., Ajello, M., Ballet, J., et al. 2013, ApJ, 773, L35
- Albert et al. (2006) Albert, J., Aliu, E., Anderhub, H., et al. 2006, Science, 312, 1771
- Albert et al. (2008) Albert, J., Aliu, E., Anderhub, H., et al. 2008, ApJ, 684, 1351
- Albert et al. (2009) Albert, J., Aliu, E., Anderhub, H., et al. 2009, ApJ, 693, 303
- Anderhub et al. (2009) Anderhub, H., Antonelli, L. A., Antoranz, P., et al. 2009, ApJ, 706, 27
- Aragona et al. (2009) Aragona, C., McSwain, M. V., Grundstrom, E. D., et al. 2009, ApJ, 698, 514
- Bednarek (2011) Bednarek, W. 2011, IAU Symposium, 275, 305
- Bonning et al. (2012) Bonning, E., Urry, C. M., Bailyn, C., et al. 2012, ApJ, 756, 13
- Casares et al. (2005) Casares, J., Ribas, I., Paredes, J. M., Martí, J., & Allende Prieto, C. 2005, MNRAS, 360, 1105
- Chernyakova et al. (2012) Chernyakova, M., Neronov, A., Molkov, S., et al. 2012, ApJ, 747, L29
- Dubus (2013) Dubus, G. 2013, A&A Rev., 21, 64
- Dhawan et al. (2006) Dhawan, V., Mioduszewski, A., & Rupen, M. 2006, in Proc. VI Microquasar Workshop: Microquasars and Beyond, ed. T. Belloni (Trieste: PoS), 52
- Gregory & Taylor (1978) Gregory, P. C., & Taylor, A. R. 1978, Nature, 272, 704
- Gregory (2002) Gregory, P. C. 2002, ApJ, 575, 427
- Gregory et al. (1989) Gregory, P. C., Xu, H.-J., Backhouse, C. J., & Reid, A. 1989, ApJ, 339, 1054
- Grundstrom et al. (2007) Grundstrom, E. D., Caballero-Nieves, S. M., Gies, D. R., et al. 2007, ApJ, 656, 437
- Hanuschik et al. (1988) Hanuschik, R. W., Kozok, J. R., & Kaiser, D. 1988, A&A, 189, 147
- Hermsen et al. (1977) Hermsen, W., Swanenburg, B. N., Bignami, G. F., et al. 1977, Nature, 269, 494
- Leahy (2001) Leahy, D. A. 2001, A&A, 380, 516
- Li et al. (2012) Li, J., Torres, D. F., Zhang, S., et al. 2012, ApJ, 744, L13
- Lipunov & Nazin (1994) Lipunov, V. M., & Nazin, S. N. 1994, A&A, 289, 822
- Lipunova (1988) Lipunova, N. A. 1988, Sov. Ast., 32, 52
- Liu & Yan (2005) Liu, Q. Z., & Yan, J. Z. 2005, New A, 11, 130
- Maier & VERITAS Collaboration (2012) Maier, G., & VERITAS Collaboration 2012, American Institute of Physics Conference Series, 1505, 362
- Maraschi & Treves (1981) Maraschi, L., & Treves, A. 1981, MNRAS, 194, 1P
- Massi et al. (2012) Massi, M., Ros, E., & Zimmermann, L. 2012, A&A, 540, A142
- Massi & Jaron (2013) Massi, M., & Jaron, F. 2013, A&A, 554, A105
- McSwain et al. (2010) McSwain, M. V., Grundstrom, E. D., Gies, D. R., & Ray, P. S. 2010, ApJ, 724, 379
- Papitto et al. (2012) Papitto, A., Torres, D. F., & Rea, N. 2012, ApJ, 756, 188
- Paredes (1987) Paredes, J. M., 1987, PhD thesis, University of Barcelona
- Paredes et al. (1991) Paredes, J. M., Marti, J., Estalella, R., & Sarrate, J. 1991, A&A, 248, 124
- Paredes et al. (1997) Paredes, J. M., Martí, J., Peracaula, M., & Ribo, M. 1997, A&A, 320, L25
- Paredes et al. (1994) Paredes, J. M., Marziani, P., Martí, J., et al. 1994, A&A, 288, 519
- Romero et al. (2007) Romero, G. E., Okazaki, A. T., Orellana, M., & Owocki, S. P. 2007, A&A, 474, 15
- Steele et al. (1996) Steele, I. A., Coe, M. J., Fabregat, J., et al. 1996, A&AS, 120, 213
- Taylor et al. (1992) Taylor, A. R., Kenny, H. T., Spencer, R. E., & Tzioumis, A. 1992, ApJ, 395, 268
- Torres et al. (2010) Torres, D. F., Zhang, S., Li, J., et al. 2010, ApJ, 719, L104
- Woźniak et al. (2004) Woźniak, P. R., Vestrand, W. T., Akerlof, C. W., et al. 2004, AJ, 127, 2436
- Wynn et al. (1997) Wynn, G. A., King, A. R., & Horne, K. 1997, MNRAS, 286, 436
- Zaitseva & Borisov (2003) Zaitseva, G. V., & Borisov, G. V. 2003, Astronomy Letters, 29, 188
- Zamanov et al. (1999) Zamanov, R. K., Martí, J., Paredes, J. M., et al. 1999, A&A, 351, 543
- Zamanov et al. (2001) Zamanov, R., Marti, J., & Marziani, P. 2001, The Second National Conference on Astrophysics of Compact Objects, 50 (astro-ph/0110114)
- Zamanov et al. (2013) Zamanov, R., Stoyanov, K., Marti, J., et al. 2013, A&A, arXiv:1309.3947
| phase bin | EW(H) | ||||||
|---|---|---|---|---|---|---|---|
| [Å] | [Å] | [Å] | [Å] | [mag] | [km s-1] | ||
| 0.00-0.05 | 4.7800.306 | 6.3920.343 | 0.74680.0229 | 11.1730.629 | 10.71750.0189 | 336.074.28 | |
| 0.05-0.10 | 5.1380.193 | 6.2560.135 | 0.81900.0212 | 11.4090.295 | 10.73170.0129 | 327.172.43 | |
| 0.10-0.15 | 4.5580.304 | 5.7750.256 | 0.79170.0377 | 10.3800.460 | 10.75140.0172 | 338.613.22 | |
| 0.15-0.20 | 5.2410.140 | 6.0960.151 | 0.86720.0271 | 11.3370.237 | 10.75500.0121 | 341.303.24 | |
| 0.20-0.25 | 5.4150.201 | 6.0740.162 | 0.89740.0351 | 11.4890.311 | 10.74150.0142 | 344.924.01 | |
| 0.25-0.30 | 5.3420.270 | 5.9900.161 | 0.89690.0450 | 11.3320.343 | 10.74000.0146 | 339.694.96 | |
| 0.30-0.35 | 5.5030.219 | 6.0360.252 | 0.92320.0349 | 11.5390.428 | 10.76170.0083 | 328.424.34 | |
| 0.35-0.40 | 7.2450.497 | 6.5170.398 | 1.14650.1090 | 13.4020.690 | 10.74780.0066 | 312.957.86 | |
| 0.40-0.45 | 6.1630.313 | 6.3260.227 | 0.97970.0408 | 12.3540.480 | 10.74450.0112 | 321.895.93 | |
| 0.45-0.50 | 6.2470.473 | 7.2740.513 | 0.86130.0304 | 13.5210.962 | 10.76380.0105 | 319.3511.4 | |
| 0.50-0.55 | 6.2740.356 | 8.1730.274 | 0.76380.0297 | 14.0840.580 | 10.73470.0078 | 324.8710.0 | |
| 0.55-0.60 | 5.5650.206 | 7.1940.237 | 0.77870.0234 | 12.4900.371 | 10.72000.0187 | 336.067.74 | |
| 0.60-0.65 | 5.2310.201 | 7.1470.173 | 0.73660.0236 | 12.2380.337 | 10.73370.0165 | 336.234.30 | |
| 0.65-0.70 | 5.2120.218 | 7.9350.384 | 0.67580.0293 | 13.1480.545 | 10.73000.0113 | 353.554.16 | |
| 0.70-0.75 | 4.5630.273 | 6.6370.363 | 0.65360.0507 | 11.2700.517 | 10.72310.0122 | 345.934.87 | |
| 0.75-0.80 | 4.8290.310 | 6.8920.226 | 0.61010.0685 | 11.4330.507 | 10.72400.0119 | 339.715.57 | |
| 0.80-0.85 | 4.4160.265 | 6.2740.251 | 0.62910.0622 | 10.4350.452 | 10.71070.0158 | 344.065.48 | |
| 0.85-0.90 | 4.4850.226 | 6.7400.289 | 0.66510.0184 | 11.1970.464 | 10.71400.0111 | 333.274.36 | |
| 0.90-0.95 | 4.4800.232 | 6.4780.273 | 0.69150.0203 | 10.6260.516 | 10.72210.0123 | 343.306.78 | |
| 0.95-1.00 | 4.6280.274 | 6.2120.245 | 0.73730.0221 | 10.6010.534 | 10.71000.0116 | 338.964.48 | |