Photometric and spectroscopic studies of
star-forming regions within Wolf-Rayet galaxies
Abstract
We present a study of the properties of star-forming regions within a sample of 7 Wolf-Rayet (WR) galaxies. We analyze their morphologies, colours, star-formation rate (SFR), metallicities, and stellar populations combining broad-band and narrow-band photometry with low-resolution optical spectroscopy. The observations were made through the 2m HCT (Himalayan Chandra Telescope) and 1m ARIES telescope. The spectroscopic data were obtained using the Hanle Faint Object Spectrograph Camera (HFOSC) mounted on the 2m HCT. The observed galaxies are NGC 1140, IRAS 07164+5301, NGC 3738, UM 311, NGC 6764, NGC 4861 and NGC 3003. The optical spectra have been used to search for the faint WR features, to confirm that the ionization of the gas is consequence of the massive stars, and to quantify the oxygen abundance of each galaxy using several and independent empirical calibrations. We detected the broad features originated by WR stars in NGC 1140 and NGC 4861 and used them to derive their population of massive stars. For these two galaxies we also derive the oxygen abundance using a direct estimation of the electron temperature of the ionized gas. The N/O ratio in NGC 4861 is 0.25-0.35 dex higher than expected, which may be a consequence of the chemical pollution by N-rich material released by WR stars. Using our H images we have identified tens of regions within these galaxies, for which we derived the SFR. Our H-based SFR usually agrees with the SFR computed using the far-infrared and the radio-continuum flux. For all regions we found that the most recent star-formation event is 3 – 6 Myr old. We used the optical broad-band colours in combination with Starburst99 models to estimate the internal reddening and the age of the dominant underlying stellar population within all these regions. Knots in NGC 3738, NGC 6764 and NGC 3003 generally show the presence of an important old (400 – 1000 Myr) stellar population. However, the optical colours are not able to detect stars older than 20 – 50 Myr in the knots of the other four galaxies. This fact suggests both the intensity of the starbursts and that the star-formation activity has been ongoing for at least some few tens of million years in these objects.
Keywords:
galaxies: starburst – galaxies: photometry – galaxies: stellar populations – galaxies: abundances – galaxies: SFR – stars: Wolf-Rayet| Object Name | NGC 1140 | IRAS 07164+5301d | NGC 3738 | UM 311 | NGC 6764 | NGC 4861 | NGC 3003 |
|---|---|---|---|---|---|---|---|
| RA [J2000] | 02 54 33 | 07 20 25 | 11 35 49 | 01 15 34 | 19 08 16 | 12 59 02 | 09 48 36 |
| Dec [J2000] | –10 01 40 | +52 55 32 | +54 31 26 | –00 51 46 | +50 56 00 | +34 51 34 | +33 25 17 |
| [ mag ] | 12.8 | 14.13 | 12.13 | 17.9 | 12.56 | 12.9 | 12.33 |
| Vr [ km s-1 ] | 1501 | 12981 | 229 | 1675 | 2416 | 833 | 1478 |
| Distancee [ Mpc ] | 17.90 | 177 | 5.56 | 18.7 | 31.3 | 14.8 | 24.00 |
| E(B-V)[ mag ] | 0.038 | 0.075 | 0.010 | 0.039 | 0.067 | 0.010 | 0.013 |
| [ mag ] | 18.43 | 22.03 | 16.59 | 13.42 | 19.85 | 17.94 | 19.56 |
| 0.010 | 0.014 | 0.0089 | 0.0074 | 0.0195 | 0.0033 | 0.016 | |
| 1.2 arcminf [ kpc ] | 6.1 | 61.0 | 1.9 | 6.4 | 10.6 | 5.1 | 8.16 |
a: Data taken from NASA/Extragalactic Database (NED).
b: , assuming 12+log(O/H)⊙ = 8.66, Asplund et al. (2005).
c: Foreground extinction from Schlegel et al (1998).
d: Parameters derived in this work.
e: Luminosity distance.
f: Projected distance, in kpc, of 1.2 arcmin at the distance of the galaxy.

1 Introduction
Wolf-Rayet (WR) galaxies are defined as those galaxies which show broad emission features associated to WR stars in their integrated spectra. The presence of the Wolf-Rayet stars are reflected in galaxy spectrum as two important broad features, the blue WR bump (between 4650 - 4690 Å, mainly due to N iii, N v and He ii) and the red WR bump (at 5808 Å, due to C iv emission line). The nebular He ii 4686 is also associated to the presence of these massive stars, however other ionization mechanisms may also create this line, as discussed by Garnett et al. (1991); Garnett (2004); Guseva, Izotov & Thuan (2000) and López-Sánchez & Esteban (2010a). Wolf-Rayet galaxies were first cataloged by Conti (1991) and later by Schaerer, Contini & Pindao (1999), but hundreds of these objects were found using the Sloan Digital Sky Survey, SDSS (Zhang et al., 2007; Brinchmann, Kunth & Durret, 2008).
The morphological type of WR galaxies varies from the low-mass blue compact dwarf (BCD) irregular galaxies, to massive spirals and luminous merging galaxies. WR features are often found in starburst galaxies. The progenitors of the Wolf-Rayet stars are the most massive ( for ), luminous (105 to 106 ) and hot (50,000 K) O stars, and they finalize their days exploding as type Ib/Ic supernovae (Meynet & Maeder, 2005). Actually, the minimum stellar mass that an O star needs to reach the WR phase and its duration depends on the metallicity. In general, the WR phenomenon is short lived, it exists only for Myr.
Hence, the detection of WR features in the spectra of a galaxy constrains the properties of the star-formation processes. Because the first WR stars typically appear around 2 – 3 Myr after the starburst is initiated and disappear within some 5 Myr (Meynet & Maeder, 2005), their detection informs about both the youth and strength of the burst, offering the opportunity to study an approximately coeval sample of very young starbursts (Schaerer & Vacca, 1998) and the role that interaction with or between dwarf galaxies and/or low surface brightness objects plays in the triggering mechanism of the strong star-formation activity (López-Sánchez & Esteban, 2008; López-Sánchez, 2010). Furthermore, the detection of WR stars also allows to study the formation and feedback of massive stars in starburst galaxies (Guseva et al., 2000; Fernandes et al., 2004; Buckalew et al., 2005; López-Sánchez & Esteban, 2010a; López-Sánchez & Esteban, 2010b).

| Broad-band Images | H images | Optical Spectroscopy | ||||||||||||||
| Galaxy | Date | Teles. | Date | H | Date | Exp. T. | PA | Airmass | ||||||||
| [s] | [s] | [s] | [s] | [s] | [s] | [s] | [s] | [∘] | ||||||||
| NGC 1140 | 14/12/2007 | 3900 | 3600 | 2700 | 3000 | 3300 | ARIES | 17/12/2006 | 2100 | 900 | 05/12/2007 | 1900 | 90 | 1.38 | ||
| IRAS 07164+5301 | 16/02/2010 | 7x900 | 5x600 | 5x300 | 5x240 | 5x240 | HCT | 16/02/2010 | 4x900 | 3x180 | 15/02/2010 | 900 | 90 | 1.09 | ||
| NGC 3738 | 17/02/2010 | 6x720 | 7x480 | 7x300 | 6x240 | 5x240 | HCT | 12/03/2008 | 1200 | 300 | 15/02/2010 | 1500 | 90 | 1.10 | ||
| UM 311 | 31/10/2008 | 3000 | 1200 | 900 | 360 | 260 | HCT | 31/10/2008 | 4200 | 360 | 16/02/2010 | 1800 | 135 | 2.20 | ||
| NGC 6764 | 31/10/2008 | 3200 | 650 | 360 | 200 | 200 | HCT | 31/10/2008 | 2x900 | 900 | 11/07/2011a | 1200 | 70 | 1.08 | ||
| ” knot #1 | … | … | … | … | … | … | … | … | … | … | 31/10/2008b | 3000 | 80 | 1.15 | ||
| NGC 4861 | 03/05/2011 | 2x600 | 2x450 | 2x300 | 3x150 | 3x150 | HCT | 26/01/2011 | 1210 | 120 | 01/02/2011 | 1800 | 90 | 1.13 | ||
| NGC 3003 | 26/03/2009 | 2700 | 1450 | 1300 | 960 | 940 | HCT | 17/12/2006 | 2x600 | 300 | 20/01/2012 | 2x1200 | 70 | 1.02 | ||
a: The spectrum was taken over the nuclear region (knot #2), which shows a clear AGN feature, and in region #3.
b: The spectrum was taken over the region #1 (see Fig. 5).

With the aim of getting a better understanding of the properties of the WR galaxies, we have performed a detailed analysis of a sample of these objects using broad-band , narrow-band H imaging and low-resolution optical spectroscopy. In this paper we present the results of 7 of our analyzed WR galaxies. We compile the main properties of these objects in Table 1.
The paper is organized as follows: observations and data reduction are described in Sect. 2. The broad-band and narrow-band photometric results are presented in Sect. 3. This section includes the identification of the star-forming regions, the determinations of their optical colours, and the estimation of the both the SFR and the most recent star-forming episode via the analysis of the net-H images. Section 4 describes our results from optical spectroscopy. We here analyze the physical conditions of the ionized gas (reddening, nature of the ionization, electron density and electron temperature when possible) and compute the oxygen abundances of the ionized gas within our sample galaxies. Section 4 also includes the analysis of the WR features in NGC 1140 and NGG 4861. We discuss our results in Sect 5, where we first describe how we determined the ages of both the old and young stellar populations. We also present the analysis of the individual galaxies in Sect. 5. Finally, we list our summary and conclusions in Sect. 6.
2 Observations and data reduction
Except for NGC 1140, broad-band (), narrow-band H (6563 Å/100 Å) and spectroscopic observations of the star-forming knots within our WR galaxy sample were obtained with HFOSC (Hanle Faint Object Spectrograph Camera) mounted on the 2m Himalayan Chandra Telescope (HCT), of the Indian Astronomical Observatory (IAO). HFOSC is equipped with a 2k4k SITe CCD chip. The central 2k2k region with plate scale of 0.296”/pixel, provides 1010 arcmin field of view.
Broad-band photometric observations of NGC 1140 were obtained in bands using ARIES 1m telescope with 2k2k CCD. The plate scale is 0.37”/pixel, covering an area of 12’.6 12’.6. Observations were done under photometric sky condition. To improve the signal to noise ratio (S/N) on chip binning mode was used. Apart from the galaxy frames, the typical calibration frames –e.g. bias, flats– were also taken for processing the science frames. Photometric standard stars from the list compiled by Landolt (1992) were observed for photometric calibration.

Spectroscopic observation of the galaxies were obtained with a combination of the slit 167l (slit width 1”.9211’) and Grism 7, covering a wavelength range 3500 Å– 7500 Å. This slit and grism combination gives a dispersion of 1.5 Å/pixel and a spectral resolution of 11 Å. As we used the HFOSC instrument at the 2m HCT for the majority of our spectroscopic observations, the spatial scale is 0.296”/pixel. In the case of our observations of NGC 1140, the spatial scale is 0.37”/pixel. The star-forming regions were identified using short exposures through the H filter and it then they were centered through the slit. The position of the slit used in each case is marked in Figures 1 to 7. The typical seeing was between 1.0 and 1.5 arcsec. Because of the low air-mass at which the galaxies were usually observed ( between 1.0 and 1.4), we should not expect problems coming from differential refraction. However, we did use the parallactic angle in the case of our observations of UM 311 because this galaxy was observed at an airmass of =2.2. Spectrophotometric standard star were observed for flux calibration of the spectrum. In this case we used the same Grism 7 but the broad slit 1340 (15”.4111’). A log of our observations is given in Table 2.
All preprocessing and data reduction was done in the standard manner using various tasks available with Image Reduction and Analysis Facility (IRAF11 1 IRAF is distributed by NOAO which is operated by AURA Inc., under cooperative agreement with NSF.). The Munich Image Data Analysis System (MIDAS) software was used for identification and removal of cosmic ray events from the science frames. All images were bias subtracted and flat-fielded using master bias and normalized master flats. Dark frames were not needed in any case. Multiple frames of the galaxies taken using different filters were aligned and co-added in a final frame.


| Object | Knot | Diameter | Size | |||||
|---|---|---|---|---|---|---|---|---|
| ID | [ mag ] | [ mag ] | [ mag ] | [ mag ] | [ mag ] | [ ” ] | [ kpc2 ] | |
| NGC 1140 | #1 | 12.100.03 | -0.640.03 | 0.010.02 | 0.150.03 | 0.280.03 | 28.8 | 4.77 |
| #2 | 16.990.14 | -0.550.09 | 0.160.10 | 0.270.11 | 0.570.15 | 9.6 | 0.53 | |
| #3 | 18.670.06 | -1.070.06 | -0.150.05 | 0.220.05 | 0.040.04 | 7.2 | 0.30 | |
| #4 | 16.540.06 | -1.120.06 | -0.160.04 | 0.150.05 | 0.110.06 | 19.2 | 2.12 | |
| IRAS 07164+5301 | … | 14.060.03 | -0.470.05 | 0.060.02 | 0.160.02 | 0.300.02 | 27.6 | 429 |
| NGC 3738 | … | 13.010.07 | -0.540.04 | 0.200.05 | 0.190.06 | 0.560.06 | 32.4 | 0.57 |
| UM 311 | … | 16.930.03 | -1.120.02 | 0.070.02 | 1.670.03 | 0.160.03 | 14.4 | 1.29 |
| NGC 6764 | #1 | 12.660.04 | -0.920.08 | -0.150.03 | -0.100.03 | 0.600.03 | 8.4 | 1.24 |
| #2 | 10.680.03 | -0.810.07 | -0.190.03 | 0.010.03 | 0.300.02 | 15.6 | 4.28 | |
| #3 | 13.740.05 | -0.950.09 | -0.180.04 | -0.060.04 | 0.630.03 | 7.2 | 0.91 | |
| NGC 4861 | #1 | 13.830.05 | -0.810.08 | 0.330.02 | -0.060.04 | 0.110.04 | 35.1 | 4.85 |
| #2 | 19.920.09 | -0.960.10 | 0.640.07 | -0.090.08 | … | 7.0 | 0.194 | |
| #3 | 21.670.29 | -0.720.13 | -0.520.20 | 0.130.22 | 0.310.35 | 5.3 | 0.109 | |
| #4 | 19.270.08 | -0.920.08 | -0.170.06 | -0.010.07 | … | 7.9 | 0.246 | |
| #5 | 20.490.14 | -0.880.12 | -0.080.12 | 0.250.10 | 0.080.25 | 7.0 | 0.194 | |
| #6 | 19.920.07 | -0.630.07 | -0.320.05 | 0.280.06 | 0.470.21 | 5.3 | 0.109 | |
| #7 | 19.740.11 | -1.100.10 | -0.030.08 | 0.160.09 | … | 7.9 | 0.246 | |
| #8 | 19.280.07 | -0.990.07 | -0.110.05 | 0.350.06 | 0.330.11 | 7.9 | 0.246 | |
| #9 | 20.480.14 | -0.380.13 | -0.030.09 | 0.290.12 | 0.210.23 | 7.9 | 0.246 | |
| #10 | 21.200.13 | -0.840.20 | 1.020.11 | 0.350.11 | … | 4.4 | 0.076 | |
| #11 | 21.120.20 | -0.710.14 | -0.120.14 | 0.430.16 | … | 4.4 | 0.076 | |
| #12 | 20.180.07 | -1.060.08 | 0.200.05 | 0.210.06 | 0.410.15 | 7.0 | 0.194 | |
| NGC 3003 | #1 | 20.820.08 | -1.160.08 | 0.230.06 | 0.490.07 | … | 5.0 | 0.258 |
| #2 | 20.440.13 | -0.930.10 | 0.070.10 | 0.330.10 | 0.740.18 | 5.5 | 0.313 | |
| #3 | 16.940.02 | -0.710.06 | 0.300.02 | 0.420.02 | … | 18.0 | 3.35 | |
| #4 | 20.520.23 | -0.850.12 | -0.110.13 | 0.290.20 | 0.800.14 | 5.5 | 0.313 | |
| #5 | 20.880.27 | -1.460.16 | 0.100.21 | 1.200.21 | 1.450.21 | 9.0 | 0.837 | |
| #6 | 19.180.11 | -0.570.08 | -0.060.06 | 0.160.09 | 0.250.09 | 9.0 | 0.837 | |
| #7 | 20.460.22 | -0.190.20 | 0.230.15 | 0.310.19 | 0.630.15 | 5.0 | 0.258 | |
| #8 | 20.850.24 | -1.170.10 | -0.160.14 | 0.180.21 | 0.520.24 | 5.5 | 0.313 | |
| #9 | 19.890.24 | -0.340.18 | 0.580.18 | 0.640.11 | 0.880.17 | 5.5 | 0.313 | |
| #10 | 22.270.71 | -1.200.22 | -0.580.50 | … | … | 6.0 | 0.372 | |
| #11 | 22.200.49 | -0.980.25 | -0.980.96 | … | … | 5.0 | 0.258 | |
| #12 | 18.390.22 | -0.880.10 | 0.210.12 | 0.420.20 | 0.900.18 | 9.0 | 0.837 | |
| #13 | 14.450.02 | -0.210.06 | 0.650.02 | 0.590.01 | 1.110.01 | 29.0 | 8.69 | |
| #14 | 19.140.13 | -0.560.08 | -0.330.09 | 0.560.10 | 0.490.14 | 8.0 | 0.662 | |
| #15 | 17.340.11 | -0.530.09 | 0.290.08 | 0.480.09 | 1.040.09 | 15.0 | 2.33 | |
| #16 | 19.820.06 | -0.960.08 | 0.180.03 | 0.340.05 | 0.950.05 | 5.5 | 0.313 | |
| #17 | 20.530.11 | -0.350.10 | 0.080.07 | -0.040.10 | 0.450.09 | 5.0 | 0.258 | |
| #18 | 16.710.04 | -0.410.08 | 0.200.03 | 0.410.04 | 0.850.04 | 15.0 | 2.33 | |
| #19 | 19.560.19 | -0.670.10 | -0.450.14 | 0.650.14 | 0.780.18 | 8.0 | 0.662 | |
| #20 | 19.380.05 | -0.750.06 | 0.120.03 | 0.350.05 | 0.710.04 | 5.5 | 0.313 | |
| #21 | 18.570.13 | -0.260.12 | 0.200.10 | 0.350.10 | 0.910.09 | 7.0 | 0.507 | |
| #22 | 18.100.05 | -0.630.06 | 0.280.03 | 0.440.04 | 1.180.05 | 9.0 | 0.837 | |
| #23 | 20.490.12 | -1.110.08 | -0.000.07 | 0.410.10 | … | 6.0 | 0.372 | |
| #24 | 20.000.06 | -1.080.09 | 0.110.04 | 0.440.05 | 0.810.07 | 6.0 | 0.372 | |
| #25 | 21.050.15 | -1.230.15 | 0.480.13 | 0.280.13 | 0.610.15 | 5.0 | 0.258 |
Narrow-band H line images were obtained following the standard procedure described by Waller (1990). -band image is used for continuum subtraction. Spectrophotometry standard stars chosen from Oke (1990) were observed to calibrate the H images. A scale factor between the H and -band images was determined using the non-saturated field stars in the galaxy field, after taking care of the difference in the full-width-half-maximum (FWHM) of the stellar profile. The -band continuum image was scaled to the H image and subtracted from H image to get the H line image of the galaxy. We then defined apertures to cover all the flux coming from different knots throughout each galaxy. A nearby emission-free region was always considered to estimate the surrounding background. The H-fluxes of the knots were then flux calibrated using the results provided by the standard stars.
The spectroscopic data analysis was also performed using standard routines of the IRAF software. For each two-dimensional spectra we extracted an one-dimensional spectrum integrating a particular region along the spatial direction, usually centering on the brightest point of the galaxy, We carefully checked that the one-dimensional spectrum obtained for each object had the optimal signal-to-noise (SNR), i.e., that the emission lines are not diluted by the stellar continuum and that the SNR is high. We list the size of the aperture used for each galaxy in Table 5. Each 1-D spectrum was then wavelength calibrated using a FeAr arc spectrum. The absolute flux calibration of the spectra was achieved by observing spectrophotometry standard stars chosen from Oke (1990). We also used IRAF to correct the spectra for foreground extinction using the Galactic values listed in Table 1 and extracted from Schlegel, Finkbeiner & Davis (1998).
3 Photometry results
The -band and the continuum-subtracted H images of all galaxies are shown in Fig. 1 to 7. We used the continuum-subtracted H images to identify the star-forming regions (knots) within each galaxy. The knots were identified by visual inspection. However, a threshold of 4-5 times sigma of background was taken to delimit the size of each knot. We always consider circular apertures. The diameter of the regions (in ”) and their corresponding physical size (in kpc2) have been compiled in Table 3. The corresponding identity number for each star-forming region is included in Fig. 1 to 7.
| Galaxy | Metallicity | Flux | Luminosity | log SFR | log (SFR/Area) | (H) | Age | [N ii]/H |
|---|---|---|---|---|---|---|---|---|
| Knot ID | [10-14 erg s-1 cm-2] | [1038 erg s-1] | [ yr-1] | [ yr-1 kpc-2 ] | [Å] | [Myr] | ||
| NGC 1140 | 0.008 | 0.13 | ||||||
| # 1 | 20410 | 77738 | -0.210.02 | -0.890.02 | 38480 | 5.00.2 | ||
| # 2 | 2.810.25 | 10.720.96 | -2.070.04 | -1.790.04 | 43280 | 4.80.1 | ||
| # 3 | 1.180.11 | 4.520.41 | -2.450.04 | -1.920.04 | 888240 | 4.20.6 | ||
| # 4 | 9.000.27 | 332 | -1.580.03 | -1.910.03 | 976240 | 3.50.6 | ||
| IRAS 07164+5301a | 0.008 | 109 | 9650 | 0.88 | -1.27 | 8210 | 6.50.2 | … |
| NGC 3738 | 0.008 | 1195 | 442 | -1.460.02 | -1.210.02 | 12424 | 6.20.2 | 0.18 |
| UM 311 | 0.008 | 201 | 825 | -1.190.03 | -1.300.03 | 130080 | 3.20.1 | 0.09 |
| NGC 6764 | 0.02 | |||||||
| # 1 | 12.00.4 | 1309 | -0.990.03 | -1.080.03 | 15040 | 6.00.1 | 0.32 | |
| # 2b | 1528 | 177690 | 0.150.02 | -0.480.02 | 45040 | 4.80.3 | 1.40b | |
| # 3 | 10.00.4 | 1079 | -1.070.04 | -1.030.04 | 30040 | 5.60.1 | 0.32 | |
| NGC 4861 | 0.004 | 0.03 | ||||||
| #1 | 22311 | 58329 | -0.330.02 | -1.020.02 | 845150 | 4.60.2 | ||
| #2 | 1.120.10 | 2.930.26 | -2.630.04 | -1.920.04 | 1417470 | 3.00.8 | ||
| #3 | 1.150.10 | 3.010.27 | -2.620.04 | -1.660.04 | 2878950 | 1.5: | ||
| #4 | 0.370.03 | 0.970.09 | -3.110.04 | -2.500.04 | 20260 | 6.10.5 | ||
| #5 | 0.400.04 | 1.040.09 | -3.080.04 | -2.370.04 | 21870 | 6.00.6 | ||
| #6 | 0.350.03 | 0.900.08 | -3.150.04 | -2.180.04 | 26790 | 5.60.6 | ||
| #7 | 0.810.07 | 2.110.19 | -2.780.04 | -2.170.04 | 585190 | 4.90.2 | ||
| #8 | 0.640.06 | 1.680.15 | -2.870.04 | -2.270.04 | 480160 | 5.00.2 | ||
| #9 | 0.440.04 | 1.150.10 | -3.040.04 | -2.430.04 | 556180 | 5.00.2 | ||
| #10 | 0.240.02 | 0.620.06 | -3.310.04 | -2.190.04 | 666220 | 4.80.2 | ||
| #11 | 0.310.03 | 0.820.07 | -3.190.04 | -2.070.04 | 615210 | 4.90.2 | ||
| #12 | 1.100.10 | 2.870.26 | -2.640.04 | -1.930.04 | 1285430 | 3.70.9 | ||
| NGC 3003 | 0.02 | 0.36 | ||||||
| # 1 | 0.230.02 | 1.580.14 | -2.900.04 | -2.310.04 | 31990 | 5.60.2 | ||
| # 2 | 0.310.03 | 2.120.19 | -2.770.04 | -2.270.04 | 411120 | 5.30.9 | ||
| # 3 | 11.00.2 | 725 | -1.240.03 | -1.770.03 | 11930 | 6.10.1 | ||
| # 4 | 0.170.02 | 1.170.11 | -3.030.04 | -2.530.04 | 21570 | 5.80.2 | ||
| # 5 | 0.900.08 | 6.20.6 | -2.310.04 | -2.230.04 | 984230 | 3.30.1 | ||
| # 6 | 0.770.07 | 5.30.5 | -2.380.04 | -2.300.04 | 364110 | 5.50.5 | ||
| # 7 | 0.160.01 | 1.130.10 | -3.050.04 | -2.460.04 | 30490 | 5.60.2 | ||
| # 8 | 0.330.03 | 2.30.2 | -2.750.04 | -2.240.04 | 874220 | 3.40.2 | ||
| # 9 | 0.470.04 | 3.20.3 | -2.590.04 | -2.090.04 | 568150 | 3.80.9 | ||
| # 10 | 0.380.03 | 2.70.2 | -2.680.04 | -2.250.04 | 1274280 | 3.10.2 | ||
| # 11 | 0.360.03 | 2.50.2 | -2.710.04 | -2.120.04 | 480130 | 4.70.9 | ||
| # 12 | 1.300.12 | 8.90.8 | -2.150.04 | -2.070.04 | 391110 | 5.30.5 | ||
| # 13 | 14.01.0 | 1017 | -1.100.03 | -2.030.03 | 8720 | 6.30.1 | ||
| # 14 | 0.450.04 | 3.10.3 | -2.610.04 | -2.430.04 | 10740 | 6.20.2 | ||
| # 15 | 2.90.3 | 201 | -1.800.02 | -2.170.02 | 15250 | 6.00.2 | ||
| # 16 | 0.540.05 | 3.70.3 | -2.530.04 | -2.030.04 | 443120 | 4.80.9 | ||
| # 17 | 0.240.02 | 1.670.15 | -2.880.04 | -2.290.04 | 513140 | 4.00.9 | ||
| # 18 | 3.20.3 | 222 | -1.760.04 | -2.130.04 | 9030 | 6.20.2 | ||
| # 19 | 0.660.06 | 4.50.4 | -2.440.04 | -2.260.04 | 20570 | 5.80.2 | ||
| # 20 | 0.450.04 | 3.10.3 | -2.610.04 | -2.110.04 | 20570 | 5.80.2 | ||
| # 21 | 0.730.07 | 5.00.5 | -2.400.04 | -2.110.04 | 14650 | 6.00.2 | ||
| # 22 | 1.830.16 | 131 | -1.990.03 | -1.910.03 | 31990 | 5.60.2 | ||
| # 23 | 0.570.05 | 3.90.4 | -2.500.04 | -2.080.04 | 869210 | 3.40.1 | ||
| # 24 | 0.860.08 | 5.90.5 | -2.330.04 | -1.900.04 | 799200 | 3.40.2 | ||
| # 25 | 0.250.02 | 1.710.15 | -2.870.04 | -2.280.04 | 686180 | 3.50.6 |
aThe H data for IRAS 07164+5301 have been derived using the spectroscopic data. See text.
bThe center of NGC 6764 (knot #2) is a LINER (see Sect. 4.1), and hence the emission coming from the [N ii] lines is larger (1.4 times) than the emission coming from H. See text for details.
3.1 Broad-band photometry
Aperture photometry of the star-forming regions was carried out within the circular apertures drawn in Figs. 1 to 7. We then computed the apparent -magnitude, , and the colors , , , and , of all regions.
Broad-band colours were corrected for foreground extinction –i.e., Galactic extinction– using the data provided by Schlegel et al. (1998) and listed in Table 1. All derived magnitudes and colors are compiled in Table 3.
Table 3 does not include a correction for internal extinction. However, for many knots we are able to determine this correction by the comparison of the broad-band colors with the predictions given by the Starburst99 (Leitherer et al., 1999) evolutionary synthesis models, as we will explain in Sect. 5.2. In any case, for the majority of the knots the correction for internal extinction seems to be small, even almost zero.
No correction for emission lines from the ionized gas has been considered, although it may be important in some bright, intense, star-forming knots (Salzer, MacAlpine & Boroson, 1989; López-Sánchez & Esteban, 2008; Reines et al., 2010, e.g.,), as we will explain in Sect. 5.2.
Uncertainties quoted in Table 3 consider only the photometric error.
3.2 Narrow-band H photometry
We used the continuum-subtracted H image (see Figs. 1 to 7) to estimate the H flux of every star-forming knot within each galaxy. H fluxes have been corrected for extinction assuming:
| (1) |
following López-Sánchez & Esteban (2008), who considered a Milky Way reddening law with following Cardelli, Clayton & Mathis (1989). Here considers both the foreground and the intrinsic extinction, as listed in Table 1 (Galactic extinction) and Table 9 (internal extinction), i.e.,
| (2) |
The measured H flux is contaminated by [N ii] 6548,6583 emission. The estimation of the [N ii] contribution was derived using the [N ii] 6548,6583/H ratio derived from our optical spectroscopic data (which is listed in last column of Table 4) and applying
| (3) |
where and are, respectively, the corrected and uncorrected H flux. We did not consider the transmittance of the narrow-band filter in the position of the [N ii] lines –as it is explained in López-Sánchez & Esteban (2008)– because of the relatively large FWHM ( Å) of the narrow-band filter used. The corresponding [N ii]/H ratio was typically found between 0.03 (NGC 4861) and 0.36 (NGC 3003). Except for the case of NGC 6764, we considered that all knots within a galaxy have the same [N ii] contribution we estimated for the region we have spectroscopic data. Knot 2 within NGC 6764 is the center of the galaxy, which is a low-ionization nuclear emission-line region (LINER, see Sect. 4.1), and hence the emission coming from the [N ii] lines is 1.4 times larger than the emission coming from H.
The final H fluxes corrected for both extinction and [N ii] contribution derived for each star-forming region are compiled in Table 4.
Using the H fluxes and considering the distance to the galaxies listed in Table 1, we derived the total H luminosity for the analyzed star-forming regions within our WR galaxy sample. The results are also listed in Table 4.
The H luminosity can be used as a good tracer of star formation activity in galaxies (Kennicutt, 1998; Calzetti et al., 2007, e.g.,). The radiation from the young stars ionizes the surrounding hydrogen gas, giving rise to H emission by recombination. Since the H luminosity is proportional to the number of ionizing photons produced by the hot stars (which is also proportional to their birth rate), the star-formation rate (SFR) can be easily derived from the H luminosity. Only stars with masses and life time Myr contribute significantly to the integrated ionizing flux, so the emission lines provide a nearly instantaneous measure of the SFR, independent of the previous star formation history.
We adopted the standard Kennicutt (1998) relation to derive the SFR from the H luminosity.
We compile the H-based SFR values for star-forming knots observed in our WR galaxy sample in Table 4.

Since this galaxy IRAS 07164+5301 has a larger redshift than the other objects (it has a radial velocity of 12,981 km s-1, which means a redshift of ), the continuum subtraction results with null. In this case, we estimated its H luminosity through our spectroscopy data. Considering the size and width of the slit used to get the spectrum of this galaxy (1.92”5.2”, see Table 5) and the corresponding angular size of the galaxy (10”21”), we estimate that the total H flux of the galaxy is times the extinction-corrected H flux we measured using our spectrum. Taking into account the values for Galactic (Table 1) and internal (Table 5) reddening, the H/H ratio (2.79) and the H flux (1.2710-14 erg s-1 cm-2), we estimate a total H flux of 1.0910-12 erg s-1 cm-2 for IRAS 07164+5301, which is the value tabulated in Table 4. Hence, its total SFR is SFR7.6 yr-1.
The H equivalent width, (H), of the star forming knots was calculated using the expression by Waller (1990). As it will be explained in Sect. 5.1, we will use (H) to estimate the age of the most recent star-formation event. Both quantities are also listed in Table 4 for each region.
We have also quantified the strength of the star-formation activity in each knot by computing their SFR per area. Table 4 also lists these values, in units of yr-1 kpc-2. Figure 8 compares the SFR per area with the H equivalent width derived for each knot. The dotted line at has been included for guiding the eye. Knots located over this line are experiencing a relatively high SFR per area and hence they might be considered as starburst regions (knot #1 in NGC 1140 and NGC 4861 and knots #1 and #3 in NGC 6764) or starburst galaxies (IRAS 07164+5301, UM 311, NGC 3738). Note that knot #2 in NGC 6764 hosts a LINER, as we discuss in the next section. In the case of NGC 3003 all knots are located well below the dotted line in Figure 8, suggesting that this is just a normal star-forming galaxy.
(a) (b)
(b) (c)
(c) (d)
(d) (e)
(e) (f)
(f)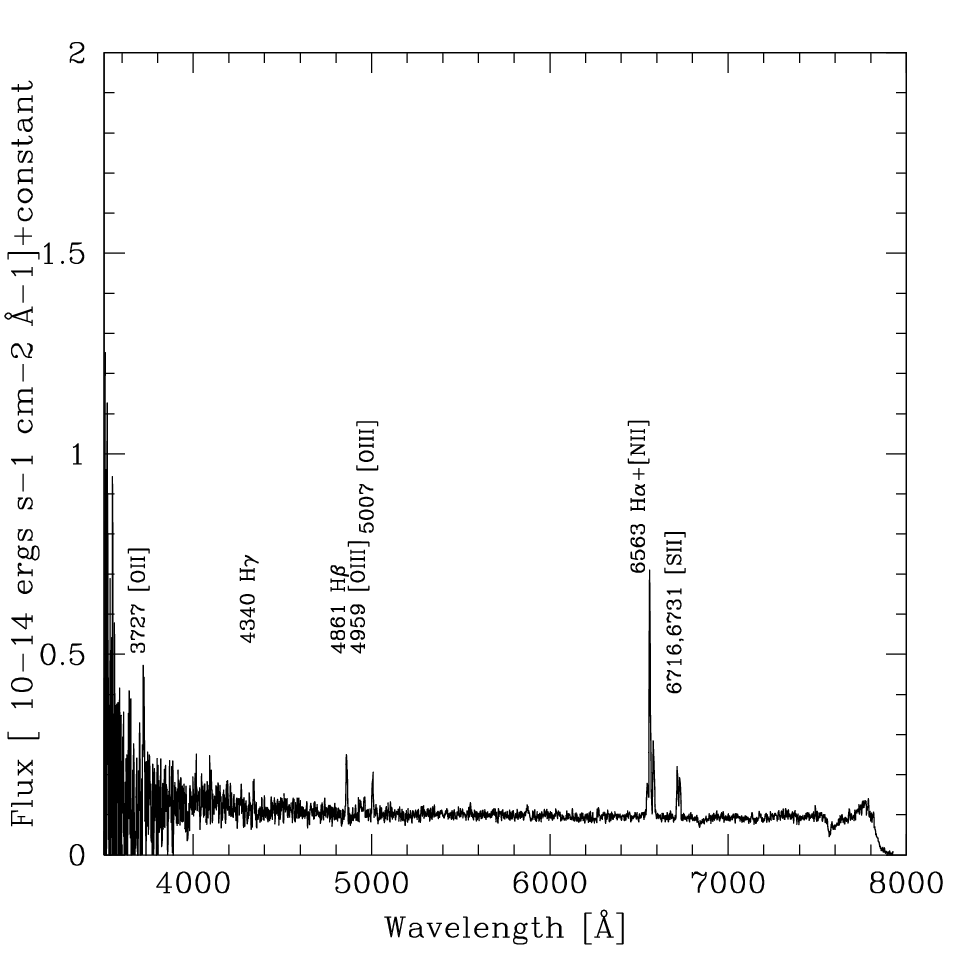
(a) (b)
(b)
4 Results from optical spectroscopy
The one-dimensional spectra obtained for our WR galaxy sample are plotted in Figs. 9 and 10. The prominent lines have been identified and marked in these plots. These are emission lines from the hydrogen and helium Balmer series, and forbidden emission lines due to oxygen, nitrogen and sulphur. These spectra have been corrected for foreground (Galactic) extinction using the corresponding values extracted from Schlegel et al. (1998) (see Table 1) and by making use of the IRAF deredden task. We then directly analyzed these dereddened spectra.
Line intensities and equivalent widths were measured by integrating all the flux in the line between two given limits and over a local continuum estimated by eye. In the cases of line blending (usually, in the H+[N ii] region), a multiple Gaussian profile plotting procedure was applied to obtain the line flux of each individual line. We used the standard assumption, i.e., that (H)=100, to compute the line intensity ratios.
| Line | NGC 1140 #1 | IRAS 07164+5301 | NGC 3738 | UM 311 | NGC 6764 #1 | NGC 4861 #1 | NGC 3003 #13 | |
|---|---|---|---|---|---|---|---|---|
| [O ii] 3728 | 0.322 | 24117 | 23828 | 680110 | 25790 | 14244 | 88.35.8 | 20965 |
| [Ne iii] 3869 | 0.291 | 21.93.9 | … | 41: | … | … | 37.02.5 | … |
| [Ne iii] 3969+H7 | 0.267 | 10.21.1 | … | … | … | … | 26.52.1 | … |
| H 4101 | 0.230 | 26.22.1 | … | 27: | … | … | 26.01.7 | … |
| H 4340 | 0.157 | 47.03.1 | 43.97.4 | 4913 | 3511 | 5014 | 47.22.5 | 4717 |
| [O iii] 4363 | 0.150 | 1.530.49 | … | … | … | … | 9.790.77 | … |
| He i 4471 | 0.116 | 3.630.64 | … | … | … | … | 3.280.35 | … |
| [Fe iii] 4658 | 0.059 | … | … | … | … | … | 0.930.26 | … |
| Broad He ii 4686 | 0.049 | 3.31.4 | … | … | … | … | 2.620.78 | … |
| [Ar iv] 4711 | 0.043 | … | … | … | … | … | 1.090.23 | … |
| [Ar iv] 4740 | 0.034 | … | … | … | … | … | 0.560.20 | … |
| H 4861 | 0.000 | 100.03.8 | 100.05.5 | 10010 | 10011 | 10012 | 100.03.3 | 10014 |
| [O iii] 4959 | 107.45.7 | 50.25.3 | 9614 | 10713 | 18.23.1 | 197.79.1 | 21.84.1 | |
| [O iii] 5007 | 27413 | 120.29.8 | 25731 | 27016 | 38.64.6 | 59626 | 58.26.5 | |
| Broad C iv 5808 | 3.340.35 | … | … | … | … | 1.230.37 | … | |
| He i 5876 | 16.81.3 | 43.94.8 | 28.05.2 | 16.15.6 | 13.8: | 10.280.59 | 12.8: | |
| [O i] 6300 | 4.480.41 | 11.01.9 | 12.43.5 | … | … | 1.780.15 | … | |
| [S iii] 6312 | … | … | … | … | … | 2.130.15 | … | |
| [N ii] 6548 | 10.51.1 | 43.94.8 | 15.54.9 | 5.5: | 33.83.9 | 2.550.32 | 5211 | |
| H 6563 | 28214 | 27919 | 28131 | 28125 | 28423 | 28213 | 28129 | |
| [N ii] 6583 | 30.61.8 | 75.46.0 | 44.26.5 | 28.12.6 | 1029 | 7.060.41 | 10312 | |
| He i 6678 | 3.490.46 | 4.21.4 | 4.5: | … | … | 3.230.24 | … | |
| [S ii] 6716 | 29.21.7 | 62.05.1 | 59.28.4 | 35.93.9 | 60.28.5 | 9.900.53 | 6911 | |
| [S ii] 6731 | 21.01.3 | 46.04.0 | 38.37.1 | 22.03.0 | 37.97.8 | 7.330.42 | 5310 | |
| He i 7065 | 2.440.60 | … | … | 1.7: | … | 2.320.31 | … | |
| [Ar iii] 7135 | 7.440.58 | 7.41.5 | 14.63.1 | 10.82.4 | … | 7.200.41 | 5.8: | |
| [10-14 erg cm-2 s-1] | 10.00.4 | 1.270.07 | 2.10.2 | 1.890.15 | 0.660.06 | 33.81.1 | 1.310.16 | |
| (H) [Å] | 21215 | 8210 | 545 | 1100100 | 10911 | 515 | ||
| (H) [Å] | 908 | 9.31.1 | 13.11.4 | 37650 | 22.82.9 | 14.01.6 | ||
| (H) [Å] | 12.91.2 | 6.90.6 | 4.80.6 | 6820 | 7.62.2 | 5.12.8 | ||
| (H) [Å] | 4.90.5 | … | 2.2: | … | … | … | ||
| Aperture size [arcsec] | 1.928.18 | 1.925.2 | 1.9212.3 | 1.923.4 | 1.9217.6 | 1.926.2 | 1.924.1 | |
| (H)internal | 0 | 0.060.02 | 0 | 0.170.03 | 0.020.01 | 0.040.01 | 0.040.01 | |
| (B-V)internal | 0 | 0.0410.014 | 0 | 0.120.02 | 0.0140.007 | 0.0280.007 | 0.0280.014 | |
| [Å] | 2.2 | 1.60.2 | 0 | 1.10.2 | 1.20.2 | 0.50.1 | 0.50.2 |
The results obtained for each galaxy are compiled in Table 5. These data have been corrected for both internal reddening and underlying stellar absorption following the method described in López-Sánchez & Esteban (2009). This is an iterative procedure to derive simultaneously the reddening coefficient, (H), and the equivalent widths of the absorption in the hydrogen lines, , to correct the observed line intensities for both effects. The method also assumes that is the same for all the Balmer lines and uses the relation given by Mazzarrella & Boronson (1993) to perform the absorption correction,
| (4) |
for each detected hydrogen Balmer line, where and are the observed and the theoretical fluxes (unaffected by reddening or absorption), , and are the equivalent widths of the underlying stellar absorption, the considered Balmer line and H, respectively, and is the reddening curve normalized to H using the Cardelli et al. (1989) extinction law. All these values are compiled in Table 5. We always considered the theoretical ratios of the pairs of H i Balmer lines expected for case B recombination given by Storey & Hummer (1995) assuming the derived electron temperature (only for the case of NGC 1140 and NGC 4861) or using the oxygen abundances derived from empirical calibrations (as we explain below) and the expected electron temperature for these values, following Tables 2 and 3 in López-Sánchez & Esteban (2010b). As we already corrected the spectra for foreground reddening, the obtained values of (H)internal represent the intrinsic extinction within each galaxy. We note that for two galaxies, NGC 1140 and NGC 3738, we assumed (H)internal=0 because the method gave slightly negative values for the reddening correction. Table 5 also includes the derived from the reddening coefficient, following = 0.692(H)internal.
4.1 Physical conditions of the ionized gas
We first analyze the nature of the ionization using the so-called diagnostic diagrams, as firstly proposed by Baldwin, Phillips & Terlevich (1981) and Veilleux & Osterbrock (1987). These diagnostic diagrams plot two different excitation line ratios for classifying the excitation mechanism of ionized nebulae. H ii regions (or H ii or starburst galaxies) lie within a narrow band within these diagrams, but when the gas is ionized by shocks, accretion disks, or cooling flows (in the case of AGNs or LINERs) its position in the diagram is away from the locus of H ii regions.
Figure 11 plots the typical [O iii] 5007/H versus [N ii] 6583/H and [O ii] 5007/H versus ([S ii] 6716+6731)/H diagrams. We used the analytic relations given by Dopita et al. (2000) and Kewley et al. (2001) between different line ratios to check the nature of the excitation mechanism of the ionized gas within the bursts. Actually, the dividing line given by the Kewley et al. (2001) models represents an upper envelope of positions of star-forming galaxies. The left panel of Fig. 11 includes the empirical relation between the [O iii] 5007/H and the [N ii] 6583/H provided by Kauffmann et al. (2003) analyzing a large data sample of star-forming galaxies from the SDSS (York et al., 2000). As we see, all analyzed regions lie below the Kewley et al. (2001) theoretical line. This clearly indicates that photoionization is the main excitation mechanism of the gas and that there is very little evidence for a significant contribution from shock excitation. However, this is not satisfied in the case of the center of NGC 6764 (red cross in Fig. 11). which lies in the region occupied for LINERs. Indeed, this starburst galaxy has been classified as a classical LINER galaxy in the past (Alonso-Herrero et al., 2000).

The electron density of the ionized gas, , was computed via the [S ii] 6716,6731 doublet by making use of the five-level program for the analysis of emission-line nebulae included in IRAF NEBULAR task (Shaw & Dufour, 1995). All regions were found in the low-density limit, cm-3, and hence we adopt =100 cm-3.
The electron temperature of the ionized gas was computed for only two galaxies: NGC 1140 and NGC 4861, as only in these two cases we detect the faint auroral [O iii] 4363 emission line. We therefore inferred ([O iii]) from the [O iii] (4959+5507)/4363 ratio by making use of the IRAF NEBULAR task. As we assumed a two-zone approximation to define the temperature structure of the nebula, we used ([O iii]) as representative of high-ionization potential ions. The electron temperature assumed for the low-ionization potential ions was derived from the linear relation between ([O iii]) and ([O ii]) provided by Garnett (1992). The results are listed in Table 6.
| NGC 1140 #1 | NGC 4861 #1 | |
|---|---|---|
| [O iii] [K] | 9500900 | 14000600 |
| [O ii] [K] | 9700700 | 12800500 |
| [cm-3] | 100 | 100 |
| 12+log(O+/H+) | 8.060.12 | 7.140.08 |
| 12+log(O++/H+) | 8.090.09 | 7.870.04 |
| 12+log(O/H) | 8.380.10 | 7.950.05 |
| log(O++/O+) | 0.030.14 | 0.730.09 |
| 12+log(N+/H+) | 6.820.06 | 5.900.05 |
| 12+log(N/H) | 7.130.10 | 6.700.09 |
| (N) | 2.080.21 | 6.380.95 |
| log(N/O) | -1.240.07 | -1.250.08 |
| 12+log(S+/H+) | 6.100.06 | 5.360.04 |
| 12+log(S++/H+) | … | 6.160.09 |
| (S) | … | 1.80.7 |
| 12+log(S/H) | … | 6.350.08 |
| log(S/O) | … | -1.590.12 |
| 12+log(Ne++/H+) | 7.480.15 | 7.010.06 |
| (Ne) | 1.93 0.65 | 1.190.22 |
| 12+log(Ne/H) | 7.160.19 | 7.090.10 |
| log(Ne/O) | -0.610.16 | -0.860.06 |
| 12+log(Ar++/H+) | 5.890.10 | 5.520.06 |
| 12+log(Ar+3/H+) | … | 4.780.11 |
| (Ar) | 0.690.23 | 0.460.02 |
| 12+log(Ar/H) | 5.730.18 | 5.600.06 |
| log(Ar/O) | -2.650.21 | -2.350.11 |
4.2 Estimation of the chemical abundances
The preferred method for determining oxygen abundances in galaxies using H ii regions is through electron temperature sensitive lines such as the [O iii] 4363 line, the so-called method (Peimbert & Costero, 1969; Stasińska, 1978; Esteban et al., 2004). However, in absence of [O iii] 4363 line, the alternative empirical relations, such as method (McGaugh, 1991, hereafter M91), method (Pilyugin, 2001a; Pilyugin, 2001b; Pilyugin & Thuan, 2005; Pilyugin et al., 2010), method (Kewley & Dopita, 2002, hereafter KD02), which use the strong emission lines, can be used for determining oxygen abundance. However, the use of these empirical methods must be done carefully, see recent reviews by López-Sánchez & Esteban (2010b) and López-Sánchez et al. (2012).
In our case, we can only derive the oxygen abundances of the ionized gas following the method for two galaxies: NGC 1140 and NGC 4861. We followed the very same prescriptions and ionization correction factors, icf, indicated by López-Sánchez & Esteban (2009) to compute the O, N, S, Ar and Ne abundances, and the N/O, S/O, Ar/O and Ne/O ratios, for the ionized gas within these two galaxies. In particular, we assumed a two-zone scheme for deriving the ionic abundances and considered the Garnett (1992) relation between [O iii] and [O ii]. We then used the IRAF nebular task (Shaw & Dufour, 1995) to compute the ionic abundances from the intensity of collisionally excited lines. We finally assumed the standard of Peimbert & Costero (1969) to derive the total N and Ne abundances. For NGC 4861 we have estimations of both S+/H+ and S++/H+ ratios, and hence we used the given by the photoionization models by Stasińska (1978) to derive the total S. The total Ar abundance was calculated by considering the proposed by Izotov, Thuan, & Lipovetski (1994). The results are compiled in Table 6. We note that we used an updated atomic dataset for O+, S+, and S+2 for nebular. The references of these of these updated values are indicated in Table 4 of García-Rojas et al. (2005).
| Galaxy Name / Knot | ||||||
|---|---|---|---|---|---|---|
| NGC 1140 #1 | 0.971 | 0.897 | 1.409 | 6.23 | 0.613 | 0.200 |
| IRAS 07164+5301 | 0.580 | 0.499 | 0.659 | 4.08 | 0.418 | 0.144 |
| NGC 3738 | 0.810 | 1.19 | 1.220 | 10.33 | 0.342 | 0.285 |
| UM 311 | 1.002 | 0.962 | 1.433 | 6.34 | 0.593 | 0.164 |
| NGC 6764 #1 | 0.446 | 0.141 | 0.0332 | 1.985 | 0.286 | 0.397 |
| NGC 4861 #1 | 1.602 | 1.10 | 2.37 | 8.82 | 0.900 | 0.953 |
| NGC 3003 #13 | 0.444 | 0.308 | 0.209 | 2.89 | 0.277 | 0.417 |
The definition of the parameters are:
= log([N ii] 6583/H),
= log [([O iii] 5007/H)/log([N ii] 6583/H)],
= log([N ii] 6583/[O ii] 3727),
= log [ ( [O ii] 3727 + [O iii] 4959 + [O iii] 5007)/H],
= ([O iii] 4959 + [O iii] 5007)/,
=log [ ([O iii] 4959 + [O iii] 5007) / [O ii] 3727 ].
We derive oxygen abundances –in units of 12+log(O/H)– of 8.380.10 and 7.950.05 for NGC 1140 and NGC 4861, respectively, being their associated N/O ratios –in units of log(N/O)– 1.240.07 and 1.250.08, respectively. The N/O ratio computed in NGC 1140 agrees with that expected for its O/H (Izotov & Thuan, 1999; Izotov et al., 2004; López-Sánchez & Esteban, 2010b, e.g.,). However, the N/O ratio derived in NGC 4861 is clearly higher than that expected for its oxygen abundance. Following the data compiled by these authors, an object with 12+log(O/H) between 7.9 and 8.0 should have an N/O ratio between 1.6 and 1.4. Hence, we estimate this excess in the N/O ratio in NGC 4861 on 0.25–0.35 dex. The fact that WR stars are clearly detected in this galaxy suggests that the excess of nitrogen has been released by the ejecta of these massive stars (Kobulnicky et al., 1997; Pustilnik et al., 2004; Brinchmann et al., 2008; López-Sánchez & Esteban, 2010b). However, only few observations confirming the localized N enrichment are nowadays available (Kobulnicky et al., 1997; López-Sánchez et al., 2007; James et al., 2009; Monreal-Ibero et al., 2010; López-Sánchez et al., 2011), and in some cases the chemical pollution produced by the WR stars detected are not able to explain the observed N excess (Pérez-Montero et al., 2011; Amorín et al., 2012).
For all galaxies (even those two for which we have a direct estimation of ) we estimate their oxygen abundances using the most-common empirical calibrations. Table 7 compiles all parameters (and their definitions) used for computing the oxygen abundances following these strong-line methods, while Table 8 lists the results. For more information about this methods and their equations, see Appendix A in López-Sánchez & Esteban (2010b). The KD02 method using the parameter can only be used for objects with 12+log(O/H)8.60, and hence Table 8 only gives its value for such objects.
| Galaxy Name | Lit. | M91 | KD02 | KD02 | PT05 | P01 | PP04a | PP04c | Adopteda | Branch | |||
|---|---|---|---|---|---|---|---|---|---|---|---|---|---|
| knot | , | , | , | , | MKD | PPP | |||||||
| NGC 1140 #1 | 8.380.10 | 8.29 | 8.61 | 8.40 | 8.66 | 8.36 | 8.42 | 8.35 | 8.30 | 8.56 | 8.36 | Upper | |
| IRAS 07164+5301 | … | 8.96c | 8.77 | 8.99 | 8.91 | 8.42 | 8.50 | 8.57 | 8.52 | 8.89 | 8.50 | Upper | |
| NGC 3738 | … | 8.23d | 8.53 | 8.57 | … | 8.18 | 8.26 | 8.44 | 8.35 | 8.55 | 8.31 | Med | |
| UM 311 | … | 8.310.04e | 8.31 | 8.43 | … | 8.12 | 8.15 | 8.33 | 8.28 | 8.37 | 8.22 | Med | |
| NGC 6764 #1 | … | … | 8.97 | 9.12 | 9.07 | 8.53 | 8.68 | 8.65 | 8.72 | 9.05 | 8.65 | Upper | |
| NGC 4861 #1 | 7.950.05 | 8.050.04f | 8.03 | 8.22 | … | 7.77 | 7.83 | 7.99 | 7.97 | 8.13 | 7.89 | Lower | |
| NGC 3003 #13 | … | … | 8.87 | 9.06 | 9.00 | 8.41 | 8.56 | 8.65 | 8.66 | 8.98 | 8.57 | Upper | |
a: Average abundance value using all the empirical methods, the method is not considered here. We provide two results: PPP, which considers the average value obtained with the PT05, P01, PP04a and PP04c calibrations and MKD, which assumes the average value of the M91 and KD02 calibrations. The KD02 method using the parameter is only considered for objects with 12+log(O/H)8.60 dex (NGC 3738, NGC 6764 and NGC 3003). The uncertainty in these values is 0.10 dex.
b: Moll et al. (2007) through the method.
c: Taken from the literature (Huang et al., 1996) through method, although we consider this value is not correct, see Sect. 5.4.2.
d: Martin (1997).
The final adopted value for the oxygen abundance in each galaxy has been computed by averaging all the results provided by these calibrations, and it is compiled in Table 8. As it has been already noticed by several authors (Peimbert et al., 2007; Bresolin et al., 2009; López-Sánchez & Esteban, 2010b; Moustakas et al., 2010; Rosales-Ortega et al., 2011; López-Sánchez et al., 2012), those empirical calibrations which assume strong emission-lines based on photoionization models (McGaugh, 1991; Kewley & Dopita, 2002) tend to overpredict the observed oxygen abundances derived using the method and the empirical calibrations based on it (Pilyugin, 2001a; Pilyugin, 2001b; Pilyugin & Thuan, 2005; Pettini & Pagel, 2004; Pilyugin et al., 2010) by 0.2–0.4 dex. Here we also observe that behavior in the majority of the analyzed regions. Hence, Table 8 compiles two sets of average values: MKD, which is the average value of the oxygen abundance provided by the empirical calibrations based on photoionization models (McGaugh, 1991; Kewley & Dopita, 2002), and PPP, which considers the average value obtained with those calibrations based on the method (Pilyugin, 2001a; Pilyugin, 2001b; Pilyugin & Thuan, 2005; Pettini & Pagel, 2004). The adopted oxygen abundance following the empirical calibrations for the two galaxies for which we have a direct estimation of agrees well within the errors with the adopted PPP value, so we consider that the oxygen abundances derived for the rest of the objects are reliable besides the uncertainties.
Assuming that the solar abundance is 12+log(O/H)⊙=8.66 (Asplund et al., 2005), we finally derived the metallicity, , for each galaxy using the PPP results. These values have been listed in Table 1.
(a) (b)
(b) (c)
(c) (d)
(d)
| Ages estimated from broad-band colors. | Age Adopted | |||||||||
|---|---|---|---|---|---|---|---|---|---|---|
| Galaxy | Knot | Burst | Underlying | |||||||
| [] | [mag] | [Myr] | [Myr] | [Myr] | [Myr] | [Myr] | [Myr] | |||
| NGC 1140 | 0.008 | 1 | 0.1 | 5.2 - 5.4 | 6 - 23 | 1 - 25 | 7 - 20 | 5.0 | 20 | |
| 2 | 0.2 | 5.2 - 6.2 | 5 - 40 | 1 - 45 | 5 - 25 | 5.5 | 25 | |||
| 3 | 0.0d | 3.3 - 3.8 | 2.3 - 4.8 | 20 - 100 | 2 - 5 | 3.5 | 50 | |||
| 4 | 0.0d | 3.2 - 3.3 | 2.3 - 4.8 | 1 - 20 | 1 - 7 | 3.2 | … | |||
| IRAS 07164+5301 | 0.008 | 1 | 0.0 | 5.9 - 6.3 | 34 - 44 | 15 - 25 | 15 - 25 | 6.0 | 25 | |
| NGC 3738 | 0.008 | 1a | 0.00 - 0.25 | 5.0 - 7.0 | 16 - 470 | 10 - 100 | 10 - 800 | 6.0 | 600 | |
| UM 311 | 0.008 | 1b | 0.00 - 0.17 | 3.2 - 3.7 | 2 - 45 | … | 5 - 10 | 3.2 | … | |
| NGC 6764 | 0.02 | 1 | 0.0 | 3.5 - 9.0 | 2.0 - 3.5 | … | 30 - 500 | 6.0 | 400 | |
| 2c | 0.0 | 4.0 - 10 | 2.5 - 3.5 | 2.5 - 6.0 | 6 - 20 | 6.0 | 15 | |||
| 3 | 0.0 | 3.4 - 6.0 | 2.5 - 3.5 | … | 40 - 500 | 5.0 | 400 | |||
| NGC 4861 | 0.004 | 1b | 0.0 - 0.5 | 3.5 - 5.0 | … | … | 2.0 - 7.0 | 4.6 | … | |
| 2b | … | 3.1 - 4.8 | … | … | … | 3.0 | … | |||
| 3b | … | 4.8 - 6.4 | … | 1 - 100 | 7 - 25 | 5.0 | 25 | |||
| 4 | 0.0 | 4.1 - 4.8 | 1.9 - 6.8 | 2.5 - 7.0 | … | 4.5 | .. | |||
| 5 | 0.0 | 4.1 - 5.0 | 1 - 20 | 20 | 1 - 40 | 5.0 | 30 | |||
| 6 | … | 5.2 - 6.8 | … | 20 | 20 - 100 | 5.6 | 50 | |||
| 7 | 0.1 | 2.6 - 4.1 | 1 - 20 | 7 - 25 | … | 4.0 | 15 | |||
| 8 | 0.0 | 3.1 - 4.6 | 1.5 - 6.9 | 30 | 8 - 30 | 4.5 | 30 | |||
| 9 | 0.0 | 7.2 - 10 | 3 - 25 | 2.5 - 7.5 | 5 - 30 | 5.0 | 20 | |||
| 10 | … | 3.1 - 5.4 | … | 30 | … | 4.5 | 30 | |||
| 11 | 0.0 | 4.8 - 6.6 | 1 - 30 | 30 | … | 5.0 | 30 | |||
| 12a | 0.00 - 0.25 | 2.5 - 4.0 | 4 - 88 | 20 - 150 | 10 - 200 | 3.7 | 100 | |||
| NGC 3003 | 0.02 | 1 | … | 2.0 - 3.0 | 200 - 460 | 1000 | … | 3.0 | 1000 | |
| 2 | 0.2 | 3.0 - 5.0 | 2 - 20 | 14 - 400 | 20 - 600 | 5.0 | 500 | |||
| 3 | 0.4 | 4.5 - 10 | 1 - 20 | 7 - 21 | … | 8.0 | 20 | |||
| 4 | 0.0 | 3.4 - 6.1 | 100 | 20 | 500 | 5.5 | 500 | |||
| 5b | … | … | … | … | … | 3.3 | … | |||
| 6 | 0.0 | 5.8 - 6.5 | 2 - 22 | 14 - 60 | 15 - 25 | 5.5 | 20 | |||
| 7 | 0.0 | 60 - 120 | 40 - 600 | 30 | 20 - 900 | 5.6 | 600 | |||
| 8 | 0.0 | 3.2 - 3.4 | 1 - 20 | 10 - 800 | 50 - 200 | 3.4 | 200 | |||
| 9 | 0.5 | 4.5 - 10 | 10 - 400 | 20 - 800 | 20 - 900 | 4.5 | 500 | |||
| 10b | … | 3.2 - 3.4 | … | … | … | 3.1 | … | |||
| 11 | … | 1.9 - 6.1 | … | … | … | 4.7 | … | |||
| 12 | 0.3 | 3.0 - 5.5 | 1 - 30 | 20 - 800 | 30 - 400 | 5.3 | 300 | |||
| 13 | 0.0 - 0.6a | 100 - 175 | 1000 | 1000 | 1000 | 6.7 | 1000 | |||
| 14 | … | 6.3 - 6.6 | … | 1000 | 20 - 600 | 6.2 | 500 | |||
| 15 | 0.4 | 5.5 - 9.5 | 1 - 20 | 20 - 400 | 20 - 800 | 6.0 | 500 | |||
| 16 | 0.3 | 3.4 - 3.5 | 2 - 6 | 15 - 25 | 30 - 200 | 3.5 | 100 | |||
| 17 | 0.0 | 15 - 50 | 23 - 78 | … | 20 - 300 | 4.0 | 200 | |||
| 18 | 0.2 | 5.8 - 9.6 | 6 - 20 | 20 - 470 | 20 - 300 | 6.2 | 200 | |||
| 19 | … | 6.1 - 6.4 | … | 1000 | 400 | 5.8 | 1000 | |||
| 20 | 0.2 | 5.6 - 6.0 | 4 - 20 | 20 - 40 | 15 - 25 | 5.8 | 20 | |||
| 21 | 0.0 | 55 - 150 | 40 - 490 | 100 | 1000 | 6.0 | 1000 | |||
| 22 | 0.4 | 5.5 - 6.2 | 1 - 8 | 10 - 45 | 20 | 5.6 | 40 | |||
| 23b | 0.0 - 0.1 | 2.4 - 3.6 | 3 - 35 | 30 | … | 3.4 | 30 | |||
| 24 | 0.2 | 2.2 - 3.2 | 2 - 20 | 30 - 600 | 30 - 600 | 3.4 | 500 | |||
| 25 | … | 3.3 - 3.4 | 600 - 1000 | 30 | 20 - 900 | 3.4 | 800 | |||
a The derived for this object is very probably overestimated because of the effect of an important old stellar population underlying the burst to the colour. See text for details.
b The broad-band colours of these knots, specially , are probably strongly affected by the emission of the ionized gas. See text for details.
c The center of NGC 6764 (knot #2) is a LINER, and not a star-forming region. Hence, these values are meanless. See text for details.
d As these knots have a relatively large (H), perhaps the contribution of the emission of the gas cannot be neglected. If this is true, the real value of the intrinsic reddening may be up to 0.4 mag. See text for details.
5 Discussion
5.1 Age of the most recent star-forming event
The estimated age of the most-recent star forming event can be derived from the H equivalent width, (H), of the star-forming knots, as it decreases with time (Leitherer & Heckman, 1995; Johnson & Conti, 2000, e.g.,). We used the predictions provided by the Starburst99 code (Leitherer et al., 1999), which are AGB phase corrected. We considered an instantaneous burst with Salpeter initial mass function (IMF) of 2.35. The lower and upper mass range was taken from 1 to 100 . We assumed a total mass of 106 , and a metallicity of = 0.2, 0.4 and 1 which was chosen depending on the oxygen abundance of the galaxy derived from our spectroscopic data. The advantage of using (H) for deriving the age of the most recent starburst event is that they provide a very small error, only between 0.1 and 0.5 Myr. Table 4 compiles our results. Following our (H) data, the majority of the analyzed regions have experienced a strong star-formation event between 3 and 6 Myr ago. In particular, the starbursts observed in regions #1 of NGC 1140 and NGC 4861 have an age of 5.0 and 4.6 Myr, respectively, in agreement with the fact we observe WR stars in them.
5.2 Age of the underlying stellar populations
We used the same Starburst99 models to estimate the age of the stellar populations underlying each H ii region. We compared Starburst99 model tracks for various colours and metallicities with the colors we derived in each star-forming region and determine the age which best fits the observing data with the predictions given by the models. Although the ages derived using this method have larger uncertainties (typically, between 1 and 3 Myr for young stellar populations, and between 100 and 300 for Myr for old stellar populations) than the ages determined from the H equivalent widths, this exercise is useful for discriminating between young (25 Myr), intermediate (100–300 Myr), and old (500 Myr) stellar populations (Johnson et al., 1999; Méndez & Esteban, 2000; Buckalew, Kobulnicky & Dufour, 2005; López-Sánchez, Esteban & García-Rojas, 2006, e.g.). However, the analysis has to be done with care, as the integrated optical colours of a star-forming region also depend on other factors.
- 1.
Older stellar populations. We should expect some disagreement between the models and the observational data, as the star-forming regions would actually host mixed stellar populations, with stars which were created in the last starburst event on top of an older stellar population. In the case of having a bright or very recent star-formation event in a region which already has an old underlying population we will get high (H) values, low colours but higher or colours than those expected using the models. That is because absorptions in the H line are expected not to be important in this case (the H emission line is much stronger than the H absorption line) and the old, reddish stellar population is not affecting much the emission in the filter but it considerably affects , , and data, being specially important in the infrared filters. Indeed, data are usually needed to disentangle the effect of the mixed (young/old) stellar populations in strong star-forming galaxies (Vanzi et al., 2000; Vanzi et al., 2002; Noeske et al., 2003; Noeske et al., 2005; López-Sánchez & Esteban, 2008, e.g.).
- 2.
Emission from the ionized gas. Theoretical models, as those used here, only consider the emission of the stellar continuum to obtain the broad-band colours, but the contribution of the emission lines coming from the ionized gas may be important in some cases. The value of these corrections depend on several factors (position of the emission lines within the broad-band filters, metallicity and ionization of the gas, ratio between the region occupied by the H ii region and the area covered by the slit) and it is not easy to provide an average number. Nevertheless, we used the values for 40 independent regions analyzed by López-Sánchez & Esteban (2008) –see their Appendix A– and tabulated in their Table 6 to get some estimations of the correction of the broad-band colours for the emission of the gas according to the (H) value. For (H) Å we find , and mag and hence for these cases the contribution should be within the errors. For (H) Å, , and mag. For these cases we should take into account the contribution of the emission lines, we do so increasing the uncertainties of the ages derived using the broad-band filters for these knots. Finally, in the case of (H) Å, , and mag. We have some few knots with (H) Å (see Table 4).
- 3.
Extinction, which will move the broad-band colours to redder values. The intrinsic extinction can be determined from the (H) derived from spectroscopy, however here we use a different approach to estimate the internal extinction on each knot using the vs. diagram.
(a) (b)
(b) (c)
(c) (d)
(d)
Figure 12 plots the Starburst99 model tracks for the vs. color-color diagram; the colours derived for our star-forming knots are overlaid onto these model tracks. As we previously specified, we have corrected our broad-band colors by Galactic extinction only using the Schlegel et al. (1998) data. Assuming that the offset between our data point and the models is due to the reddening, we can estimate the intrinsic extinction, , of each knot. For this, we use the reddening vector in the vs. diagram, , , to move our data points to the color-color model track. The amount of the movement provides , which we list in Table 9. Note that this cannot be done for all knots, as sometimes the movement of our data points following the reddening vector put them away from the theoretical track (e.g., knots #5, #10, #11, #14, #19, and #25 in NGC 3003). This is typically the case of faint regions where the uncertainties are large, but it may also be a consequence of the emission of the gas. As we described before, the effect of the emission lines in the color may be important, even +0.6 mag. This is what may be happening in UM 311, knots #1, #2, #3, and #12 in NGC 4861 and knots #5, #10, and #23 in NGC 3003, which show the lowest (H) values of our sample. In particular, it seems the case of knot #1 in NGC 4861, the strongest star-forming region in our sample (see Fig. 8). The value we computed for this knot using our spectrum is 0.03 mag, but we need and offset of 0.5 mag to account its position in Fig. 12c for reddening. On the other hand there are 2 regions with relatively low (H) values –knots #3 and #4 in NGC 1140, which have (H) Å– that show a good agreement with the models besides we do not correct the observed colors for the emission of the gas. Perhaps in these two very young star-forming regions there is a contribution of both internal reddening (which moves the color to redder values) and emission of the gas (which moves the color to bluer values), being null the net contribution of both effects. As the maximum variation of the color because of the emission of the gas is , we should expect that the highest value of the internal reddening in these two regions is 0.4 mag. However, spectroscopic data are needed to confirm this hypothesis.
Furthermore, we consider that the offset between the position of knot #13 of NGC 3003 (the center of the galaxy) and the theoretical model is mainly because of the presence of a very important old stellar population underlying this star-forming region. Indeed, this knot has a high (H) value, -90 Å, hence we expect that the emission of the gas is negligible. On the other hand, the value derived using our spectrum, 0.03 mag, is too low in comparison with the offset of 0.6 mag needed to match with the model following the reddening vector. Finally, the circular aperture used for this knot (see Fig. 7) actually considers not only the starburst but a large non star-forming region probably dominated by older stellar populations.
In the case of NGC 3738 we derive a = 0.25 mag following the vs. color-color diagram. However, for this galaxy we adopted =0 mag using our spectroscopic data. The starburst is located in the center of this galaxy, which hosts an extended disk-like structure (see Fig. 3) composed by older stars. Hence, we suspect there is also an important contribution of this old stellar population to the optical broad-band colours of the star-forming region.
The values for the intrinsic extinction calculated using our photometric data of knot #1 of NGC 1140, IRAS 07164+5301, and knot #1 of NGC 6764 (0.00.3 mag in all cases) match well the values derived from our optical spectroscopy data (adopted 0 mag for the first object, and derived 0.0410.014 mag and 0.0140.007 mag for the second and third knot). This also suggests that the correction for the emission of the gas is not critical in these objects.
Once the intrinsic reddening is determined, we estimate the age of the young stellar population from the reddening-corrected color and compared with that derived from the (H). Second last column in Table 9 compiles the age adopted for each burst, which has a typical uncertainty of 1 Myr.
We further check the agreement between the data and ages derived using the narrow-band H images and the broad-band optical colours. Figure 13 compares the (H) obtained using our H images with the color derived for each knot. We also plot the predictions given by evolutionary synthesis models provided by the Starburst 99 code for several metallicities, as well as the (H) obtained using our spectroscopic data (yellow points). We find a relatively good agreement between all measurements. However in the cases of NGC 4861 (knots #3 and #9) and NGC 3003 (knots #7, #13, #17, and #21) we find regions which are located somewhat far from the models. The reason of this discrepancy is the effect of an important intermediate-old stellar population underlying the bursts.
Finally, we use again the predictions given by the Starburst 99 models and the values obtained for the rest of colors to get an estimation of the age of the dominant stellar population underlying the starburst of each knot. For this we specially consider the results coming from the and the colors. The ages adopted for the underlying stellar populations are compiled in last column of Table 9. As we see, knots in NGC 3738, NGC 6764 and NGC 3003 usually have old underlying stellar populations, with ages even older than 500 Myr in many cases. However, the rest of the galaxies (NGC 1140, IRAS 07164+5301, UM 311 and NGC 4861) host relatively young underlying stellar populations (20 - 50 Myr), which suggests that the strong star-formation activity observed in these galaxies has been ongoing for that period.
(a) (b)
(b) (c)
(c) (d)
(d)
5.3 Analysis of the WR features
A magnified view of the spectrum of NGC 1140 around 4650 Å is presented in the top-left panel of Fig. 14. The blue WR bump at around 4686 Å, which was previously reported by Guseva, Izotov & Thuan (2000), is identified in this spectrum, although with a low SNR. However we clearly identify the red WR bump around C iv 5808 in this object, as it is seen in the top-right panel of Fig. 14. We detect both WR features in the spectrum of the low-metallicity galaxy NGC 4861. In this case, both the broad and the narrow He ii 4686 emission lines are observed (see bottom row in Fig 14).
In order to quantify the fluxes of the WR features detected in these two galaxies, we fitted a broad and a narrow Gaussian for the stellar and nebular WR lines for each WR bump. In the case of the red WR bump we only considered a broad C iv 5808 component as any narrow emission is observed. These fits are included in Fig. 14, which also shows the residual spectrum after subtracting our fit model to the observed spectrum. The derived fluxes for the blue and red WR bumps in each case –which considers only the broad component– have been compiled in Table 5.
We followed the procedure described in Guseva, Izotov & Thuan (2000) to derive the number of WR stars and the WR/(WR+O) and WCE/WNE ratios in NGC 1140. Using the values for the flux of the broad He ii 4686 and C iv 5808 emission lines derived from our fits (see Table 5) and considering the metallicity-dependence of the WR luminosities –Eqs. 7 and 8 in López-Sánchez & Esteban (2010a), which considered both the broad-line WNL and WCE luminosities given by Crowther & Hadfield (2006) for solar and /50 metallicites–, we derive WNL = 9236 and WCE = 5915. From the total luminosity of the H line and considering their Eq. 10, we find that the total number of O stars in the burst is 1553300. For this, the contribution of the WR stars and other O stars subtypes to the ionizing flux must be considered. This is done via the the =O7V/O parameter (Vacca & Conti, 1992; Vacca, 1994; Schaerer & Vacca, 1998), which depends on the age of the burst. Considering the age of the most recent star-formation event (5.0 Myr, see Table 9) and the models provided by Schaerer & Vacca (1998), we assumed for this object. We then derive a WR/(WR+O) ratio of 0.0890.034 and a WCE/WNL ratio of 0.640.30. Both values agree well with the ratios expected for an object with the oxygen abundance of NGC 1140. We note that our estimations of the WR/(WR+O) and WCE/WNL ratios are similar, within the errors, than those derived by Moll et al. (2007) using HST data, WR/(WR+O) = 0.11 and WCE/WNL=0.36. However, their estimations of the total number of O and WR stars are around 4 times the values we derive here. The reason of this discrepancy is that we are probably observing a slightly different area within the galaxy and using a different aperture size.
We repeat this procedure for NGC 4861, a low-metallicity galaxy also showing both the broad He ii 4686 and C iv 5808 emission lines. Note that for this object we subtracted the flux of the nebular, narrow He ii 4686 emission line to get a proper estimation of the flux of the broad He ii 4686 emission line. In this case, we derive WNL = 22535, WCE = 6730 and O = 43361200, assuming the appropriate oxygen abundance for the WR luminosities and considering that the age of the most recent starburst is 4.6 Myr, see Table 9. Hence, we estimate that the WR/(WR+O) and the WCE/WNL ratios for NGC 4861 are 0.0620.021 and 0.300.12, respectively. Both the values are also in agreement with the WR ratios expected for a galaxy with its metallicity.
Although the center of the galaxy NGC 6764 also shows some broad emission lines around the He ii 4686 emission feature which may be attributed to WR stars, the fact that the ionization nature of this object is not photoionization (see Sect. 4.1) preclude us to derive any realistic estimation of the number of WR stars in this region.
5.4 Analysis of individual galaxies
5.4.1 NGC 1140
NGC 1140 is a SbPec galaxy located at a distance of 17.9 Mpc. It is an object showing blue colors, mag, and intermediate metallicity, 12+log(O/H)=8.380.10. Hunter et al. (1994a) used optical broad-band images, H data, optical spectroscopy and neutral hydrogen observations to identify the central giant star forming region and a chain of other star forming regions coinciding with the low light level extension in the south-west tail of the galaxy (see Fig. 1). Later, Hunter et al. (1994b) used HST data to show that the central region consists of a supergiant H ii region and few super-star clusters with sizes of 10 pc. With our ground-based images it is not possible to resolve the individual clusters observed by the HST in the central giant H ii region and hence it has been considered as a single star forming region (knot #1). The other star forming knots numbered #2, #3 and #4, which are in the south-west part of the galaxy, also show very blue colours. In fact knots #3 and #4 are bluer than the central knot. The bluer colour of the outer body of the galaxy indicates that extensive star formation is going on throughout this galaxy. Indeed, using the optical colours we are not able to detect stars older than 25-50 Myr underlying the starburst. The age of the most recent burst decreases from the center (5.0 Myr) to the external regions (3.2 Myr) of NGC 1140, suggesting that the arc-like plume where they are located has been originated very recently.
WR features were previously detected in NGC 1140 by Guseva et al. (2000) and Moll et al. (2007). We certainly detect both the blue and red WR bumps (see Fig. 14), being this last one specially prominent. As it was discussed before, the derived WR properties within NGC 1140 agree well with those expected for a galaxy with its metallicity (Guseva et al., 2000; López-Sánchez & Esteban, 2010a).
The star formation rates calculated using the H flux for the four knots reveal that the central region (knot #1) is undergoing an intense starburst, while the other three star forming knots have a moderate rate of star formation. Our estimation of the SFR within this galaxy, 0.65 /yr, which agrees well with those determined by Hunter et al. (1994b) –/yr– and Moll et al. (2007) –/yr–. FIR and 20-cm radio-continuum data are available for this galaxy. Using the flux densities for 60 m and 100 m provided by IRAS (Moshir et al., 1990, Infrared Astronomical Satellite,) and applying the relations provided by Condon (1992) and Kennicutt (1998), we derive SFR=0.25 yr-1 and SFRFIR=0.30 yr-1, respectively. On the other hand, considering the 1.4 GHz flux for this galaxy provided by Hunter et al. (1994a) and the Condon, Cotton & Broderick (2002) calibration, we derive SFR=0.20 yr-1. Hence, the SFR values derived using the FIR and radio data are 2–3 times lower than our H-based SFR.
Considering the enhancement of SF activity in its center and its peculiar optical and H i morphology. Hunter et al. (1994a); Hunter et al. (1994b) concluded that NGC 1140 is undergoing recent violent disturbances which may be explained assuming a merger of two low surface brightness galaxies. Our new data agrees with this scenario. Hence, NGC 1140 seems to be another example of a WR galaxy in which starburst has been triggered by galaxy interactions, as it was found in the majority of the objects analyzed by López-Sánchez (2010).
5.4.2 IRAS 07164+5301
IRAS 07164+5301 is known as an extreme starburst source (Allen et al., 1991). The optical spectrum of the galaxy was previously studied by Huang et al. (1996) but the broad-band colours of IRAS 07164+5301 are analyzed here for the first time. We report blue colours in this galaxy, , , , and . The comparison of the derived optical colours with the stellar population synthesis models and the analysis of the equivalent width of the H emission line provide an age of 6.5 Myr for the most recent star-formation event. Interestingly, the optical colors do not show the presence of an important old stellar population underlying the starburst. The oldest age we derive for the dominant stellar populations in this galaxy is 25 Myr. The youth of the starburst agrees with the detection of WR features in the optical spectrum of the galaxy analyzed by Huang et al. (1996), who reported the presence of broad lines around 4686 Å, suggesting the presence of N iii 4640, C iii 4650 and He ii 4686. These authors also indicated a tentative detection of O v 5835 and a lack of C iv5808. However, we do not detect any of these features, having our spectrum a similar or even better quality than the spectrum presented by Huang et al. (1996).
We derive an oxygen abundance of 12+log(O/H)=8.50 for IRAS 07164+5301. This value is much lower than the metallicity obtained by Huang et al. (1996), who found 12+log(O/H)=8.96 using the direct method. However, their estimation of the [O iii] 4363 flux is very probably overestimated, and even its detection is not clear because of both the relatively low SNR and spectral resolution (4.7 Å/pix) of their spectrum. Taking into account that we have estimated the oxygen abundance of this object using several parameters (, , , ) and calibrations, all giving similar values (except for the caveat of those methods based on photoionization models, as we discussed before) we consider that our metallicity estimation of IRAS 07164+530 is more appropriate than that obtained by Huang et al. (1996).
Using our data we compute a radial velocity of =12,981 km s-1 (redshift ) for IRAS 07164+5301. Hence this galaxy lies at a distance of 177 Mpc. The high radial velocity this galaxy possesses is the reason we cannot detect its H emission using the rest-frame H filter. However, we used the flux of the H line observed in our optical spectrum to estimate a SFR of 7.6 yr-1. Using the FIR and 20 cm radio-continuum data available for this galaxy, we derive SFR=8.3 yr-1, SFRFIR=8.1 yr-1, and SFR=5.7 yr-1. The 1.4 GHz data were provided by Condon et al. (1998). All these values are in excellent agreement with the SFR we have estimated here using the H emission.
5.4.3 NGC 3738
NGC 3738 is classified as an irregular (de Vaucouleur et al., 1991), low-metallicity galaxy. As it has a very low radial velocity, =229 km s-1, it is not easy to estimate the distance to this galaxy., and hence The best estimations of its distance are ranging from 4.0 to 5.4 Mpc (Hunter, 1982; Hunter, Gallagher & Rautenkranz, 1982; Hunter & Hoffman, 1999). The distance value listed in Table 1 for this galaxy, =5.56 Mpc, comes just from the value of the Hubble constant. However, the most recent distance estimation for this galaxy using the luminosity of the tip of the red giant branch stars is 4.90 Mpc (Karachentsev et al., 2003).
The optical spectrum of NGC 3738 resembles those of H ii regions with emission dominated by massive, hot stars. Martin (1997) points out the presence of a broad He ii 4686 emission line in the integrated spectrum of this galaxy, and hence NGC 3738 was also listed as WR galaxy by Schaerer et al. (1999). However, our optical spectrum does not show any faint WR features.
We used the bright emission lines to estimate the metallicity of the galaxy, 12+log(O/H)=8.31. This value was obtained averaging the results provided by both the high- and low-branch metallicity calibrations and agrees within the uncertainties with the result obtained by Martin (1997), which was 12+log(O/H)=8.23.
NGC 3738 has a bright star forming region in center, for which we derive a SFR of 0.0350.003 yr-1. Our result agrees well with the SFR estimation provided using the H flux provided by Kennicutt et al. (2008) for this galaxy, 0.030 yr-1. Using the FIR fluxes available for this galaxy and the same equations cited in the previous subsection we derive SFR=0.015 yr-1 and SFRFIR=0.018 yr-1.
These values are just slightly lower that the SFR derived using the H images.
The age of the most recent star-formation event we estimate for this galaxy using both the and the color is 6.0 Myr. However, from the and, specially, and colors it is clear that the galaxy possesses a very important old stellar population underlying the starburst, for which we estimate an age of Myr.
5.4.4 UM 311
UM 311 is an intriguing extragalactic H ii region which shows a radial velocity of =1675 km s-1. Therefore the distance to this galaxy is 18.7 Mpc. An essential note in NED defines UM 311 as an “H ii region in the GPair CGCG 0113.0-0107”. Our optical images (see Fig. 4) clearly show two galaxies in apparent interaction, a spiral galaxy (NGC 405) and a dwarf elliptical at its NE (UGC 807), which have radial velocities of 1,761 km s-1 and 11,431 km s-1. Therefore, these two galaxies are not physically associated. Because of the very similar radial velocity, UM 311 may indeed be an H ii region within NGC 405. However, its observed properties (blue colours, compactness and intensity of the star-formation activity) does not discard the possibility that it is an independent Blue Compact Dwarf Galaxy (BCDG) which is interacting with the spiral galaxy NGC 405. A similar example of a BCDG interacting with a spiral galaxy is the stunning NGC 1512 / NGC 1510 system (Koribalski & López-Sánchez, 2009). Interferometric H i data are needed to completely elucidate this issue.
The first study reporting the presence of WR stars in UM 311 was presented by Masegosa, Moles & del Olmo (1991), who detected the broad He ii 4686 emission line. Later many authors have analyzed the WR content on this object. Izotov & Thuan (1998) confirmed the presence of both the blue and red WR bumps. Guseva et al. (2000) noticed that the blue WR bump was particularly strong. Pindao (1999); Buckalew et al. (2005); Zhang et al. (2007) and Brinchmann, Kunth & Durret (2008) also included UM 311 in their studies of WR galaxies. However, the poor quality of our optical spectrum does not allow to detect the faint broad features attributed to WR stars. We find that the age of the most recent starburst is 3.2 Myr, however using the optical colours we are not able to observe the underlying old stellar population. This fact indicates the strength of the starburst in UM 311.
UM 311 has been also used in the analysis of the chemical abundances of low-metallicity extragalactic H ii regions (Izotov & Thuan, 1998; Izotov & Thuan, 1999; Izotov et al., 2004; Izotov et al, 2006; Pilyugin, 2001a, e.g.) and hence its oxygen abundance has been determined with good precision, 12+log(O/H)=8.310.04 (Izotov & Thuan, 1998). Using several empirical calibrations and the data provided by our optical spectrum, we estimate that the oxygen abundance of UM 311 is 12+log(O/H)=8.27, in excellent agreement with the previous estimations.
Using our H images, we derive a SFR of 0.0650.005 yr-1. This value is very low when it is compared with the SFR derived by Hopkins, Schulte-Ladbeck & Drozdovsky (2002) using FIR and radio-continuum data, SFR=1.5 yr-1 and SFR=1.1 yr-1. However, we consider that our SFR estimation is more appropriate, as both FIR and radio-continuum images do not enough spatial resolution to resolve UM 311 within the spiral galaxy NGC 405.
5.4.5 NGC 6764
NGC 6764 is barred spiral (SBb type) galaxy (see Fig 5) which is also classified as a classical LINER galaxy (Alonso-Herrero et al., 2000). Indeed, using optical emission line ratios we confirm that the nucleus of this galaxy lies in the LINER region of the BPT diagram (Fig. 11). Osterbrock & Cohen (1982) point out the presence of broad N iii 4640 and He ii 4686 emission lines in the spectrum of the nucleus of NGC 6764. These features were later reported by Eckart et al. (1996); Guseva et al. (2000) and Fernandes et al. (2004). Osterbrock & Cohen (1982) also reported a signal excessive widths of He i 5876 and H which they attributed to emission from WR stars. Indeed, broad C iii 5696 and C iv 5808 lines from WC stars were discovered by Fernandes et al. (2004). Our optical spectrum confirms the broad features in the blue WR bump, although the existence of the red WR bump is not clear (see Fig 10). However, as the photoionization is not coming from massive stars, we cannot compute the WR content in this object.
From our H images of NGC 6764 we identify 3 regions showing ionized gas emission: the center of the galaxy (knot #2) and the regions located at the end of the bar (knot #3 at the east; knot #1 at the west). The starburst activity is NGC 6764 was first observed by Eckart et al. (1991); Eckart et al. (1996), who revealed a dense concentration of molecular gas and very recent (few tens of Myr) starburst at the nucleus of NGC 6764. Indeed, we estimate an age of 15 Myr for the dominant stellar population in the center of the galaxy, although the color and the (H) suggest that the age of the most recent starburst is 6 Myr. This value agrees with the result obtained by Leon et al. (2007), who concluded that the nuclear starburst is 3-7 Myr old using their analysis of the interplay between the central activity and the molecular gas. However, knots #1 and 3 show an important stellar population underlying the bursts, with has an age of 400 Myr.
We cannot compute the oxygen abundance of the nucleus of the galaxy because its LINER nature. However, we derive a metallicity of 12+log(O/H)=8.65 for knot #3 using several independent empirical calibrations. So far, this is the first gas-phase metallicity estimation reported in this galaxy.
5.4.6 NGC 4861
NGC 4861 is classified as a Magellanic irregular galaxy (Sandage & Tammann, 1981) and a BCDG because of its blue colours and high UV continuum (French, 1980; Thuan & Martin, 1981). This object is located at a distance of 12.9 Mpc. NGC 4861 has a comet-like morphology (see Fig 6) with many star-forming regions located along its major axis. The morphology of the galaxy was discussed by Dottori et al. (1994) who concluded that NGC 4861 might have undergone a merger process. From H i maps, this galaxy is an edge-on and rotating disk system (Conselice et al., 2000). Some authors have distinguished the bright star-forming region at its south (our knot #1) as NGC 4861 and the dwarf irregular galaxy IC 3961 (the rest of the galaxy) and recommended the definition of Mkn 59 to describe the full system. In any case, NGC 4861 has been amply studied as an example of a compact blue galaxy (Kobulnicky & Skillman, 1998; Izotov et al., 1997; Izotov & Thuan, 1999; Lee, Salzer & Melbourne, 2004; Esteban et al., 2009, e.g.).
Since the discovery of the broad He ii 4686 emission line in the spectrum of this galaxy (Dinerstein & Shields, 1986), many studies have confirmed the presence of WR stars in NGC 4861 (Schaerer et al., 1999).The broad C iv 5808 emission has been also detected in NGC 4861 (Izotov et al., 1997; Guseva et al., 2000). Our optical spectrum confirms the presence of these broad WR features. We derive WR/(WR+O)=0.062 and WCE/WNL=0.30, in agreement with previous estimations.
The most recent analysis of the ionized gas within this object was presented by Esteban et al. (2009), who derived an oxygen abundance of 12+log(O/H)=8.050.04 using many nebular and auroral emission lines from optical spectra obtained with the 10m Keck I telescope. Although slightly higher than the value we derive here using the emission lines observed in our optical spectrum (including the auroral [O iii] 4363 line), 12+log(O/H)=7.950.05, both measurements agree well within the errors.
The analysis of our H images allows us to quantify the star-formation activity throughout NGC 4861. The net-H image (Fig 6) reveals 12 well-defined star-forming regions. Bright knot #1 hosts the majority of the starburst activity and, indeed, has the highest SFR per area. For this region we derive a SFR of 0.470.03 yr-1 using the H luminosity. The SFR derived for all the galaxy is 0.480.04 yr-1. The SFR obtained from the available FIR and 1.4 GHz data are quite low (10 – 18 times lower) when compared with the H-based value, SFR=0.086 yr-1 and SFR=0.049 yr-1. As both FIR and radio-continuum are tracing the star-formation activity in the last 100 Myr but the timescale of the H emission is around 10 Myr, this may suggest that there has been an enhancement of the star-formation activity within this object in the last few million years.
The age of the most recent star-formation even in bright knot #1 is 4.6 Myr. Some knots seem to have even younger ages. The analysis of the broad-band optical colors suggests that the majority of the star-forming regions host an important underlying stellar population, with ages ranging from 30 to 100 Myr. This fact together with the presence of strong absorption features in the optical spectrum of the galaxy indicate the presence of an intermediate-age stellar population in this BCDG.
5.4.7 NGC 3003
NGC 3003 is a SBbc type galaxy located at 24 Mpc which appears to be almost edge-on (see Fig 7). Its morphology shows two asymmetric spiral arms, suggesting that it may be a disturbed galaxy. Its SW areas show a bright and compact region which may be the remnant of a dwarf galaxy, also it may also be just an intense H ii region within the spiral arms of NGC 3003.
Ho, Filippenko & Sargent (1995) reported the presence of the broad blue WR bump in NGC 3003, and therefore the galaxy was included in the WR galaxy catalogue created by Schaerer et al. (1999). This feature has not been observed again in this galaxy. Indeed it is not seen in our optical spectrum, however it has a low SNR. Using the brightest emission lines and the typical empirical calibrations we derive an oxygen abundance of 12+log(O/H)=8.57 for this galaxy. Besides NGC 3003 has been amply studied in the past we have not found any previous estimation of its gas-phase metallicity in the literature.
Our net-H image allows us to identify 25 independent star-forming regions, including the bright nucleus (knot #13) and the intriguing bright object at the SW (knot #3). These two knots actually host the highest H emission of the galaxy. The total H luminosity of NGC 3003 adding up the flux of all star-forming region is 2.97 erg s-1, which can be translated in a total SFR of 0.24 yr-1. Our derived H luminosity is 4 times lower than that derived by Hoopes, Walterbos & Rand (1999) who reported = 1.18 erg s-1. Some part of the missing H flux may be consequence of not considering an adequate value for the correction for extinction, which may be important in edge-on galaxies. However, we should also expect that there is some diffuse H gas in the galaxy which does not belong to the analyzed regions and hence it was not considered in our total flux. The SFR derived from the FIR and radio-continuum data available for this galaxy are SFR=0.39 yr-1, SFRFIR=0.15 yr-1, and SFR=0.58 yr-1. All these values suggest that the total H luminosity computed by Hoopes et al. (1999), who translates in a SFR of 0.94 yr-1, is probably slightly overestimated.
We estimated the age of the most recent star-formation event via the H equivalent width and the colors, finding typical values between 3 and 6 Myr. The optical colours obtained for the star-forming regions, in particular the and the colors, clearly indicate the presence of an important old stellar population underlying the bursts, with ages in many cases older than 500 Myr. Indeed, this is the only galaxy for which we find ages higher than 1 Gyr in some knots.
6 Summary and conclusions
We presented a detailed photometric and spectroscopic study of sample of 7 Wolf-Rayet galaxies. The observed galaxies are NGC 1140, IRAS 07164+5301, NGC 3738, UM 311, NGC 6764, NGC 4861 and NGC 3003. Star-forming regions within these galaxies have been identified using narrow-band H images. Combining with the data obtained using our optical broad-band images, we analyze the morphologies, colours, star-formation rates and stellar populations of these star-forming regions.
We discussed the morphology of the galaxies using our broad-band images. In some cases (NGC 1140, UM 311, NGC 481 and NGC 3003) we find features which may indicate that the galaxy has experienced a recent interaction.
We used the H images and optical broad-band colours in combination with Starburst99 models to derived the age of the most recent star-formation event. We confirmed that almost all the analyzed regions show a very young (3 – 6 Myr old) starburst. We also used the optical colours to estimate the internal reddening and to study the age of the dominant underlying stellar populations within all these regions. Knots in NGC 3738, NGC 6764 and NGC 3003 generally show the presence of an important old (400 – 1000 Myr) stellar population. However, the optical colours are not able to detect stars older than 20 – 50 Myr in the knots of the other four galaxies. This fact suggests both the intensity of the starbursts and that the star-formation activity has been ongoing for at least some few tens of million years in these objects. Deep NIR data should be needed to detect the old stellar populations in these galaxies.
We derived the SFR of each knot using the H luminosity. The H-based SFR derived for each galaxy usually agrees well with the SFR derived using FIR and radio-continuum data.
The optical spectra were used to search for the faint WR features, to confirm that the ionization of the gas is consequence of the massive stars, and to quantify the chemical properties of each object. The high S/N optical spectrum of NGC 1140 and NGC 4861 allowed us to precise the oxygen abundance of the ionized gas using the direct method (i.e., via the detection of the faint [O iii] 4363 emission line). We also derive the chemical abundances of N, S, Ne and Ar in these two galaxies. In NGC 4861, the N/O ratio is 0.25-0.35 dex higher than that expected from its oxygen abundance. This fact may be related to the presence of WR stars within this galaxy. Indeed, we clearly detected the features originated by WR stars in NGC 1140 and NGC 4861 and used them to derive the population of O, WNL and WCE stars. In both cases, the derived WR/(WR+O) and WCE/WNL ratios agree well with those expected for galaxies with similar oxygen abundances.
For the rest of the galaxies we provided an estimation of the oxygen abundance of the ionized gas using several and independent empirical calibrations. Here we presented the first oxygen abundances computed for NGC 6764 and NGC 3003, which are 12+log(O/H)=8.65 and 8.57, respectively. We also derived the oxygen abundance of IRAS 07164+5301, 12+log(O/H)=8.50, which is 34% of the only available determination of the metallicity of this galaxy.
7 Acknowledgments
We would like to thank the anonymous referee, whose comments helped to improve the paper considerably. Authors thanks S.Ramya(IIA), Ian Stevans (University of Brimingham) and Claus Leitherer (STSci) for their comments on the initial draft of the paper. Author also thanks C. Eswaraiah (ARIES) for his support and encouragement. CK acknowledges the financial assistance through a sponsored project Grant No: SR/S2/HEP-10/2002 of Department of Science and Technology (DST), Government of India, New Delhi. He also acknowledges Prof. T. P. Prabhu, IIA for his constant encouragement throughout this work and support during his stay at CREST campus, IIA. This research has made use of the NASA/IPAC Extragalactic Database (NED) which is operated by the Jet Propulsion Laboratory, California Institute of Technology, under contract with the National Aeronautics and Space Administration. This research has made extensive use of the SAO/NASA Astrophysics Data System Bibliographic Services (ADS).
References
- Allen et al. (1991) Allen, David A.; Norris, R. P.; Meadows, V. S. & Roche, P. F. 1991, MNRAS, 248, 528
- Alonso-Herrero et al. (2000) Alonso-Herrero, A., Rieke, M. J., Rieke, G. H. & Shields, J. C. 2000, ApJ, 530, 688
- Amorín et al. (2012) Amorín, R., Pérez-Montero, E., Vílchez, J.M. & Papaderos, P. 2012, ApJ, in press (arXiv:1202.3419)
- Asplund et al. (2005) Asplund, M., Grevesse, N. & Sauval, A. J. 2005, in ASP Conf. Ser. 335, Cosmic Abundances as Records of Stellar Evolution and Nucleosynthesis, ed. F.N. Bash & T.G. Barnes (San Francisco: ASP), 25
- Baldwin, Phillips & Terlevich (1981) Baldwin J., Phillips M., & Terlevich R., 1981, PASP, 93, 5
- Bresolin et al. (2009) Bresolin, F., Gieren, W., Kudritzki, R-P., Pietrzyński, G., Urbaneja, M.A. & Carraro, G. 2009, ApJ, 700, 309
- Brinchmann, Kunth & Durret (2008) Brinchmann, J., Kunth, D., & Durret, F. 2008, A&A, 485, 657
- Buckalew, Kobulnicky & Dufour (2005) Buckalew, B.A., Kobulnicky, H.A. & Dufour, R.J. 2005, ApJS, 157, 30
- Calzetti et al. (2007) Calzetti, D. et al. 2007, ApJ, 666, 870
- Cardelli, Clayton & Mathis (1989) Cardelli, J. A., Clayton, G. C. & Mathis J. S. 1989, ApJ, 345, 245
- Condon (1992) Condon, J.J. 1992, ARA&A 30, 575
- Condon et al. (1998) Condon, J. J., Cotton, W. D., Greisen, E. W., Yin, Q. F., Perley, R. A., Taylor, G. B. & Broderick, J. J. 1998, AJ, 115, 1693
- Condon, Cotton & Broderick (2002) Condon, J.J., Cotton, W.D. & Broderick, J.J. 2002, AJ, 124, 675
- Conti (1976) Conti, P.S., 1976, MSRSL, 9, 193
- Conti (1991) Conti, P.S., 1991, ApJ, 377, 115
- Conselice et al. (2000) Conselice, C.J., Gallagher, J.S., Calzetti, D., Homeier, N. & Kinney, A. 2000, AJ, 119, 79
- Crowther & Hadfield (2006) Crowther, P.A. & Hadfield, L.J., 2006, A&A, 449, 711
- Dinerstein & Shields (1986) Dinerstein, H.L. & Shield, G.A. 1986, ApJ, 311, 45
- Dopita et al. (2000) Dopita, M.A., Kewley, L. J., Heisler, C.A. & Sutherland, R.S. 2000, ApJ, 542, 224
- Dottori et al. (1994) H. Dottori, J. Cepa, J. Vílchez & C.S. Barth, 1994, A&A, 283, 753
- Eckart et al. (1991) Eckart, A., Cameron, M., Jackson, J. M., Genzel, R., Harris, A. I., Wild, W. & Zinnecker, H. 1991, ApJ, 372, 67
- Eckart et al. (1996) Eckart, A., Cameron, M., Boller, Th., Krabbe, A., Blietz, M., Nakai, N., Wagner, S. J. & Sternberg, A. 1996, AJ, 472, 58
- Esteban et al. (2004) Esteban, C., Peimbert, M., García-Rojas, J., Ruiz, M. T., Peimbert, A. & Rodríguez, M., 2004, MNRAS, 355, 229
- Esteban et al. (2009) Esteban, C., Bresolin, F., Peimbert, M., García-Rojas, J., Peimbert, A. & Mesa-Delgado, A. 2009, ApJ, 700, 654
- Fernandes et al. (2004) Fernandes, I.F., de Carvalho, R., Contini, T. & Gal, R.R. 2004, MNRAS 355, 728
- French (1980) French, H. B. 1980, ApJ, 240, 41
- García-Rojas et al. (2005) García-Rojas, J., Esteban, C., Peimbert, A., Peimbert, M., Rodríguez, & M., Ruiz, 2005, MNRAS, 362, 301
- Garnett (1992) Garnett, D.R. 1992, AJ, 103, 1330
- Garnett (2004) Garnett, D.R. 2003, lectures on Cosmochemistry: The melting pot of the elements. XIII Canary Islands Winter School of Astrophysics, Puerto de la Cruz, Tenerife, Spain, November 19-30, 2001, edited by C. Esteban, R. J. García López, A. Herrero, F. Sánchez. Cambridge contemporary astrophysics. Cambridge, UK: Cambridge University Press, ISBN 0-521-82768-X, 2004, p. 171
- Garnett et al. (1991) Garnett, D.R., Kennicutt, R. C.Jr., Chu, Y.-H. & Skillman E. D. 1991, ApJ, 373, 458
- Guseva, Izotov & Thuan (2000) Guseva, N., Izotov, Y. I. & Thuan, T.X. 2000, ApJ, 531, 776
- Ho, Filippenko & Sargent (1995) Ho, L. C., Filippenko, A. V. & Sargent, W. L. 1995, ApJS, 98, 477
- Hoopes, Walterbos & Rand (1999) Hoopes, C.G., Walterbos, R. A. M. & Rand, R.J. 1999, ApJ, 522, 669
- Hopkins, Schulte-Ladbeck & Drozdovsky (2002) Hopkins, A. M., Schulte-Ladbeck, R. E. & Drozdovsky, I. O. 2002, AJ, 124, 862
- Huang et al. (1996) Huang, Jiehao; Gu, Qiusheng; Su, Hongjun; Shang, Zhaohui, 1996, Ap&SS, 235, 109
- Huang et al. (1999) Huang, J.H., Gu, Q.S., Ji,L., Li, W.D., Wei, J.Y. & Zheng, W. 1999, ApJ, 513, 215
- Hunter (1982) Hunter D. A., 1982, ApJ, 260, 81
- Hunter, Gallagher & Rautenkranz (1982) Hunter D. A., Gallagher, J. & Rautenkranz, D. 1982, ApJS, 49, 53
- Hunter et al. (1994a) Hunter D. A., O Connell R. W., Gallagher III J. S., 1994a, AJ, 108, 84
- Hunter et al. (1994b) Hunter D. A., van Woerden H., Gallagher III J. S., 1994b, ApJS, 91, 79
- Hunter & Hoffman (1999) Hunter D. A., & Hoffman, L. 1999, AJ, 117, 2789
- Izotov, Thuan, & Lipovetski (1994) Izotov, Y.I., Thuan, T.X., & Lipovetski, 1994, ApJ, 435, 647
- Izotov et al. (1997) Izotov, Y. I., Foltz, C. B., Green, R. F., Guseva, N. G. & Thuan T. X., 1997, ApJ, 487, L37
- Izotov & Thuan (1998) Izotov, Y.I. & Thuan, T.X. 1998, ApJ, 500, 188
- Izotov & Thuan (1999) Izotov, Y.I. & Thuan, T.X. 1999, ApJ, 511, 639
- Izotov et al. (2004) Izotov, Y.I., Papaderos, P., Guseva, N.G., Fricke, K.J. & Thuan, T.X. 2004, A&A 421, 539
- Izotov et al (2006) Izotov, Y.I., Stasińska, G., Meynet, G., Guseva, N.G. & Thuan, T.X. 2006, A&A, 448, 955
- James et al. (2009) James, B.L., Tsamis, Y.G., Barlow, M.J., Westmoquette, M.S., Walsh, J.R., Cuisinier, F. & Exter, K.M. 2009, MNRAS, 398, 2
- Johnson et al. (1999) Johnson, K. E., Vacca, W.D., Leitherer, C., Conti, P. S. & Lipscy, S. J., 1999, AJ, 117, 1708
- Johnson & Conti (2000) Johnson, K. E. & Conti, P.S. 2000, ApJ, 119, 2146
- Karachentsev et al. (2003) Karachentsev, I.D., Sharina, M. E., Dolphin, A. E., Grebel, E. K., Geisler, D., Guhathakurta, P., Hodge, P. W., Karachentseva, V. E., Sarajedini, A. & Seitzer, P. 2003, A&A, 398, 467
- Kauffmann et al. (2003) Kauffmann, G. et al. 2003, MNRAS, 346, 1055
- Kennicutt (1998) Kennicutt, R.C. Jr. 1998,ARAA, 36, 189
- Kennicutt et al. (2003) Kennicutt, R.C. Jr., Bresolin, F. & Garnett, D.R. 2003, ApJ, 591, 801
- Kennicutt et al. (2008) Kennicutt, R. C., Jr., Lee, J.C., Funes, S.J., José G., Sakai, S., & Akiyama, S. 2008, ApJS, 178, 247
- Kewley et al. (2001) Kewley, L.J., Dopita, M.A., Sutherland, R.S., Heisler, C.A. & Trevena, J. 2001, ApJS, 556, 121
- Kewley & Dopita (2002) Kewley, L.J. & Dopita, M.A. 2002, ApJS, 142, 35
- Kobulnicky et al. (1997) Kobulnicky, H.A., Skillman, E.D., Roy, J.-R., Walsh, J.R. & Rosa, M.R., 1997, ApJ, 277, 679
- Kobulnicky & Skillman (1998) Kobulnicky, H.A, & Skillman, E.D. 1998, ApJ, 497, 601
- Kobulnicky & Kewley (2004) Kobulnicky H. A. & Kewley L. J. 2004, ApJ, 617, 240
- Koribalski & López-Sánchez (2009) Koribalski, B.S. & López-Sánchez, Á.R. 2009, MNRAS, 400, 1749
- Landolt (1992) Landolt A.U. 1992, AJ, 104, 340
- Lee, Salzer & Melbourne (2004) Lee, J.C., Salzer J.J. & Melbourne, J. 2004, ApJ, 616, 752L
- Leitherer & Heckman (1995) Leitherer, C. & Heckman, T.M. 1995, ApJS, 96, 9
- Leitherer et al. (1999) Leitherer, C., Schaerer, D., Goldader, J.D., González-Delgado, R.M., Robert, C., Kune, D.F., de Mello, D.F., Devost, D. & Heckman, T.M. 1999, ApJS, 123, 3
- Leon et al. (2007) Leon, S.; Eckart, A.; Laine, S.; Kotilainen, J. K.; Schinnerer, E.; Lee, S.-W.; Krips, M.; Reunanen, J. & Scharwachter, J. 2007, A&A, 473, 747
- López-Sánchez (2010) López-Sánchez, Á.R. 2010, A&A, 521, 63
- López-Sánchez et al. (2004a) López-Sánchez, Á.R., Esteban, C. & Rodríguez, M. 2004a, ApJS, 153, 243
- López-Sánchez et al. (2004b) López-Sánchez, Á.R., Esteban, C. & Rodríguez, M. 2004b, A&A 428,445
- López-Sánchez, Esteban & García-Rojas (2006) López-Sánchez, Á.R., Esteban, C. & García-Rojas, J. 2006, A&A, 449, 997
- López-Sánchez et al. (2007) López-Sánchez, Á.R., Esteban, C., García-Rojas, J., Peimbert, M. & Rodríguez, M. 2007, ApJ, 656, 168
- López-Sánchez & Esteban (2008) López-Sánchez, Á.R. & Esteban, C. 2008, A&A, 491, 131
- López-Sánchez & Esteban (2009) López-Sánchez, Á.R. & Esteban, C. 2009, A&A, 508, 615
- López-Sánchez & Esteban (2010a) López-Sánchez, Á.R. & Esteban, C. 2010a, A&A, 516, 104
- López-Sánchez & Esteban (2010b) López-Sánchez, Á.R. & Esteban, C. 2010b, A&A, 517, 85
- López-Sánchez et al. (2011) López-Sánchez, Á.R., Mesa-Delgado, A., López-Martìn, L & Esteban, C. 2011, MNRAS, 411, 2076
- López-Sánchez et al. (2012) López-Sánchez, Á.R., Dopita, M.A., Kewley, L.J., Zahid, H.J., Nicholls, D.C. & Scharwächter, J. 2012, MNRAS, 426, 2630
- Martin (1997) Martin, C. L. 1997, ApJ, 491, 561
- Masegosa, Moles & del Olmo (1991) Masegosa, M., Moles, M. & del Olmo, A. 1991, A&A, 244, 273
- Mazzarrella & Boronson (1993) Mazzarrella, J.M. & Boronson, T.A. 1993, ApJS, 85, 27
- McGaugh (1991) McGaugh, S.S. 1991, ApJ, 380, 140
- Méndez & Esteban (2000) Méndez, D.I. & Esteban, C., 2000, A&A, 359, 493
- Meynet & Maeder (2005) Meynet G. & Maeder A. 2005. A&A, 429, 581
- Moll et al. (2007) Moll, S.L., Mengel, S., de Grijs, R., Smith, L. J. % Crowther, P.A. 2007, MNRAS, 382, 1877
- Monreal-Ibero et al. (2010) Monreal-Ibero, A., Vílchez, J.M.; Walsh, J.R. & Muñoz-Tuñón, C. 2010, A&A, 517, 27
- Moshir et al. (1990) Moshir M. et al. 1990, Infrared Astronomical Satellite Catalogs, The Faint Source Catalog, Version 2.0
- Moustakas et al. (2010) Moustakas, J., Kennicutt, R.C., Jr., Tremonti, C. A., Dale, D. A., Smith, J.-D. T. & Calzetti, D. 2010, ApJS, 190, 233
- Noeske et al. (2003) Noeske, K.G., Papaderos, P., Cairós, L.M. & Fricke, K.J. 2003, A&A, 410, 481
- Noeske et al. (2005) Noeske, K.G., Papaderos, P., Cairós, L.M & Fricke, K.J. 2005, A&A, 429, 115
- Oke (1990) Oke, J. B. 1990, ApJ, 99, 1621
- Osterbrock & Cohen (1982) Osterbrock, D.E. & Cohen, R.D. 1982, ApJ, 261, 64
- Peimbert & Costero (1969) Peimbert, M. & Costero, R. 1969, Bol. Obs. Ton. y Tac., 5, 3
- Peimbert et al. (2007) Peimbert, M., Peimbert, A.. Esteban, C.; García-Rojas, J., Bresolin, F., Carigi, L., Ruiz, M.T. & López-Sánchez, Á.R. 2007, RMxAC, 29, 72
- Pérez-Montero et al. (2011) Pérez-Montero, E., Vílchez, J. M., Cedrés, B., Hägele, G. F.; Mollá, M. Kehrig, C., Díaz, A. I., García-Benito, R. & Martín-Gordón, D. 2011, A&A, 532, 141
- Pettini & Pagel (2004) Pettini, M. & Pagel, B.E.J. 2004, MNRAS, 348, 59
- Pindao (1999) Pindao, M. 1999, in IAU Symp. 193: Wolf-Rayet Phenomena in Massive Stars and Starburst Galaxies, 193, 614
- Pindao et al. (2002) Pindao, M., Schaerer, D., González-Delgado, R.M. & Stasińska, G. 2002, A&A 394, 443
- Pilyugin (2001a) Pilyugin, L.S. 2001a, A&A, 369, 594
- Pilyugin (2001b) Pilyugin, L.S. 2001b, A&A, 374, 412
- Pilyugin & Thuan (2005) Pilyugin, L.S. & Thuan, T.X. 2005, ApJ, 631, 231
- Pilyugin et al. (2010) Pilyugin, L.S., Víchez, J.M. & Thuan, T.X. 2010, ApJ, 720, 1738
- Pustilnik et al. (2004) Pustilnik, S., Kniazev, A., Pramskij, A., Izotov, Y., Foltz, C., Brosch, N., Martin, J.-M. & Ugryumov, A. 2004, A&A 419, 469
- Reines et al. (2010) Reines, Amy E.; Nidever, David L.; Whelan, David G. & Johnson, Kelsey E. 2010, ApJ, 708, 26
- Rosales-Ortega et al. (2011) Rosales-Ortega, F.F., Díaz, A.I., Kennicutt, R.C. & Sánchez, S.F. 2011, MNRAS, 415, 2439
- Salzer, MacAlpine & Boroson (1989) Salzer, J. J., MacAlpine, G. M. & Boroson, T. A. 1989, ApJS, 70, 447
- Sandage & Tammann (1981) Sandage, A. & Tammann, G. A.1981, A Revised Shapley-Ames Catalog of Bright Galaxies , Washington, DC; Carnegie Inst. Washington
- Schaerer & Vacca (1998) Schaerer, D. & Vacca, W.D. 1998, ApJ, 497, 618
- Schaerer, Contini & Pindao (1999) Schaerer, D., Contini, T. & Pindao, M. 1999, A&AS 136, 35
- Schlegel, Finkbeiner & Davis (1998) Schlegel, D.J., Finkbeiner, D.P. & Davis, M. 1998, ApJ, 500, 525
- Shaw & Dufour (1995) Shaw, R.A. & Dufour, R.J. 1995, PASP, 107, 896
- Stasińska (1978) Stasińska, G. 1978, A&A, 66, 257
- Storey & Hummer (1995) Storey, P.J. & Hummer, D.G. 1995, MNRAS 272, 41
- Thuan & Martin (1981) Thuan, T.X. & Martin, G.E. 1981, ApJ, 247, 823
- Vacca & Conti (1992) Vacca, W.D. & Conti, P.S., 1992, ApJ, 401, 543
- Vacca (1994) Vacca, W.D. 1994, ApJ, 421, 140
- Vanzi et al. (2000) Vanzi, L., Hunt, L.K., Thuan, T.X. & Izotov, Y.I. 2000, A&A, 363, 493
- Vanzi et al. (2002) Vanzi, L., Hunt, L.K. & Thuan, T.X. 2002, A&A, 390, 481
- Veilleux & Osterbrock (1987) Veilleux, S. & Osterbrock, D.E. 1987, ApJS, 63 295
- de Vaucouleur et al. (1991) de Vaucouleurs G., de Vaucouleurs A., Corwin Jr. H.G., Buta R.J., Paturel G., Fouqué P. 1991, ÒThird Reference Catalogue of Bright GalaxiesÓ (New York: Springer Verlag),
- Waller (1990) Waller, W.H. 1990, PASP, 102, 1217
- York et al. (2000) York, D.G. et al. 2000, AJ, 120, 1579
- Zhang et al. (2007) Zhang, W., Kong, X., Li, C., Zhou, H.-Y., Cheng, F.-Z. 2007, ApJ, 655, 851