Running title : Toward a new paradigm for protein sliding
Protein-DNA electrostatics: toward a new paradigm for protein sliding
Abstract
Gene expression and regulation rely on an apparently finely tuned set of reactions between some proteins and DNA. Such DNA-binding proteins have to find specific sequences on very long DNA molecules and they mostly do so in absence of any active process. It has been rapidly recognized that to achieve this task these proteins should be efficient at both searching (i.e. sampling fast relevant parts of DNA) and finding (i.e. recognizing the specific site). A two-mode search and variants of it have been suggested since the 70s to explain either a fast search or an efficient recognition. Combining these two properties at a phenomenological level is however more difficult as they appear to have antagonist roles. To overcome this difficulty, one may simply need to drop the dichotomic view inherent to the two-mode search and look more thoroughly at the set of interactions between DNA-binding proteins and a given DNA segment either specific or non-specific. This chapter demonstrates that, in doing so in a very generic way, one may indeed find a potential reconciliation between a fast search and an efficient recognition. Although a lot remains to be done, this could be the time for a change of paradigm.
Keywords: Protein-DNA interaction, Target sequence search, Electrostatic in solution, Protein sliding, Mobility-specificity paradox
1 Introduction: the search of target sequences
The observation of gene regulatory networks made possible by proteomics (the study of the ensemble of proteins in a cell or tissue in given conditions) and transcriptome analysis (the set of messenger RNA resulting from the expression of a portion of the genome of a cell tissue or cell type) reveals the set of interactions between different cellular components. It is then necessary to specify the nature of these interactions, from the structural, energetic, spatial and temporal point of view, in order to reveal the mechanisms underlying the ”cellular timing”: how appropriate macromolecules are recruited at the right time and at the right place?
Many proteins indeed have to search and bind specific, relatively short DNA sequences in order to perform their biological task. These specific-proteins include polymerases and a number of transcription factors involved in the regulation of gene expression, but also proteins with different functions as e.g. nucleases. Knowing that the total length of DNA may reach millions or billions of base pairs (bps), one understands that finding the target sequence is a formidable challenge. The problem of this search kinetics have been debated since, in the 70s, researchers realized that the relatively short time needed for a protein to find its target sequence on DNA cannot be explained by a simple search by 3D diffusion in the cell (according to the Smolukowski theory) followed by random collisions with the DNA: the actual association constant is approximately 2 orders of magnitude larger [1, 2]. Since then, many people have been interested in the search process, and a large amount of theoretical work has been done [3, 4]. Interestingly, despite the fact that the role of electrostatics had been explicitly invoked in the original works [1, 3, 5], most of the work has been based on a purely kinetic approach. The main results can be summarized by the finding that 3D excursions should be alternated by phases of 1D diffusion, named sliding, during which the protein binds DNA and slides along the double helix by thermal 1D diffusion sliding, during which the protein binds DNA and slides along the double helix by thermal 1D diffusion [6]. This intermittent process has been called “facilitated diffusion”.
The existence of 1D diffusion or sliding has then been proved by several experiments [7, 8, 9] and in particular by fluorescence microscopy [10, 11, 12, 13]. In this kind of experiments the two extremities of a DNA molecule are bound on a surface, in such a manner that the DNA is softly stretched. The movement of a fluorescent protein moving along the DNA direction can then be recorded and analyzed. These experiments confirm that proteins may slide along DNA and generally display a standard diffusion dynamics. Experiments also show that the sliding lifetime is sensitive to the salt concentration [1, 11, 13]. This supports the idea that electrostatics is involved to some extent in the intermittent behavior, with a probable role for the dissolved salt ions. Electrostatics plays indeed a major role in the protein-DNA interaction [14, 15, 16, 17, 18, 19, 20]. The reason is that DNA is very strongly negatively charged (-2 charges per base pair). On the other hand, DNA-binding proteins are most often positively charged on the surface that faces DNA, so to be attracted onto it [14, 15].
Together with its role in the search kinetics, the protein sliding is also supposed to have another crucial role: it allows the protein to read the DNA sequence and therefore to distinguish the target site among all other sequences. This reading can be performed, besides other interactions, by the formation of hydrogen bonds between the protein and the side of the base pairs exposed toward the major groove, without opening the double helix [14, 15]. Since the patterns of hydrogen bonds that may be formed on each base pair is different, a protein can discriminate precisely a target site by looking for the formation of the good hydrogen bond pattern along the entire sequence visited. However (and independently from the precise reading interaction) this reading mechanism leads to a paradox. An efficient discrimination between sequences implies indeed a rough interaction energy strongly varying as a function of the protein position along DNA, and such an energy profile leads in turn to a trapping of the protein, which reduces considerably its mobility. The mobility of the protein seems therefore to be in contradiction with its specificity, i.e. its capability of discriminating the good sequence [21, 22, 23, 24]. This paradox is not always taken into account in the literature concerning target search, but some authors have addressed the problem. Intuitively, one solution seems to be the existence of two different states for the protein: one state where the protein slides but cannot recognize the sequence, and another state where it reads but moves in a much slower way. Mirny and co-workers proposed that the protein could undergo conformational changes between a search state and a recognition state, in an intermittent way [23, 24]. We have proposed an alternative mechanism, where the key parameter will be the distance between the protein and the DNA [25, 26]. Since the range of H bonds is rather short, one can guess that this distance can indeed play a crucial role. Our starting point has been the study of the physics of the interaction between protein and DNA, with a focus on the electrostatic interaction.
A second important ingredient, usually neglected in the modeling of protein-DNA system, emerges from this study: the protein shape. We have shown indeed that a charged convex body (like DNA) counter-intuitively repels an oppositely charged concave body (like DNA-binding proteins), provided the two bodies do not exactly neutralize each other [25, 26]. In the following, we will describe how to obtain this result, and discuss its implications on the search mechanism. A possible solution for the mobility-specificity paradox.
2 Protein diffusion in the cell
2.1 Diffusion: a stochastic regulation tool?
The search of a target DNA sequence may have a particularly evident biological importance in cell differentiation as evidenced in some recent theories. Among others, JJ Kupiec rejects the predominant role attributed to the ”genetic program” (all information necessary for the development of the organism is encoded in the genome) and stereospecificity (for each cellular function there is a specific protein that acts through a deterministic ”key-lock” recognition mechanism). An alternative model for cellular functioning is proposed, based on evolutionary approach. In this model, in brief, proteins diffuse into the cell and interact randomly with DNA. Gene expression is also random. However, these interactions are statistically regulated by the position of genes in the cell space and along the genome: the probability of interacting with a closer site is higher, and this effect is strong enough to introduce a differentiation in gene expression. This mechanism finally leads to a kinetic competition that allows to set the appropriate gene expression and to stabilize it as best suited to the needs of the cell [27].
Even without adopting this point of view entirely, it is interesting to note that it involves several important elements of the cell functioning. Most of them are nowadays well substantiated. First, it is clear that the affinity of proteins for their target sequences is relative (see e.g. [28]). This introduces the problem of obtaining specific recognition while avoiding an excessive competition between slightly different sequences, an effect which can lead to a trapping effect [29, 23, 24]. On the other hand, it is also clear that there is a stochastic component in the search mechanisms, related to the presence of a diffusive dynamics, which allows proteins to move and meet their specific sequences. It follows that gene regulation depends on a stochastic and complex dynamics, and it is therefore appropriate to propose a statistical physics approach to describe regulation, based on a precise description of diffusion, recognition and competition mechanisms.
From the point of view of the diffusion dynamics, target sequences search is indeed a very active research field, involving both theoretical and experimental groups (Halford and Marko wrote a recent comprehensive review of this literature [9]). From the pioneering works of Berg and von Hippel [30, 31, 32, 33, 7, 3], attention has focused on the rate constant of the association reaction between the protein and its target sequence. Then appeared a difficulty: assuming that the protein finds its target by simple random diffusion within the cell leads to reaction times which are too low if compared to those experimentally observed. In 1970, Riggs et al. [1] showed that the association constant of Lac repressor with the initiation site of the lactose operon was two to three orders of magnitude higher than the theoretical prediction of the Smoluchowski theory for chemical reactions limited by diffusion [2] ( M -1 s -1 against to obtained from the theory). In addition, it was noted that the association constant of the Lac repressor with its specific site is also an increasing function of the length of the flanking non-specific DNA present in the sample [7]. This observations suggest the existence of an additional mechanism, involving the interaction of the protein with nonspecific DNA, and able to accelerate the search for the target sequence.
2.2 3D versus 1D
It was then proposed that this particular strategy, able to optimize the target search time and called facilitated diffusion [3], can be associated with an intermittent diffusion, composed by several different displacement modes (Figure 2). The newer idea was to include a mode called sliding : a one-dimensional, thermal diffusion of the protein along the double helix. The diffusion of the protein during the sliding has been initially considered either as a free diffusive movement on a (two dimensional) cylindrical surface surrounding DNA, or as a motion along the helical path following one DNA groove. The last hypothesis has the advantage to keep the protein in closest and constant contact with the DNA base-pairs, allowing the protein to maintain a specific orientation with respect to the DNA helix. An helical trajectory has been then indirectly proved for the case of some DNA-binding proteins [34, 35], but the question remains open in general [36].
Two other displacement modes, rather similar to each other, are called hopping and jumping, and consist in diffusion excursions in the three dimensional space, allowing the protein to jump to more or less distant sites along the chain. Finally, during intersegmental transfer proteins can transiently bind to two different DNA sites at a time and then directly move from one region to the second one without any intermediate diffusion.
The advantage common to all these mechanisms is to reduce the size of the searched space, thus accelerating the localization of the target sequence. Among them, one-dimensional sliding has been soon considered as necessary by most authors. The relative weight of sliding with respect to three-dimensional diffusion has then be subject to debate [5]. It is obvious that pure sliding would not be very effective if the starting position of the protein on DNA is far from the target sequence, since the protein will then spend too much time in searching remote regions unnecessarily. This effect is of course enhanced dramatically by the slow progression that characterizes diffusion (the visited space scales as the square root of time). Under certain assumptions, it is possible to prove that there exists an optimal choice of the mean times spent in 1D and 3D phases respectively, that minimize the overall target search time [37]. However, the precise mechanisms governing these two types of motion and the transition from one to the other have still not been elucidated.
2.3 Experiments: Biochemistry, AFM and fluorescence microscopy
From the experimental point of view, the possibility to observe one-dimensional diffusion of proteins along DNA has aroused great interest. Biochemical experiments have been performed to measure the average protein-DNA reaction rates as a function of different parameters, and in particular of the lengths of DNA sequences where the target is inserted, were reported [1, 7, 10]. A more quantitative and accurate method, but only applicable to certain proteins, is based on the evaluation of the correlation between the activity levels of a protein in two remote sites located at a known distance on a DNA molecule (processivity) [38]. It is interesting to note that, despite its good performances, this experience is open to multiple interpretations [9], and its results are difficult to reproduce by simple models [38]. Alternative techniques as atomic force microscopy [39] and fluorescence microscopy [40] (Figure 4) allow a direct visualization of the protein movement.
The basic principle of the atomic force microscopy (AFM) is to scan the surface of an object by a nanometer sized tip to reconstruct the geometry of the surface. In the case of protein-DNA systems, protein and DNA can either be fixed adsorbed onto the surface, loosely enough to be able to diffuse on it [39]. Despite the very high spatial resolution, this technique was initially limited by a low temporal resolution: tens of seconds between two images. More recently, high-speed AFM allows scanning biological samples in buffer up to 30 frames per second [41].
However, another limitation, particularly relevant in the study of diffusion, is due to the presence of the surface itself, which limits the free space around the molecules. Double-stranded DNA immobilized on the surface may function as a trap reducing Brownian motion [42]. Similarly, if DNA sliding through a fixed protein may induce anomalous diffusion as for the passage of a polymer in a pore [43].
Fluorescence microscopy is used to study processes on large spatial scales and temporal areas (from nanometer to micrometer and from nanosecond to second) [11, 44, 45, 13, 46, 47]. The operating principle is simple: the protein is chemically linked to a fluorescent label (organic fluorophores, fluorescent nano-crystals, fluorescent proteins, quantum dots …) and can therefore be observed optically. In practice, however, the experience is very sensitive and dependent on many details, particularly related to the properties of fluorescence markers (lifetime of the light emission, flashing…).
Moreover, in order to observe the diffusive motion of a protein around a DNA molecule, it is necessary to fix the DNA in an appropriate manner, in order to immobilize it while leaving the space necessary for the interaction with the protein. Techniques of DNA ”combing” have been proposed to this aim. Starting from the DNA molecule in its random-coil configuration (the form in which it is found naturally in solution) one of its ends is first bound on a chemically treated glass surface. Then the surface is slowly withdrawn causing the stretching of the molecules by capillarity. Alternatively, combing can be obtained through the application of a hydrodynamic flow of DNA molecules attached at one end: this method enables a more soft stretching, which in addition can be controlled so as to obtain more or less important stretching degrees [48].
Like any conventional optical microscopy technique, fluorescence microscopy is limited by the diffraction of light. Its resolving power is about 200 nm. However, it is possible to go down to about 30 nm resolution by image analysis techniques for determining the center of the light spot recorded. This gives a good enough resolution to detect the movement of the protein between two successive images, which are usually separated by a few tens of ms.
An example of the results obtained by fluorescence microscopy is represented by the work of Pierre Desbiolles group [13], an extract of which is given in Figure 4. The registration of the position of the endonuclease EcoRV when bound non-specifically to DNA is decomposed into a longitudinal component and a transverse component. If the latter remains limited, the longitudinal component mean square displacement is proportional to time, consistently with one-dimensional diffusion along DNA. In addition, several dissociation/re-association events are observed, as indicated by a faster movement leading to the re-association on a distant DNA position in a single time frame, i.e a hopping process following the usual definition (Fig. 4A and B).
2.4 Who helps who?
Thanks to fluorescence microscopy experiments, sliding has become a reality and its existence as a step in target sequence search is nowadays largely accepted. Nonetheless, the actual role of this searching mechanism is still under discussion. An important element in this discussion has been the S. E. Halford’s paper [5], where the author contest the need of any mechanism to facilitate the search and affirms that “no known example of a protein binding to a specific DNA site at a rate above the diffusion limit” exist. Indeed, if both 1D and 3D diffusion processes can be observed, the conclusion that facilitated diffusion may greatly enhance DNA-protein association rates is more questionable. The point raised by Halford is that the rapidity of these reactions is instead due primarily to electrostatic interactions between oppositely charged molecules [5]. The large association rates reported in the pioneering work [1] where indeed obtained at very low ionic strength, suggesting a role of the electrostatic attraction that becomes negligible, due to screening effects, in higher salt. This conclusion has however been overlooked in the following literature, until Halford’s work. We emphasize, in particular, the crucial role attributed to electrostatic, a point to which we will come back in the following.
It is also interesting to note that electrostatic should also determine another important feature of the search process, namely the protein-DNA association strength and therefore the lifetime of the 1D diffusion phase, and therefore the relative weight of 1D and 3D processes. This is another important question evoked in discussing the relevance of sliding as a enhancing mechanism in target search. In Ref. [49], the same S. E. Halford and co-workers showed for the restriction enzyme ecoRV that at low salt, the protein only slides continuously on DNA for distances shorter than 50 base pairs. Transfers of more than 30 base pairs at in vivo salt, and over distances of more than 50 base pairs at any salt, always included at least one dissociation step. The authors then conclude that 3D dissociation/reassociation is its main mode of translocation for this protein.
To end this discussion, we would like to point out that that question of the relative role of 3D diffusion and sliding can also be seen in an opposite way. Due to the electrostatic attraction, indeed, one can take as reference the weakly bound state where the protein stay along DNA. The question is then whether or not 3D excursions may help the protein 1D search, and reduce the search time. This is the point of view adopted e.g. by the group of O. Bénichou [50].
Whatever the philosophy one adopts, the question of the target sequence search reveals an unexpected richness. Electrostatics seems to be an essential ingredient and, if intermittency is expected to improve the search time in any case, observations and models invoke different sliding mechanisms (along the helical path or not), together with jumps and hops. Moreover, as we will seen in the next section, alternative sliding modes have been proposed in order to solve additional difficulties in explaining the protein mobility. It is therefore tempting to ask whether a different “paradigm” for the search, based on a different description (or parametrization) of the whole process, may be more adapted.
3 Diffusion along the DNA: what role for the sequence?
3.1 Reading the sequence
3.1.1 Direct and indirect interaction
While experiments on sliding were multiplying and becoming more refined, this problem was attracting more and more theoreticians, seeking a consistent modeling of the observed phenomena.
Different models have been proposed. However, all models seem to lead to more or less important inconsistencies, and a unified model has not yet been imposed. Some authors [3, 9] consider DNA as a uniform cylindrical space in which the protein is trapped by electrostatic interaction, and could slide spontaneously under the effect of thermal agitation. Some models where the protein would even slide along the helical structure of DNA have been envisioned fairly early [51].
However, as some authors stressed rather soon [52, 21, 23], the recognition of the target sequence needs a way of reading the sequence, which cannot be taken into account by an homogeneous interaction. In order to discriminate the target sequence, it is necessary to introduce a sequence-dependent interaction, albeit small.
To get a concrete picture of this interaction, let us consider as an example a particular protein, the RNA-polymerase of T7 virus. The specific complex formed by the T7 RNA-polymerase and its target sequence (a gene promoter) has been studied by crystallography [53] (Figure 5). The protein-DNA interaction occurs in three regions: in a first region of 5 base pairs the double helix is bent by the presence of the protein; in a second region, 5 base pairs long, a set of hydrogen bonds between the side chains of the protein and the base pairs is made; finally, in correspondence of a third site, a portion of the protein in inserted between the two helices of DNA causing a local opening of the double helix.
Among the different interactions, some are likely to participate in the target sequence search, others are probably induced only once the target is reached. The latter interaction, which characterizes the formation of the open complex (the pre-activated state, ready to start the gene transcription), is most probably absent during the search. The two other modes of interaction are two typical example of direct (chemical) and indirect (mechanical) interaction [54]. The first interaction will include, typically, direct hydrogen bonds to base pairs and Van der Waals interactions [55, 15]. Hydrogen bonds provide the higher level of sequence specificity, and may be used to define a simple code to explain sequence reading. In the following, we will precise how this specificity is obtained.
Entropic contributions due either to the loss of degrees of freedom of the protein and DNA, or to the expulsion of ions and water molecules from the protein-DNA interface, may also contribute to the direct par of the interaction, but their degree of specificity is less easily quantified.
On the other hand, sequence-dependent changes in DNA structure, or in its mechanical or dynamic properties, can also play a role in recognition [54]. Sequence-induced protein deformations may also be considered. Such mechanical effects may be used by the protein as discriminating tools.They may give rise to rather smooth energy profiles [23], correlated over distances comparable to the length of the target sequence (Figure 6), and has interesting dynamic properties not yet fully explored.
3.1.2 Hydrogen bonding
Let us now just take into account the hydrogen bond contribution to the overall interaction, and precise its origin. All DNA base pairs expose in the major groove a regular pattern of four chemical groups that can be donors or acceptors of hydrogen bonds (Figure 7). On the other side, a protein like the T7 RNA-polymerase presents a reactive site that contains, through the arrangement of its side chains, a recognition pattern containing the information on the correct disposition of donor and acceptor groups in the target. It seems reasonable to assume that the protein looks for this same pattern on any sequence during the search. We also assume that the H-bonds formed in the DNA-protein complex at the recognition site are known (this information can be obtained from crystallographic analysis of the DNA-protein complex). The interaction between the protein and a given sequence can therefore been simply described by counting the number of bonds it can make at that position, i.e. the number of DNA groups that are consistent with the protein recognition pattern. Within this model, the protein can be represented by a recognition matrix containing the pattern of H-bonds formed by the protein and the DNA at the recognition site.
When the protein is at position , the sequence that it is visiting can be represented as a list of vectors, , where
and where the number of vectors correspond to the length of the visited sequence. The recognition matrix is then a N4 matrix containing the “good” pattern of hydrogen bonds, i.e. the one that will be made on the target. In the specific case of the T7 DNA-polymerase, e.g., the recognition matrix reads
| (1) |
where the factors have been introduced in order to reproduce one hydrogen bond shared by two base pairs. The interaction energy for the protein at position is then given by the sum of all positive matches and can be written as
| (2) |
where is the net energy gain of a single hydrogen bond (of the order of a fraction of [56], see discussion below).
Equilibrium measurements [28] reveal that the binding energy of a protein to a given sequence can be described, to a good approximation, as the sum of the binding energies to the single base pairs composing the sequence. If the latter can be assumed as independent, then the binding energy can be reasonably described as a Gaussian random variable [29, 50]. This is indeed what is measured for some real cases [50]; in the case of the T7 RNA-polymerase, the same results has been derived based on a detailed analysis of the protein hydrogen bond pattern [22].
3.2 The recognition-mobility paradox
The one-dimensional diffusion along DNA (sliding), apparently simple, may hide an unexpected complexity. Most of the authors assume however for this diffusive phase a simple diffusive dynamics or normal diffusion. In this case, the mean square distance traveled by the protein along DNA after a time is proportional to time, i.e. , where the only parameter that remains to be fixed is the diffusion constant . Now, if this model is appropriate when the interaction energy is absolutely uniform along the DNA, it is no longer valid when a sequence dependent energy profile is taken into account.
Starting from the previous definition of the protein-DNA 1D energy profile11 1 The energy profile described here may be enriched by adding energy barriers for the translocation from any DNA position to the next one. The results are quantitatively, but not qualitatively, affected., it is easy to model the one-dimensional diffusion. The protein moves by one-site steps on the energy landscape , with rates of translocation between neighboring sites and defined according to the Arrhenius law, i.e. proportional to whenever , while it is constant if . Both expression can be formally written as an identical exponential term of the form by defining . If, moreover, we want to include a nonzero probability for the protein to stop at one position, the complete set of translocation rates will reads: :
| (3) |
where .
Note that the case corresponds to a constant energy landscape, i.e. to a simple 1D diffusion process with diffusion constant . This limit can also be recovered in the case where .
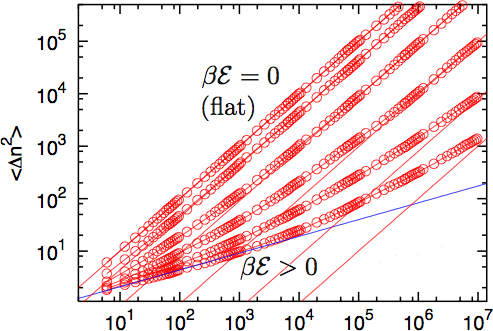
The numerical study of this diffusion process gives a predictable result: the trapping effect due to the roughness of the potential gives rise to subdiffusion [21, 22]. Figure 9 show this effect as a function of the potential roughness .
In the limit of a , i.e. in the case of a flat underlying potential, the diffusion is of course standard, with and a linear dependence on time, so that the corresponding curve is a straight line of slope 1 in the log-log plot. For larger values of , the dynamics shows initially large deviations from the normal diffusion: in these finite temperature cases,the mean square distance is no longer proportional to time, but increases as a power of time which is smaller than unity, according to the law
| (4) |
This effect is transitory: the diffusion becomes normal when one considers long enough time. Accordingly, the exponent increases with time toward its equilibrium value of . This is due to the characteristics of the energy profile, which is rough, but bounded. Roughness thus affects the diffusion for short times, i.e relatively small distances, but it is smoothed out when longer displacements are considered. Overall, on long time scales it only affects the average.
However, the lifetime of the non-specific DNA/protein complex can be relatively short: normal diffusion behavior can never be reached, and subdiffusion may be the most appropriate description of the protein motion. Moreover, even if the normal diffusion regime is reached, the transitory sub-diffusive phase will significantly change the overall distance travelled by the protein after a given time. By focussing for instance on the time needed to perform a mean squared displacement of 100 bp2 (therefore a typical distance of 10 base pairs), we can see from Figure 9, we can see that this time can be increased by up to three order of magnitude for the values of used.
In conclusion, this deviation from normal diffusion is not a merely academic question: all quantitative estimates made to determine the respective roles of 1D and 3D search would be affected and should be recalculated in view of these results. We stress that it is not easy to obtain a reasonable estimate of the parameter. However, rough estimates based on typical hydrogen bond energies (of the order of a fraction of [56]) do not seem compatible with the double requirement of a protein which has to be free enough to slide along the DNA molecule but also able to bind its target sequence with an energy much higher than for other sequences, so as to ensure a good specificity [22, 23, 24, 50]. In this sense, the trapping effect observed in this simple model evidences the existence of a recognition-mobility paradox (also called speed-stability paradox in the literature). A different way of presenting the paradox, although leading to the same conclusions, is to show that disorder in the binding energy profile on which diffusion takes place leads to an effective diffusion constant that decreases exponentially with the variance of the energy distribution [57, 24, 50]. Essentially, the requirement of a reasonable specificity prohibits the protein to diffuse.
3.3 Two-state models
To solve this paradox, some new mechanisms have been invoked. One of them can be a modified energy distribution where the binding energy at the target is reduced without affecting the energy distribution variance. However, experimental data does not support this hypothesis [50].
An alternative solution may be associated with protein conformational fluctuations, this leading to introduce “two-state” models. In brief, the idea is to provide two different 1D sliding modes: a first, reading mode, where the protein is able to read the sequence with a reduced mobility, and a second, diffusing mode where the protein is able to move relatively rapidly along the double helix, but is essentially blind to the sequence [7, 58, 59, 60]. The conformation change was initially attributed to a microscopic binding of the protein to the DNA accompanied by water and ion extrusion, but such a transition is usually accompanied by a large heat capacity change [61] that in turn need significant structural changes to be accounted for. Hence, it has been proposed that these two states can be associated to distinct conformational states of the protein-DNA complex [29], eventually associated to a partial protein unfolding (in the diffusing mode) [24] (Figure 10). However, this mechanism is only efficient if an effective correlation between the transitions between the two modes and the “underlying” energy profile exists. In this way, the transition to the reading mode happens mainly when the protein is trapped at a low-energy site of the search landscape, this being related to a mechanism based on residence times [24].
A recent analysis of the efficiency of such mechanism seems to rule out these models, based on quantitative estimates of the relevant parameters [50]. Similarly, it is shown that the presence of a large number of copies of the same protein can resolve the recognition-mobility paradox only if the energy profile has a small variance [50]. Instead, a new mechanism which is based on barrier discrimination is proposed, which allows to obtain a possible solution fir the process [50]. The basic idea is again that the protein has two different conformations, but the additional element is that these conformations are separated by a free-energy barrier whose heigh depends on the position along DNA. This implies a differences between transition rates from the diffusing to the reading mode that finally allow the protein to improve it search time as requested.
4 Electrostatics. The DNA-protein interaction
4.1 DNA
In the approaches to the study of the kinetics of protein search described until now, the physics of the DNA-protein interaction is only indirectly taken into account. In particular, a description of the electrostatic interaction between the two macromolecules in solution was completely missing. In reality, as already mentioned, electrostatics plays a fundamental role in this system.
The mechanical behavior of a DNA molecule of given length can be described, in an effective manner, by different models of polymers [64]. Different models can be in rather good agreement with experimental results for force-extension experiences, typically performed using optical or magnetic tweezers. In this set up, one end of a DNA molecule is bound to a flat substrate, and the other end to a colloidal bead that can be manipulated by an external optical or magnetic field, so to exert a force on the bead and thus on the DNA molecule. The best fit of the resulting data is given by the Worm Like Chain model, describing the DNA as an elastic rod (Figure 11). The torsional rigidity of the rod is accounted for by a given value of the persistence length 22 2 Explicitly, the persistence length can be defined as the characteristic length of the exponential decreasing of the angular correlation of the tangent vector to the polymer (see e.g. [64]).. For DNA, is about 50 nm, i.e. approximately 150 base pairs. This is a quite unusual value for a polymer of 2 nm thickness: we could expect a higher flexibility at a scale much larger than the thickness.
This large persistence length depends on an aspect of DNA that have not yet discussed: it is a polyelectrolyte, i.e. a charged polymer. Each phosphate group in the DNA backbone is indeed negatively charged. Since there are two phosphate groups per base pair in double-stranded DNA, this corresponds to a linear charge density of the order of -2 per base pair (3.4 nm), or -6/nm, or finally a surface charge density of the order of -1/nm2. In comparison, if a power cable in the air had the same surface charge density, the potential difference with respect to the ground would be four orders of magnitude larger than the breakdown voltage in dry air. The DNA molecule is therefore a highly charged molecule. As a consequence, the phosphate groups strongly repel each other, despite the screening effect due to ions in solution. This adds to the natural rigidity of DNA an additional stiffness, that justifies its large persistence length. At the protein scale, which is of the order of a few tens of nanometers, the DNA molecule can therefore be modeled as a rigid cylinder of radius 1 nm, carrying a constant surface charge density of -1 /nm2. For simplicity, we can also assume that the dielectric properties of DNA are those of pure water, i.e. 80.
4.2 Proteins
4.2.1 Charge
Non-specific interactions between proteins and DNA are poorly documented, but the predominance of electrostatic undeniable [14, 15, 16, 17, 18, 19]. Proteins that bind to DNA are most often positively charged. More precisely, positively charged patches are observed in the region which faces the DNA when the specific complex is formed, an effect which can be accounted for by evaluating the propensity of positive residues to occurs more frequently in a DNA-binding interface [14, 15, 65, 66, 67, 68, 25].
As an illustration of this effect, we show in Figure 12 an analysis of the large dataset of DNA-binding proteins features presented in Ref. [14]. Among the proteins analyzed in this work, it is possible to identify a large family of specific proteins, i.e. binding to specific sequences: this family includes transcription factors, TATA-binding proteins, and restriction enzymes. Other non-specific proteins such as eukaryotic polymerases, repair proteins, histones, form a second group. We evaluated the surface charge of these proteins in the region of interaction with DNA by counting the charged residues at the interface, and we obtained a very interesting histogram of the charge densities. In all cases, the DNA-protein interface results to be positively charged. Interestingly, in the case of proteins that recognize specific sequences, such as transcription factors and restriction enzymes, we obtained an average density of surface charge nm-2. Besides, we find that non specific proteins are more charged: we get nm-2.
Now, the main role of the positive charge of the protein is, of course, to create an electrostatic attraction to DNA. But the difference observed between different classes of proteins, and the fact that their charge seems to be rather finely tuned, suggest that the surface charge may have a more precise function in the interaction with DNA, that it would be interesting to elucidate.
4.2.2 Shape
If the charge of the protein immediately appears as one of the main ingredients in an electrostatic model of the protein-DNA interaction, another potentially essential ingredient is less easily recognized. Yet, one of the most characteristic aspects of the DNA-binding proteins is their shape complementarity with DNA. DNA-binding proteins often have a concave shape that fits closely DNA. They can cover the DNA molecule by using up to 35 % of their surface [14]. Averaging over different types of proteins, one obtains for the average surface of the interface a value of nm2 [14, 15, 65, 25]. Generally, and particularly for enzymes, electrostatic patches and significant protein concavities often overlap, so that DNA is ”inserted” in this concavities leading to a quite typical enveloping or complementary shape [14, 65] (Figure 13).
This shape complementarity of DNA-binding proteins and DNA enables to maximize the number of direct interactions with DNA base pairs [14, 15]. Interfaces of DNA-binding proteins have indeed on average more potential hydrogen bonding groups (more than twice as many) compared to regions that do not bind DNA [65]. In the specific complex, these bonds may the protein closely stack to DNA, so that interfaces exclude solvent molecules from the interstitial space. However, it is tempting to ask whether this particular protein shape may play a role in non specific protein-DNA interactions, at work during the target sequence search. In this regard, it is interesting to note that structural studies of some non-specific protein-DNA complexes show a gap between the two macromolecules, filled with solvent [14, 15, 17, 18, 19]. This observation suggests the existence of a force that counteracts the electrostatic attraction. If this is the case, the question arises as to the physical origin of this repulsive force, and how it depends on the precise value of the surface charge of the protein.
4.3 A Monte Carlo study
In order to describe the electrostatic interaction between protein and DNA and the role of the protein charge and shape, we developed a minimal model of DNA-protein system to be studied by Monte Carlo simulation [25, 26]. We modeled the DNA as a regular cylinder, two nanometers in diameter. To compare different protein shapes, we modeled the protein by simple solid bodies: either a sphere, or a cylinder, or a cylinder with a cylindrical cavity. Hollow cubic shapes have been also tested. DNA charges are placed on its axis, protein charged are placed just below the surface which faces the DNA. The relative orientation between the protein and the DNA was fixed so to orient the charged surface of the protein toward DNA. The distance between two objects was then varied.
The two bodies are placed in a simulation box with periodic boundary conditions, where water and ions are described by primitive model [69]: the solvent is treated as a continuum dielectric medium with dielectric constant , while all ions are modeled by small charged spheres of radius nm. Monte Carlo simulation was done in the presence of monovalent salt corresponding to physiological conditions (0.1 mol L-1, or 0.06 molecules nm-3).The electrostatic forces acting between protein and DNA can then be calculated, and integrated to obtain the free energy profile as a function of the DNA-protein distance [70, 71].
Monte Carlo simulations show that while the overall shape of the protein has little influence on the interaction, its complementary with DNA is crucial. The complete comparison of the different protein models have been presented in Ref. [25]. The main result of this analysis is presented in Figure 14, where the free energy profiles obtained with the spherical and complementary shapes shown in Figure [25, 26]. While in the case of a spherical protein the electrostatic interaction is always attractive, in the case of complementary surfaces a repulsion appears below a distance of a fraction of nanometer (0.1 to 0.75 nm, as a function of the protein charge). A ”naive” modeling of the protein as a sphere might be therefore not suitable for the study of the electrostatic interaction! This result is remarkable: above a distance of the order of a nanometer, the protein is repelled instead of being attracted by DNA. We will discuss the possible biological role of such an effect in Section 6, but before, we would like to give a closer look at the physical mechanism leading to this rather surprising effect.
5 Theoretical approach
What is the physical origin of the repulsion? It is obviously related to the fact that the two charged bodies are immersed in an ionic solution: the physical description of the system will therefore require some notion from colloidal systems physics. On the other hand, Monte Carlo simulations showed that this repulsion is related to the presence of the two complementary surfaces, which create a large interface between the two charged macromolecules. We can then assume that for small distances between the two bodies, the system can be reasonably approximated by two planar charged surfaces approaching one another (e.g. the DNA plate at and the protein one at , as in Figure 15). This model is very simplified but, precisely for this reason, can be solved by a semi-analytical approach [72, 73, 74, 75, 63] whose physical insights are summarized in this section. We will see that having monovalent ions in solution has two consequences on the attraction between two oppositely charged plates. First, ions generate an osmotic repulsion, due to the loss of available space for them to move as the plate-to-plate distance decreases. Second, a screening effect due to the presence of a salt in solution. To gain as much physical insight as possible we shall introduce these two aspects one at a time, starting with the osmotic repulsion.
5.1 Counterions only
We start considering a protein-DNA system modeled as two plates with only one type of monovalent counterions in between so as to ensure electroneutrality (Figure 15 (b)). On the one hand, if and respectively denote DNA’s and protein’s surface charge densities, then the direct electrostatic force per unit area between them is . On the other hand, modeling the ions as an ideal gas in a slit of width , the corresponding osmotic pressure is with . Balancing these two pressures yields an equilibrium distance that reads:
| (5) |
where we introduced the Gouy-Chapman (GC) length for a plate with surface charge (in units of per unit area) and where is the Bjerrum length. In this first limiting case, we have therefore easily estimate the equilibrium distance between the two plates, due to the imbalance between electrostatic attraction and ion osmotic pressure.
A comment on GC length will be useful. The GC length represents the width of the layer of counterions condensed at the plate of charge they neutralize. It can be retrieved by seeking at what distance from the plate a condensed counterion would go because of a thermal fluctuation. The counterion density at a distance from the charged plate33 3 The given formula works when one considers a plate and a fully neutralizing solution on its right i.e. there is no electrolyte on the left of the plate. reads [74]. Two things are worth noting from this formula. Firstly, the density at zero is . This result is easily understandable from a physics point of view, since it could have been obtained by imagining that all the counterions are trapped in a layer of width . Secondly, since the charge density is not uniform and actually decays as increases, the cumulative ionic charge over GC lengths is so that for , only 50 % of the charge of the plate is screened (instead of the 100% one would have guessed from the density at the plate and with uniform assumption).
5.2 High salt concentration
When salt with bulk concentration is added to the system, each counterion has a screened electrostatic interaction with the others and, at a coarser level, the plates also have a screened electrostatic interaction. This screening effect is accounted for by a unique parameter called the Debye screening parameter, for a symmetric electrolyte. It is more intuitive to look at the inverse Debye parameter, , called the Debye length, that can be understood as the effective range of the electrostatic interactions in solution.
The osmotic effect, still related with ions thermal motion, plays two different roles when salt is added. First, trapped counterions tend to repel the plates; second, bulk ions tend to increase their accessible volume at the expense of the volume between the plates, and therefore contribute attractively to the osmotic pressure. At high salt concentration, the resulting positive excess osmotic pressure in between the plates reads [72] where is the dimensionless electrostatic potential at . If we moreover imagine that at close protein-DNA distances the dimensionless potential is dominated by the most charged plate (i.e. the DNA plate), then we have at the protein plate and .
Since the electrostatic force is screened, we can assume that at the protein plate it equals . As before, equating these two contributions allows one to get an equilibrium distance:
| (6) |
Although the assumptions we used to derive Eq. (6) in a simple manner seem very restrictive, this last result is much more robust and holds whenever the salt concentration is high [72, 73, 63]. It is also worth noting that Eq. (6) can be rewritten in a way similar to Eq. (5) by introducing an effective counterion cloud size at high salt concentration so that Eq. (6) reads now:
| (7) |
The expression given for cannot be interpreted as simply as the GC length because the presence of salt in the system imposes one to choose explicitly a gauge for the potential [76]. In practice, the potential offset is commonly chosen so as to be zero in bulk solution (i.e. far away from the plates). This implies that in a high salt regime the potential at the plate is of order and asking at which distance from the plate a fluctuation can bring a counterion does not make sense in this context (while it did in absence of salt). Finding an interpretation is not desperate however and one can check easily that at a distance away from the plate, the potential is of order . Hence, each step away from the plate decreases drastically — by the same proportion — the potential toward zero. Another way to look at this question is to compute the cumulative charge over a width from the plate. This quantity scales as : hence, almost 100% of the plate charge is screened by this cumulative charge and we now exactly how far it is from 100%. Finally, note that the cumulative ionic charge in the high salt case is much faster closer to the charge plate than in the counterion case. This reflects the very different behavior of the charge density in those two cases: in the case of counterions only the charge density decays algebraically, while in the high salt case it decays exponentially.
5.3 General case
In general, the screening effects do not write as simple exponentials and both electrostatic and osmotic contributions are complicated to assess. Eventually, one can find the exact equilibrium distance within the Poisson-Boltzmann framework [77, 78, 63]. We will try to give an intuition for the result by extrapolating the above relations (5) and (7) to a more general situation. We will assume that if an equilibrium distance exists, then it should take the form of a difference between two effective counterions cloud sizes and respectively brought by the DNA and the protein plates. For each plate of charge density , this effective length has to be a function of and . In addition, in low salt regime (i.e. ), while at high salt concentration (i.e. ), . The only form that satisfies these constraints is:
| (8) |
A full physical analysis of this particular lengthscale in the general case of a single plate neutralized by an electrolyte can be done semi-analytically from an exact formula for the potential (see e.g. Ref. [78]) or numerically. Here, we will just emphasize that, after steps of size , the potential goes as where and for sufficiently big and therefore tends to zero. Depending on the value of , the true charge density will lie in between an algebraically decaying form and an exponentially decaying one so that the cumulative ionic charge gotten over a width can take any value in between 50 % and 100% of the charge plate.
5.4 Energy at the minimum
Although not intuitive, we have tried to give some motivations for the expression (9) that takes the equilibrium position at which (excess) osmotic and (screened) electrostatic pressures balance each other in the general case. Now, it so happens that the free energy per unit area at this very equilibrium position can also be derived exactly and reads [77, 63]
| (10) |
where and are respectively the smallest surface charge density (in absolute value) and its corresponding GC length. In our case .
The free energy per unit area of equation (10) gives the depth of the electrostatic well at equilibrium, and is therefore a direct measure of its stability. Akin to Equation (9), expression (10) is quite difficult to guess, in particular because osmotic and electrostatic effects are now completely intertwined. We can still try to give a flavor of what is happening at least in the high salt regime when . In this case, we make use of the fact that as and equation (10) gives thus . Let us try to derive this result directly, in the high salt regime. To do so, let us assume that only the screened electrostatic part is working and that we can neglect any osmotic effect. Integrating term from infinity to should give us an estimate of the depth of the well. We obtain
| (11) |
Doing a little more algebra leads us to the result which differs from the exact formula in the high salt limit only by a factor 2 [72]. This missing factor 2 comes from the fact that there is an entropy gain from releasing salt into the bulk as the plates are brought closer from infinity and therefore, the interaction is more attractive than with screened electrostatic only [72, 78, 25].
In the simple calculation above, we can also get some insights about why does the well depth only depends on one charge density. As we have seen, the electrostatic pressure is symmetric under the operation of exchanging the plates, hence does not prefer one plate over the other. The equilibrium length, however, has to be positive and cares about which charge density is the smallest. This is therefore the evaluation of a symmetric term in charge densities at a position that is an asymmetric function of that selects out the smallest charge density to be relevant for the energy at the minimum.
In summary, it is possible to obtain exact expressions for the position and depth of the free energy minimum corresponding to the equilibrium position induced by the balance between electrostatic attraction and osmotic repulsion (Equations (9), and (10)). These quantities depend on the plate charge densities as well as on the salt concentration 44 4 A more detailed analysis of the dependence on these quantities (and on the solution pH) can be found in Ref.s [63, 26].. Note moreover that Equation (10) gives a free energy per unit area, hence the total free energy is also proportional to the area of the interface.
6 Toward a new paradigm for the target search process
6.1 Redefining hydrogen bonds
Let us now come back to biology. According to our model, if the protein-DNA interface is large enough, the protein is pushed away from DNA until their distance is of the order of a fraction of nm. It is then tempting to guess that this effect can have a significant impact on the search mechanism: instead of ”sticking” on DNA, proteins might ”float” away from it at a very short distance, as if it were sliding on a thin cushion of air - in this case a ”cushion of ions”. Might its mobility along DNA be increased? The distance between DNA and protein in the nonspecific complex allows it to slide without being hampered by the roughness associated with the sequence? And if this is the case, how may the protein still be able to distinguish the target sequence from other sequences with sufficient efficiency?
As we have discussed, recognition at the specific site is often characterized by the formation of hydrogen bonds between residues of the protein and base pairs. We have assumed that the same pattern of ”possible” bonds may be used as reading frame during the search phase. In order to check the effect of the osmotic repulsion on this search mechanism, and therefore its balance with the specific part of the interaction, we should extend the model for this latter. While the number of possible hydrogen bonds at each DNA position can still be described as a gaussian variable, indeed, we now need to add the energy dependence on the new problem variable: the protein-DNA distance . An usual way to describe a single hydrogen bond interaction as a function of the bond length is by a Morse potential [79]. We will therefore write
| (12) |
where [56] coincides with the same parameter used in the 1D model of Section 3, but represents now more precisely the depth of the potential well corresponding to the bound state. In the previous expression, the parameter nm [80, 15] is the bond range.
Then, at each position (nm) along the sequence, we suppose as before that a number of hydrogen bonds can be locally formed by protein with bases between and . The interaction energy at position and at a distance of DNA, can be thus written as
| (13) |
In order to have a rather general model without referring to the case of a particular protein, we will model the number of hydrogen bonds by introducing reasonable estimates of its statistical parameters and by assuming a Gaussian distribution [21, 22]. This assumption, as we have discussed, is in agreement with some experimental data [28, 29, 50]. More precisely, we assume to know the number of bonds between the protein and its target sequence , which correspond to the maximum value of (highest affinity). We then describe the distribution of by a Gaussian with mean and standard deviation , and we furthermore impose, obviously, . These values are chose so that the probability of is realistically low. Indeed, even for sequences with a high degree of homology to the target one, the number of H-bonds dramatically decreases, as observed e.g. in the crystal structure of non cognate BamHI complex [18].
The maximum number of bonds can be estimated from crystallographic data for specific complexes, and gives an average value of about 1.5 hydrogen bonds per nm2 of DNA-protein interface [15]. For an average surface interaction nm2, we obtain 30, and therefore 10 and 5.5. With these choices, the probability of bonds is reasonably low (between 3 and 4 standard deviations, Figure 16).
6.2 A facilitated sliding
Summing up the two contributions, one coming from the electrostatic interaction, the other associated with hydrogen bonds, we obtain, for the case of a protein surface charge equal to the average value found above for specific proteins (0.17 nm e-2), the result presented as a free energy landscape in figure 17 [25].
When the protein is precisely at the target, a primary minimum exists almost at the contact with the DNA surface, corresponding to tight binding. Its depth is with our parameter choice. This primary minimum is separated by an energy barrier of the order of from a secondary minimum, coming from the electrostatic part of the interaction. A similar scenario will be observed in correspondence with the (rare) sequences that are close to the target sequence, and have therefore a high degree of affinity to the protein. On the contrary, for most of the positions along DNA, where the affinity is much lower, the primary minimum practically disappears and only the electrostatic equilibrium position at a distance from the DNA surface remains. Remarkably, the osmotic repulsion between sequence-specific DNA-BPs and DNA dominates along non-specific sequences : it is almost everywhere strong enough to keep the protein at a distance from DNA, this making it in practice completely insensitive to the sequence. Along the equilibrium valley, indeed, the roughness of the sequence-dependent part of the potential is screened out: the protein can therefore easily slide along DNA. At the target site, conversely, the large H-bond interaction significantly reduces the barrier, and the protein can approach the DNA.
Incidentally, the equilibrium gap distance of nearly nm that we observe in Figure 17 is in agreement with the distance observed in the complexes of EcoRV ( nm [14]) with non-specific sequences. This also gives a rational basis to some ad-hoc protein sizes that had to be put by hand in recent coarse grained simulations of protein sliding on DNA to ensure the protein would not go closer to DNA than the distance observed in the non-specific complex [81, 82, 83].
In other words, what we obtain is a mechanism that we could name facilitated siding: the mobility of the protein is guaranteed by the osmotic repulsion, until it reaches a good sequence and can bind it [25]. This mechanism may represent an efficient solution of the mobility-specificity paradox, since it introduces de facto a two-mode search: the protein is actually insensitive to the sequence all along non specific DNA, except for a few traps, and in the diffusing mode evoked in Section 3. However, note that, unlike previous models, the coupling between diffusing mode and ”wrong” sequences is here explicit and does not require any additional ”switching” mechanism. Moreover, in spite of the fact that the effective search obtained in our model can be intuitively described as a combination of diffusing and reading mode, the real mechanism is in fact different: the protein is no more sensitive to the sequence, whatever the position along DNA, but it is now sensitive to the free energy barrier that separates it from the sequence. Therefore, the interaction is always described in a similar way, but it allows for an energy activated change in the protein-DNA complex state (bringing the two bodies closer) for some special positions. Interestingly, a similar barrier-dependent mechanism is also invoked in Ref. [50] as a solution for the mobility-specificity paradox, although the details of the model, and notably the correlation between the barrier, the primary minimum and the sequence, are somehow different. This allows the authors to fit the available quantitative data on the search kinetics by a simple and generic kinetic model.
6.3 Toward a different modeling of the protein search
As we have discussed in Section 2, many theoretical models (see Ref. [50] for a good review) have been proposed to catch the essential features of the search mechanism. We note that all these models include sliding (to different extent) and focus on dichotomic views of the search process: sliding versus 3D diffusion, ”reading” versus ”diffusing” modes, specific versus non specific binding at the target, or specific versus non specific interaction (all along the DNA).
From a numerical point of view, detailed molecular dynamics simulations seem to suggest a more complicated scenario [84, 85, 86, 25] where DNA deformations, protein deformation, flexible protein tails behavior, entropic costs participate in defining a complex energy landscape for the protein-DNA complex, with rather continuous and complicated variations as a function of the the relative position of protein and DNA, either along the sequence (and therefore on and off the target) and in the radial direction, but also associated with the protein rotation and with the protein and/or DNA deformations (see [87] for a more exhaustive discussion). On the other hand, it is known that a significant stabilizing effect of the specific complex is associated with the release of water molecules [85, 86], which implies the presence of a layer of water between proteins and DNA in the nonspecific complex.
Very interestingly, the scenario obtained by our model shares some central features with what is found numerically by some authors. In particular, either Ref. [85] and [86] evidence the presence of two distinct free energy minima, one closer to DNA, the other farer from it, separated by a free energy barrier. The relative positions of the three states are smaller but not incompatible with what obtained in our model 55 5 In Ref. [85], the secondary minimum, barrier and primary minimum locations are found respectively at protein-DNA distances of 0.32, 0.31 and 0.3 nm. In Ref. [86], at 0.26, 0.13 and 0.08 nm, respectively..
These finding suggest an alternative way of describe the search process, by replacing the usual dichotomic view by a more ”soft” approach where the interaction is described in terms of continuous variables. The protein-DNA distance is indeed a crucial variable, potentially leading to a description of the protein kinetics where the distinction between sliding, hopping, jumping and 3D diffusion becomes somehow obsolete. More concretely, the movement of the protein in the vicinity of DNA can, in our scenario, be treated as a diffusion in the landscape of figure 17. Unfortunately, in vitro experiments, which assess for sliding cannot reach the resolution needed to describe the protein DNA interaction (and associated kinetics) at the scale involved in this model. However, experimentalists clearly distinguish at least phases where the proteins are ”on” DNA (and can therefore be observed) from phases where the protein dissociates from it. Moreover, rapid displacements along a same DNA molecule have been observed [13] that cannot be compatible with pure 1D diffusion along the double helix. The question therefore arise of how these different protein states or modes of displacement can be accounted for in the context of a continuous description.
6.4 Defining a physical-meaningful sliding time
By comparing our model to experimental estimates of the chemical rates of protein binding and unbinding, one can in principle get more decisive feedback about the landscape, since binding and unbinding events involve a wide range of DNA-protein distances. In the following, for the sake of simplicity, we shall focus on the dissociation rate of a non-specific protein-DNA complex although the binding rate can also be considered without too much difficulty following e.g. Ref. [88]. Moreover, we neglect here the effects due to the hydrogen bond interaction, only relevant at very short distances : the aim of this calculation is indeed to evaluate the time needed for the protein to escape from a generic, non specific position along DNA, i.e. to exit the secondary minimum defined by the electrostatic part of the interaction.
We are interested in the following reaction:
| (14) |
We will assume that the size of the particles is big enough for the unbinding process to be diffusion dominated [88]. Considering the energy landscape we derived in the previous parts, it is natural to use the surface-to-surface DNA-protein separation as the reaction coordinate. Moreover, if the energy landscape displays a well defined barrier between the two chemical states of reaction (14), then we can use Kramers’ rate theory for a one-dimensional isomerization process [88]. The dissociation rate reads then:
| (15) |
where is the diffusion constant of the protein, corresponds to the minimum of the binding well, is the location of the dividing surface i.e. the top of the energy barrier (cf. Fig. 18), and stands for a second derivative of the energy with respect to . The total effective interaction in Eq. (15) is defined so that the ratio of the marginal probabilities to be either at or reads:
| (16) |
for any and .
On the other hand, it is also possible to state that this same ratio should read:
| (17) |
where the is the free energy (that we estimated in previous Sections) that corresponds to the work one has to do to bring a protein from infinity to a distance from a DNA segment for any fixed value of the polar angle that locates the protein within the plane perpendicular to the DNA axis. The factor is a degeneracy term, associated to the probability of being at a particular distance from the axis of the DNA molecule. This probability grows indeed as the circumference of a circle of radius .
Note that, unlike , may present a maximum , i.e. an energy barrier between the location of the electrostatic minimum and the region (see Figure 18). From Eqs. (16) and (17), we thus find that the total effective interaction associated to a distance has to have the form:
| (18) |
where is some unimportant distance whose purpose is to have a dimensionless argument inside the logarithm. Now that we have understood that, we can try to interpret Kramers’ formula (15). To do so, we rewrite (15) in a slightly different way:
| (19) |
where and are respectively the typical sizes of the bottom of the well and the top of the barrier and where and are the typical times it takes for a diffusive protein to travel over the lengths and respectively. Thus, the pre-factor is nothing but the geometric mean of the natural rates and . To get some insights from Eq. (19), we first calculated from the model with parameters used for Figure 18, i.e. in the case of a physiological salt concentration mol L-1. We found that while the pre-factor . Overall the rate is . It thus means that on average in physiological conditions a protein with a landscape as that of Fig. 18 will stay less than a millisecond on a given DNA segment before leaving it. This observation seems however in contradiction with measured average sliding times in experiments [13] where a protein can be bound to a DNA segment for up to few seconds. This discrepancy is without accounting for the fact that the mentioned experiments are done at much lower salt concentration. In fact, as we have seen before, increasing the salt concentration can have a very strong effect on the free energy landscape. We thus recalculated it with the same protein and DNA parameters but with . We got that while the pre-factor in Eq. (19) is about . Overall the dissociation rate is which is about three orders of magnitude lower than in physiological conditions! Also, in this particular case, the typical life time of the non-specific complex is comparable to those observed in Ref. [13].
In this part, we were able to relate our continuous description to observable quantities such as the dissociation rates of the non-specific complex of arbitrary proteins. To apply Kramers theory, we emphasized the fact that the reaction coordinate is a radial coordinate that gives rise to an entropic repulsive force that allows for a non ambiguous definition of the barrier between the bound state and the unbound one. In absence of the mentioned degeneracy however (i.e. in a truly one dimensional case), there is no consensus on where to put the dividing surface for free energies as those of Fig. 15 and one should be careful about this point [89].
Evidently, the next step in exploiting the model described here will be to try to predict the features of the protein diffusion along DNA during sliding, and to compare them with experiments. Note however that, although we can in principle estimate the sliding diffusion coefficient from diffusion properties of the protein in bulk and get an estimate of the typical sliding length () that is measured in many experiments (in vitro but also in vivo, see e.g. [90]), it is in fact more subtle than expected. Indeed, as it was imagined by Schurr [51], some DNA-binding proteins slide with an helical motion along DNA [34, 35]. The resulting effective diffusion coefficient then depends on the DNA-protein distance in the bound state [91, 34, 35] and we have seen that the latter depends on the salt concentration; the sliding diffusion coefficient therefore depends on the salt concentration. This additionally supports a potential need for the change of paradigm that has been stressed throughout this chapter in order to understand fully what are the relevant parameters to describe the observed binding kinetics of proteins to their specific sites on DNA.
References
- [1] A. D. Riggs, S. Bourgeois, and M. Cohn. The lac repressor–operator interaction. 3. kinetic studies. J. Mol. Biol., 53:401–417, 1970.
- [2] P.H. Richter and M. Eigen. Diffusion controlled reaction rates in spheroidal geometry. application to repressor–operator association and membrane bound enzymes. Biophys.Chem., 2:255–263, 1974.
- [3] P. von Hippel and O. Berg. Facilitated target location in biological systems. J. Biol. Chem., 264:675–678, 1989.
- [4] M. Coppey, O. Bénichou, R. Voituriez, and M. Moreau. Kinetics of target site localization of a protein on DNA: A stochastic approach. Biophys. J., 87:1640–1649, 2004.
- [5] S. E. Halford. An end to 40 years of mistakes in dna-protein association kinetics? Biochemical Society trans., 37:343–348, 2009.
- [6] O. G. Berg, R. B. Winter, and P. H. von Hippel. Diffusion driven mechanism of protein translocation on nucleic acids. i. models and theory. Biochemistry, 20:6929, 1981.
- [7] R. B. Winter, O. G. Berg, and P. H. von Hippel. Diffusion driven mechanism of protein translocation on nucleic acids. iii. the E. coli lac repressor–operator interaction: kinetic measurements and conclusions. Biochemistry, 20:6961–6977, 1981.
- [8] B. J. Terry, W. E. Jack, and P. Modrich. Facilitated diffusion during catalysis by ecori endonuclease. nonspecific interactions in ecori catalysis. J. of Biol. Chemistry, 260(24):13130–7, 1985.
- [9] S. E. Halford and J. F. Marko. How do site-specific DNA-binding proteins find their targets? Nucl. Acids Res., 32:3040–3052, 2004.
- [10] N. Shimamoto. One–dimensional diffusion of proteins along DNA. its biological and chemical significance revealed by single–molecule measurements. J. Biol. Chem., 274:15293–15296, 1999.
- [11] P.C. Blainey, A.M. van Oijen, A. Banerjee, G.L. Verdine, and X.S. Xie. A base–excision DNA–repair protein finds intrahelical lesion bases by fast sliding in contact with DNA. Proc. Natl. Acad. Sci. U.S.A., 103:5752–5757, 2006.
- [12] J. Elf, G.W. Li, and X.S. Xie. Probing Transcription Factor Dynamics at the Single–Molecule Level in a Living Cell. . Science, 316:1191 – 1194, 2007.
- [13] I. Bonnet, A. Biebricher, P-L. Porté, C. Loverdo, O. Bénichou, R. Voituriez, C. Escudé, W. Wende, A. Pingoud, and P. Desbiolles. Sliding and Jumping of Single EcoRV Restriction Enzymes on Non–Cognate DNA. Nucleic Acids Research, 36:4118–4127, 2008.
- [14] S. Jones, P. van Heyningen, H.M. Berman, and J.M. Thornton. Protein–DNA interactions: a structural analysis. J. Mol. Biol., 287:877–896, 1999.
- [15] K. Nadassy, S. J. Wodak, and J. Janin. Structural Features of Protein–Nucleic Acid Recognition Sites. Biochemistry, 38:1999 2017, 1999.
- [16] Y. Takeda, P. D. Ross, and C. P. Mudd. Thermodynamics of Cro Protein–DNA Interactions. Proc. Natl. Acad. Sci. USA, 89:8180–8184, 1992.
- [17] P. H. Von Hippel. From simple DNA–protein Interaction to the Macromolecular Machines of Gene Expression. Annu. Rev. Biophys. Biomol. Struct., 36:79–105, 2007.
- [18] H. Viadiu and A. Aggarwal. Structure of BamHI Bound to Nonspecific DNA: A Model for DNA Sliding. Molecular Cell, 5:889, 2000.
- [19] C.G. Kalodimos et al. Structure and Flexibility Adaptation in Nonspecific and Specific Protein–DNA Complexes. Science, 305:386–389, 2004.
- [20] P. Carrivain, A. Cournac, C. Lavelle, A. Lesne, J. Mozziconacci, F. Paillusson, L. Signon, J.-M. Victor, and M. Barbi. Electrostatics of DNA compaction in viruses, bacteria and eukaryotes: functional insights and evolutionary perspective. Soft Matter, 8:9285–9301, 2012.
- [21] M. Barbi, V. Popkov, C. Place, and M. Salerno. A Model of Sequence Dependent Protein Diffusion along DNA. J. of Biol. Physics, 30:203–226, 2004.
- [22] M. Barbi, C. Place, V. Popkov, and M. Salerno. Base–sequence–dependent sliding of proteins on DNA. Phys. Rev. E, 70:041901, 2004.
- [23] M. Slutsky and L. A. Mirny. Kinetics of Protein–DNA Interaction: Facilitated Target Location in Sequence–Dependent Potential. Biophys. J., 87:4021–4035, 2004.
- [24] M. Slusky, M. Kardar, and L. A. Mirny. Diffusion in correlated random potentials, with applications to dna. Phys. Rev. E, 70:049901, 2004.
- [25] V. Dahirel, F. Paillusson, M. Jardat, M. Barbi, and J-M Victor. Nonspecific DNA-protein interaction: Why proteins can diffuse along DNA. Phys. Rev. Lett., 102:228101, 2009.
- [26] F. Paillusson, V. Dahirel, M. Jardat, J-M. Victor, and M. Barbi. Effective interaction between charged nanoparticles and dna. Phys. Chem. Chem. Phys., 13:12603–12613, 2011.
- [27] J. J. Kupiec. A darwinian theory for the origin of cellular differentiation. Mol. Gen. Genet., 255:201–208, 1997.
- [28] G. D. Stormo and D. S. Fields. Specificity, free energy and information content in protein-dna interactions. Trends Biochem Sci., 23:109–113, 1998.
- [29] U. Gerland, J. D. Moroz, and T. Hwa. Physical constraints and functional characteristics of transcription factor-dna interaction. Proc. Natl. Acad. Sci. USA, 99:12015–12020, 2002.
- [30] O.G. Berg and C. Blomberg. Association kinetics with coupled diffusional flows. Biophys. Chem., 4:367–381, 1976.
- [31] O.G. Berg and C. Blomberg. Association kinetics with coupled diffusion. an extension to coiled-chain macromolecules applied to the lac repressor-operator system. Biophys. Chem., 7:33–39, 1977.
- [32] O. G. Berg. On diffusion-controlled dissociation. J. Chem. Phys., 31:47–57, 1978.
- [33] O.G. Berg and C. Blomberg. Association kinetics with coupled diffusion. iii. ionic-strength dependence of the lac repressor-operator association. Biophys. Chem., 8:271?280, 1978.
- [34] P. C. Blainey, G. Luo, S. C. Kou, W. F. Mangel, G. L. Verdine, B. Bagchi, and X. S. Xie. Nonspecifically bound proteins spin while diffusing along dna. Nat. Struct. Mol. Biol., 16:1224–1229, 2009.
- [35] J. Dikić, C. Menges, S. Clarke, M. Kokkinidis, M. Pingoud, W. Wende, and P. Desbiolles. The rotation-coupled sliding of ecorv. Nucleic Acids Res., 40(9):4064–4070, 2012.
- [36] Martin Kampmann. Obstacle bypass in protein motion along DNA by two-dimensional rather than one-dimensional sliding. Journal of Biological Chemistry, 279(37):38715–38720, 2004.
- [37] M. Coppey, O. Bénichou, R. Voituriez, and M. Moreau. Kinetics of target site localization of a protein on DNA: A stochastic approach. BioPhys.J., 87:1640–1649, 2004.
- [38] N. P. Stanford, M. D. Szczelkun, J.F. Marko, and S.E. Halford. One– and three–dimensional pathways for proteins to reach specific DNA sites. EMBO J., 19:6546 – 6557, 2000.
- [39] M. Guthold, X. Zhu, C. Rivetti, G. Yang, N. H. Thomson, S. Kasas, H.G. Hansma, B. Smith, P.K. Hansma, and C. Bustamante. Direct observation of one-dimensional diffusion and transcription by escherichia coli rna polymerase. Biophys. J., 77:2284–2294, 1999.
- [40] Y. Harada et al. Single-molecule imaging of rna polymerase-dna interactions in real time. Biophys. J., 76:709–715, 1999.
- [41] T. Ando, N. Kodera, E. Takai, D. Maruyama, K. Saito, and A. Toda. A high-speed atomic force microscope for studying biological macromolecules. Proc. Natl. Acad. Sci. USA, 98(22):12468–12472, 2001.
- [42] H. Sanchez, Y. Suzuki, M. Yokokawa, K. Takeyasu, and C. Wyman. Protein-dna interactions in high speed afm: single molecule diffusion analysis of human rad54. Integr. Biol., 3:1127–1134, 2011.
- [43] J. L. A. Dubbeldam, A. Milchev, V. G. Rostiashvili, and T. A. Vilgis. Polymer translocation through a nanopore: A showcase of anomalous diffusion. Phys. Rev. E, 76:010801, 2007.
- [44] Y.M. Wang, R.H. Austin, and E.C. Cox. Single molecule measurements of repressor protein 1d diffusion on DNA. Phys. Rev. Lett., 97:048302, 2006.
- [45] J.H. Kim and R.G. Larson. Single –molecule analysis of 1d diffusion and transcrption elongation of T7 rna polymerase along individual stretched DNA molecules. Nuc.Acid Res., 35:3848–3858, 2007.
- [46] A. Tafvizi, F. Huang, J. S. Leith, A. R. Fersht, L. A. Mirny, and A. M. van Oijen. Tumor suppressor p53 slides on DNA with low friction and high stability. Biophys. J., 95(1):L01–L03, 2008.
- [47] J. Gorman and E.C. Greene. Visualizing One–dimensional Diffusion of Proteins along DNA. Nature Structural and Molecular Biology, 15:5752–5757, 2008.
- [48] A. Crut, D. Lasne, J.-F. Allemand, M. Dahan, and P. Desbiolles. Transverse fluctuations of single DNA molecules attached at both extremities to a surface. Phys. Rev. E, 67:051910, 2003.
- [49] D.M. Gowers, G.G. Wilson, and S.E. Halford. Measurement of the Contributions of 1D and 3D Pathways to the Translocation of a Protein along DNA. Proc. Natl. Acad. Sci. U.S.A., 102:15883–15888, 2005.
- [50] M Sheinman, O Bénichou, Y Kafri, and R Voituriez. Classes of fast and specific search mechanisms for proteins on dna. Reports on Progress in Physics, 75(2):026601, 2012.
- [51] J. M. Schurr. The one dimensional diffusion coefficient of protein absorbed on DNA. Biophysical Chemistry, 9:413–414, 1979.
- [52] R. F. Bruinsma. Physics of protein-dna interaction. Physica A, 313:211–237, 2002.
- [53] J. M. T. Cheetham, D. Jeruzalmi, and T. A. Steitz. Structural basis for initiation of transcription from an rna polymerase?promoter complex. Nature, 399, 1999.
- [54] G. Paillard and R. Lavery. Analyzing protein-dna recognition mechanisms. Structure, 12:113–122, 2004.
- [55] N. C. Seeman, J. M. Rosenberg, and A. Rich. Sequence–specific recognition of double helical nucleic acids by proteins. Proc. Natl. Acad. Sci. USA, 73:804, 1976.
- [56] D. Tareste, F. Pincet, E. Perez, S. Rickling, C. Mioskowski, and L. Lebeau. Energy of Hydrogen Bonds Probed by the Adhesion of Functionalized Lipid Layers. Biophys. J., 83:3675–3681, 2002.
- [57] R. Swanzig. Diffusion in a rough potential. Proc. Natl. Acad. Sci. USA, 85:2029, 1988.
- [58] L. Mirny, M. Slutsky, Z. Wunderlich, A. Tafvizi, J. Leith, and A. Kosmrlj. How a protein searches for its site on dna: the mechanism of facilitated diffusion. Journal of Physics A: Mathematical and Theoretical, 42(43):434013, 2009.
- [59] R. Murugan. Theory of site-specific dna-protein interactions in the presence of conformational fluctuations of DNA binding domains. Biophysical Journal, 99(2):353 – 359, 2010.
- [60] H.-X. Zhou. Rapid search for specific sites on DNA through conformational switch of nonspecifically bound proteins. Proceedings of the National Academy of Sciences, 2011.
- [61] R.S. Spolar and M.T. Record Jr. Coupling of Local Folding to Site–Specific Binding of Proteins to DNA. Science, 263:777, 1994.
- [62] M. Y. Azbel. Random two–component one–dimensional ising model for heteropolymer melting. Phys. Rev. Lett., 31:589, 1973.
- [63] F. Paillusson, M. Barbi, and J-M Victor. Poisson-Boltzmann for Oppositely Charged Bodies: an Explicit Derivation. J. Chem. Phys., 107:1379–1391, 2009.
- [64] S Cocco, J. F. Marko, and R. Monasson. Theoretical models for single-molecule DNA and rna experiments: from elasticity to unzipping. Comptes Rendus Physique, 3(5):569–584, 2002.
- [65] E. W. Stawiski, Gregoret; L. M., and Y. Mandel-Gutfreund. Annotating nucleic acid-binding function based on protein structure. Journal of Molecular Biology, 326(4):1065 – 1079, 2003.
- [66] S. Jones, H.P. Shanahan, H.M. Berman, and J.M. Thornton. Using electrostatic potentials to predict DNA–binding sites on DNA–binding proteins. Nucleic Acids Research, 31:7189–7198, 2003.
- [67] S. Ahmad and A. Sarai. Moment-based prediction of dna-binding proteins. Journal of Molecular Biology, 341(1):65 – 71, 2004.
- [68] A Szilágyi and J. Skolnick. Efficient prediction of nucleic acid binding function from low-resolution protein structures. Journal of Molecular Biology, 358(3):922 – 933, 2006.
- [69] J.-P. Hansen and H. Löwen. Effective Interactions Between Electric Double Layers. Annu. Rev. Phys. Chem., 51:209, 2000.
- [70] V. Dahirel, M. Jardat, J.-F. Dufrêche, and P. Turq. How the Excluded Volume Architecture Influences Ion–Mediated Forces Between Proteins. Phys. Rev. E, 76:040902, 2007.
- [71] V. Dahirel, M. Jardat, J.-F. Dufrêche, and P. Turq. Toward the Description of Electrostatic Interactions Between Globular Proteins: Potential of Mean Force in the Primitive Model. J. Chem. Phys., 127:095101, 2007.
- [72] V. A. Parsegian and D. Gingel. On the electrostatic interaction across a salt solution between two bodies bearing unequal charges. Biophys.J., 12:1192–1204, 1972.
- [73] H. Ohshima. Diffuse double layer interaction between two parallel plates with constant surface charge density in an electrolyte solution III: Potential energy of double layer interaction. Colloid and Polymer Sci., 253:150–157, 1975.
- [74] A. W-C. Lau. Fluctuation and correlation effects in electrostatics of charged membranes, 2000.
- [75] D. Ben-Yaakov, Y. Burak, D. Andelman, and S. A. Safran. Elecrostatic Interactions of Asymmetrically Charged Membranes. Europhys. Lett., 79:48002–8, 2007.
- [76] M. N. Tamashiro and H. Schiessel. Where the linearized poisson-boltzmann cell model fails: The planar case as a prototype study. Phys. Rev. E, 68:066106, 2003.
- [77] H. Ohshima. Diffuse Double Layer Interaction Between Two Parallel Plates with Constant Surface Charge Density in an Electrolyte Solution III: Potential Energy of Double Layer Interaction. Colloid and Polymer Sci., 253:150–157, 1975.
- [78] D. Ben-Yaakov, Y. Burak, D. Andelman, and S. A. Safran. Elecrostatic Interactions of Asymmetrically Charged Membranes. Europhys. Lett., 79:48002, 2007.
- [79] Y.K. Kang. Which functional form is appropriate for hydrogen bond of amides? J.Phys.Chem.B, 104:8321–8326, 2000.
- [80] Y. Chen, T. Kortemme, T. Robertson, D. Baker, and G. Varani. A New Hydrogen–Bonding Potential for the Design of Protein–RNA Interactions Predicts Specific Contacts and Discriminates Decoys. Nucl. Acids Res., 32:5147–5162, 2004.
- [81] A-M. Florescu and M. Joyeux. Description of nonspecific dna-protein interaction and facilitated diffusion with a dynamical model. JCP, 130:015103, 2009.
- [82] A-M. Florescu and M. Joyeux. Dynamical model of dna-protein interaction: Effect of protein charge distribution and mechanical properties. JCP, 131:105102, 2009.
- [83] O. Givaty and Y. Levy. Protein sliding along dna: dynamics and structural characterization. J Mol Biol., 385:1087–97, 2009.
- [84] B. A. Shoemaker, J. J. Portman, and P. G. Wolynes. Speeding molecular recognition by using the folding funnel: The fly-casting mechanism. Proc. Natl. Acad. Sci. USA, 97(16):8868–8873, 2000.
- [85] B. Bouvier and R. Lavery. A free energy pathway for the interaction of the sry protein with its binding site on DNA from atomistic simulations. J. Am. Chem. Soc., 131:9864–9865, 2009.
- [86] C. Chen and B. M. Pettitt. The binding process of a nonspecific enzyme with dna. Biophysical Journal, 101(5):1139 – 1147, 2011.
- [87] K. Zakrzewska and R. Lavery. Towards a molecular view of transcriptional control. Current Opinion in Structural Biology, 22(2):160–167, 2012.
- [88] B.J. Berne, M. Borkovec, and J.E. Straub. Classical and modern methods in reaction rate theory. J. Phys. Chem., 92:3711–3725, 1988.
- [89] P. Hänggi, P. Talkner, and M. Borkovec. Reaction-rate theory: fifty years after kramers. Rev.Mod.Phys., 62:251–341, 1990.
- [90] P. Hammar, P. Leroy, A. Mahmutovic, E.G. Marklund, O. G. Berg, and J. Elf. The lac repressor displays facilitated diffusion in living cells. Science, 336:1595–1598, 2012.
- [91] B. Bagchi, P.C. Blainey, and X.S. Xie. Diffusion constant of a nonspecifically bound protein undergoing curvilinear motion along dna. J.Chem.Phys.B, 112:6282–6284, 2008.
Figure legend
(a small reproduction of the figure is added for clearness)