First X-ray observations of Low-Power Compact Steep Spectrum Sources
Abstract
We report first X-ray Chandra observations of a sample of seven low luminosity compact (LLC) sources. They belong to a class of young compact steep spectrum (CSS) radio sources. Four of them have been detected, the other three have upper limit estimations for X-ray flux, one CSS galaxy is associated with an X-ray cluster. We have used the new observations together with the observational data for known strong CSS and gigahertz-peaked spectrum (GPS) objects and large scale FR Is and FR IIs to study the relation between morphology, X-ray properties and excitation modes in radio-loud AGNs. We found that: (1) The low power objects fit well to the already established X-ray - radio luminosity correlation for AGNs and occupy the space among, weaker in the X-rays, FR I objects. (2) The high excitation galaxies (HEG) and low excitation galaxies (LEG) occupy distinct locus in the radio/X-ray luminosity plane, notwithstanding their evolutionary stage. This is in agreement with the postulated different origin of the X-ray emission in these two group of objects. (3) We have tested the AGN evolution models by comparing the radio/X-ray luminosity ratio with the size of the sources, and indirectly, with their age. We conclude that the division for two different X-ray emission modes, namely originate in the base of the relativistic jet (FR Is) or in the accretion disk (FR IIs) is already present among the younger compact AGNs. (4) Finally, we found that the CSS sources are less obscured than the more compact GPSs in X-rays. However, the anti-correlation between X-ray column density and radio size does not hold for the whole sample of GPS and CSS objects.
Keywords:
galaxies-active, galaxies-evolution, X-rays-galaxies1 Introduction
We still know little about how radio galaxies are born and how they subsequently evolve, but it is generally accepted that the GHz Peaked Spectrum (GPS) and Compact Steep Spectrum (CSS) radio sources are young, smaller versions of the large-scale powerful radio sources (O’Dea et al., 1991; Fanti et al., 1990; Fanti et al., 1995; Readhead et al., 1996a; O’Dea & Baum, 1997). Recently, the High Frequency Peakers have been added to the sequence, as possible progenitors of GPS sources (e.g., Orienti et al., 2007, and references therein).
The GPS and CSS sources are powerful but compact radio sources whose spectra are generally simple and convex with peaks near 1 GHz and 100 MHz respectively. The GPS sources are contained within the extent of the optical narrow emission line region ( kpc) while the CSS sources are contained within the host galaxy ( kpc, see O’Dea, 1998, for a review).
In the general scenario of the evolution of powerful radio-loud AGNs, GPS sources evolve into CSS sources and these into supergalactic-size FR I or FR II objects (Fanaroff &Riley, 1974). The dynamic evolution of the double-lobed radio sources, characterized by the total extent of the source, advance speed of the hotspots and the dependence of the density distribution of the interstellar and intergalactic medium along the way of the propagating jets and lobes, predicts the increase of the radio power with the linear size of the source in the GPS and CSS phase until they reach the 1-3 kpc size. Then the larger CSS objects should start to slowly decrease their luminosity but the sharp radio power decrease is visible only in the FR I and FR II phase of evolution (Begelman & Cioffi, 1989; De Young, 1993; Carvalho, 1994; Fanti et al., 1995; Begelman, 1996; De Young, 1997; Kaiser & Alexander, 1997b; Carvalho, 1998; Snellen et al., 2000; Kino & Kawakatu, 2005; Kawakatu & Kino, 2006; Kaiser & Best, 2007; Kawakatu et al., 2009a). Finally, after the cut off of the material supply to the central engine of the galaxy, the sources begin their fading phase. They can come back on the main evolutionary sequence after the re-ignition of the radio activity (Kozieł-Wierzbowska et al., 2012; Konar et al., 2012, e.g., ).
| Source | RA(J2000) | Dec (J2000) | ID | z | Counts | F0.5-2keV | F2-10keV | NH,Gal | NH | Chandra | |
|---|---|---|---|---|---|---|---|---|---|---|---|
| () | () | Obs ID | |||||||||
| 0810+077 | 08:13:23.76 | 07:34:05.80 | Q | 0.112 | 119 (11) | 32 | 190 | 2.14 | 13 | 0.64 | 12716 |
| 0907+049 | 09:09:51.13 | 04:44:22.13 | G | 0.640p | 3a | 2.5 | 4.6 | 1.41 | 1.7b | 12717 | |
| 0942+355 | 09:45:25.89 | 35:21:03.50 | G | 0.208 | 103 (10) | 32 | 66 | 3.55 | 23 | 1.6 | 12714 |
| 1321+045 | 13:24:19.70 | 04:19:07.20 | G | 0.263 | 53 (7) | 14 | 9.4 | 2.04 | 2.35 | 12715 | |
| 1542+390 | 15:43:49.49 | 38:56:01.40 | G | 0.553 | 0a | 2.5 | 4.6 | 1.55 | 1.7b | 12718 | |
| 1558+536 | 15:59:27.66 | 53:30:54.70 | G | 0.179 | 9 (3) | 2.8 | 5.2 | 1.26 | 1.7b | 12719 | |
| 1624+049 | 16:26:50.30 | 04:48:50.50 | G | 0.040p | 4a | 1.2 | 2.6 | 5.01 | 1.7b | 12720 |
a means no detection, only upper limit for flux.
b means =1.7 was assumed for the flux calculation.


However, population studies have drawn attention to the existence of far too many compact sources compared to the number of large-scale objects (O’Dea & Baum, 1997). It has been proposed then that some of the young radio-loud AGNs, namely the GPS and CSS sources, can be short-lived objects (Reynolds & Begelman, 1997; Czerny et al., 2009; Kawakatu et al., 2009b; Kunert-Bajraszewska et al., 2010) and that not one but a few evolutionary paths exist (Marecki et al., 2003; Kunert-Bajraszewska et al., 2010; An & Baan, 2012). Detection of several candidates for dying compact sources (Giroletti et al., 2005; Kunert-Bajraszewska et al., 2006; Kunert-Bajraszewska et al., 2010; Orienti et al., 2010) supports this view. The determining factors for the further evolution of compact radio objects could occur at sub-galactic (or even nuclear) scales, or they could be related to the radio jet-ISM interactions and evolution. Our previous studies suggest that the evolutionary track could be related to the interaction, strength of the radio source, and excitation levels of the ionized gas (Kunert-Bajraszewska et al., 2010; Kunert-Bajraszewska & Labiano, 2010), instead of the radio morphology of the young radio source.
The characteristics (size, radio power and young age) of GPS and CSS sources make them excellent probes of interaction (and therefore evolution) of radio sources. Furthermore, they have not completely broken through the ISM, so these interactions are expected to be more important than in the larger sources. Observations of UV, HI and, especially, of the ionized gas in GPS and CSS sources suggest the presence of such interactions (Labiano, 2008a; Labiano et al., 2008b; Holt et al., 2006; Labiano et al., 2005; Axon et al., 2000; de Vries et al., 1999; de Vries et al., 1997; Gelderman & Whittle, 1994).
Additional clues on the evolution of compact GPS and CSS sources may come from the X-ray band, but still little is known about the nature of the X-ray emission in these young sources. Theoretical models predict strong X-ray emission from young radio sources, due to the recent triggering of the nuclear activity and/or the expansion through the ISM (e.g., Siemiginowska et al., 2012; Siemiginowska, 2009, and references therein). The Chandra and XMM-Newton observations of GPS and CSS objects made so far have focused on sources with high radio emission (Siemiginowska et al., 2008; Vink et al., 2006; Guainazzi et al., 2004; Guainazzi et al., 2006; Tengstrand et al., 2009, e.g., ). These sources, when included in the L2-10 keV versus L5GHz diagram, group in the region occupied by powerful FR II sources (Tengstrand et al., 2009). Therefore, the location of GPS and CSS sources in the radio to X-ray luminosity diagram is consistent with them being powered by accretion, and therefore evolving onto a track of constant X-ray, accretion-driven luminosity to FR IIs, as well as with the correlation between radio and X-ray luminosity observed in FR Is, which would point to a common origin for the emission in these two bands.
In this paper, we present the first X-ray observations of low power radio sources, starting to fill the gap in the L2-10 keV versus L5GHz diagram, and shedding some light on the origin of high-energy emission of young radio sources and their evolution.
2 The sample
The current sample consists of 7 sources (0810+077, 0907+049, 0942+355, 1321+045, 1542-390, 1558+536, 1624+049) taken from the Low Luminosity Compact sources sample (Kunert-Bajraszewska & Thomasson, 2009; Kunert-Bajraszewska et al., 2010, LLC, ). The LLC consists of 44 nearby (z0.9) sources, selected from the final release of FIRST (White et al., 1997), and the GB6 (Gregory et al., 1996) and SDSS surveys, and observed with MERLIN at L-band and C-band. The main selection criterion for the LLC was the luminosity limit: L erg s-1. The radio and optical properties of the LLC were discussed and analyzed in Kunert-Bajraszewska et al. (2010) and Kunert-Bajraszewska & Labiano (2010) respectively.
The 7 current sources form the so called pilot sample and were selected to represent different stages of the radio source evolution within the ISM: weak or undetected radio core and strong lobes or breaking up radio lobes with bright radio core, and linear sizes ranging from 2 to 17 kpc .
3 X-ray observations and data reduction
The sample was observed using Chandra ACIS-S3 with 1/8 subarray and standard pointings, with exposure times of 9500 seconds (see Table 1). The Chandra data were reduced using CIAO 4.5 (Fruscione et al., 2006) with the calibration files from CALDB 4.4.5. All our sources are contained within the FWHM of the PSF. We used a circular extraction region for each source, with radius , which also contains all the radio emission. The background regions consist of four circular regions of radius 10 around the source. The CIAO default tools were used to extract the spectra and associated rmf and arf files. The total counts detected for each source are listed in Table 1.
We used Sherpa (Freeman et al., 2001) to fit the spectra, using an absorbed power-law in the 0.5-7 keV energy range:
| (1) |
where N(E) is in photons cm-2 s-1, A is the normalization at 1 keV, is the photon index of the power law, (E) and [E(1+ zobs)] are the absorption cross-sections (Morrison & McCammon, 1983; Wilms et al., 2000), and N and N are the column densities of the Milky Way (Kalberla et al., 2005; Dickey & Lockman, 1990) and the source. The Galactic absorption was kept constant during fitting. The second absorption component is assumed to be intrinsic to the quasar and located at the redshift of the source. The model was applied to all sources. However, 0907+049, 1558+536 and 1624+049 do not have enough counts to produce a reasonable fit. The results are summarized in Table 1.
We use H0=71, (Spergel et al., 2003) throughout the paper.
| Source | log L2-10keV | log L5GHz | log L[OIII] | Spectral |
|---|---|---|---|---|
| type | ||||
| 0810+077 | 42.8 | 41.4 | 40.8 | LEG |
| 0907+049 | 42.9 | 42.6 | 42.2 | – |
| 0942+355 | 42.9 | 41.4 | 42.0 | HEG |
| 1321+045 | 42.3 | 41.6 | 40.3 | LEG |
| 1542+390 | 42.7 | 42.4 | 41.9 | HEG |
| 1558+536 | 41.7 | 41.4 | 40.8 | LEG |
| 1624+049 | 40.0 | 40.0 | – | – |
Luminosities in erg s-1. Limits are 3. Spectral type and radio morphology according to Kunert-Bajraszewska et al. (2010); Kunert-Bajraszewska & Labiano (2010).
| Source | Distance | Log NHβ | Log NNuc | NNuc/NHβ |
|---|---|---|---|---|
| 0810+077 | 513.6 | 52.7 | 54.7 | 100.0 |
| 0942+355 | 1014.3 | 53.5 | 55.3 | 63.0 |
| 1321+045 | 1323.9 | 53.0 | 55.1 | 126.0 |
Source name, luminosity distance in Mpc, NHβ - number of photons/s needed to ionize Hβ, NNuc - number of ionizing photons/s produced by the nucleus, and the ratio between the last two. If the ratio is 1, the nucleus is producing enough photons to ionize Hβ, if the ratio is lower than one, another source of ionization, such as shocks, is required.
4 Discussion
4.1 The X-ray and radio morphology
We have observed a pilot sample of Low Luminosity Compact (LLC) sources (7 out of 44 objects) with Chandra. Four of them have been detected, the other three have upper limit estimations for X-ray flux (see Table 1). One of the objects, 1321+045, appeared to be associated with an X-ray cluster and has been discussed in a separate paper (Kunert-Bajraszewska et al., 2013). The Chandra ACIS-S images of two of the sources discussed here with the largest number of X-ray photons are shown in Fig. 1. We also overlayed the radio MERLIN 1.6 GHz contours on the X-ray emission with the indications of radio components.
0810+077 is a quasar classified as LEG. Its radio morphology consist of three components: the weak central one (C) and two jets/lobes (E and W). The optical counterpart is coincident with the component C and we suggested this could be a radio core (Kunert-Bajraszewska et al., 2010). However, this is based on observations at only one radio frequency so it should be treated as tentative. The brightest part of the X-ray emission lies between the components C and W. The potential offset between the centroid of the X-ray emission and component C or W can be consistent with the astrometric uncertainty of Chandra.
0942+355 is a galaxy classified as HEG, larger than 0810+077 and with more complex radio structure. Its 1.6 GHz asymmetric radio morphology consist of three components: weak radio core (C) and two lobes (E and W). There are also 5 GHz observations of this source (Kunert-Bajraszewska et al., 2010) showing only emission from the south-eastern radio lobe. In the case of 0942+355 the brightest part of the X-ray source is right in the center of the source, between the two jets.
1558+536 is a galaxy classified as LEG with diffuse, double-like morphology (Kunert-Bajraszewska et al., 2010). Only nine counts were detected in Chandra observations of this source and we did not produced an image of it.
The radio and optical properties of the whole sample of LLC sources have been discussed and analyzed by us (Kunert-Bajraszewska et al., 2010; Kunert-Bajraszewska & Labiano, 2010). We suggested that they can represent a population of short-lived objects and undergo the CSS phase of activity many times before they become large scale FR I or FR II (Kunert-Bajraszewska et al., 2010; Kunert-Bajraszewska & Labiano, 2010). What is more, the evolution of the radio source seems to be independent from its radio morphology but rather determined by the properties of the central engine: strength, accretion mode, excitation level of the ionized gas. In some objects the surrounding environment could be also an important factor influencing the evolution (Cegłowski et al., 2013).
Optically many of the LLC sources belong to the class of low excitation galaxies (LEGs), which are thought to be powered by the accretion of hot gas (Hardcastle et al., 2007; Buttiglione et al., 2010) and can be progenitors of large scale LEGs (Kunert-Bajraszewska & Labiano, 2010).
4.2 The optical-line emission
Labiano (2008a) found that compact AGNs show a strong correlation between [O III]5007 line luminosity and size of the radio source suggesting a possible deceleration in the jet as it crosses the host ISM. However this correlation breaks up when including LLC sources, more specifically the compact LEGs (Kunert-Bajraszewska & Labiano, 2010). As we have already shown in the optical analysis of the whole sample of LLC sources the LLC HEGs show a times higher [O III] 5007 luminosities than LLC LEGs. This could be caused by a stronger jet contribution to the ionization of the ISM in HEGs and/or indicates differences in the environment of HEG and LEG objects.
In the pilot sample of LLC sources observed with Chandra we have found that two sources, 0810+077 and 0942+355, have the same radio and X-ray luminosities (Table 2). However, 0942+355 (HEG) has higher [OIII] emission than 0810+077 (LEG). If we compare the OII/OIII y OIII/Hb of the detections with photoionization and shock models (Allen et al., 2008, MAPPINGS,), 0810+077 is consistent with 100% photoionization and 0942+355 with 80% photoionization and 20% shocks (Kunert-Bajraszewska & Labiano, 2010).
4.3 Can the central AGN power the emission line luminosity in the extended nebulae?
We compared the number of ionizing photons produced by the nucleus of the source, with the number of photons needed to produce the observed emission line luminosity (Wilson et al., 1988; Baum & Heckman, 1989; Axon et al., 2000; O’Dea et al., 2000, see e.g.). Assuming radiative recombination under case B conditions, the number of ionizing photons/s, , needed to produce the observed H luminosity is:
| (2) |
We use the integrated [OIII] fluxes from Kunert-Bajraszewska & Labiano (2010) and scale using the typical ratio for the narrow line components in CSS sources (Gelderman & Whittle, 1994, e.g.): .
The number of photons/s in the continuum, between frequencies and is given by:
| (3) |
where D is the luminosity distance, the flux density spectrum is given by
(O’Dea et al., 2000, we adopt =1, e.g. ) and h is Planck’s constant. We are only
interested in the photons with enough energy to ionize Hydrogen, i.e. those between
= 3.3x10¹⁵Hz (912Å or 13.6eV) and = 4.8x10¹⁷Hz (2 keV).
For our spectral index, =1, higher frequencies do not add a significant number
of photons. Note that this analysis is subject to the caveat that the continuum emission
may not be emitted isotropically, and the extended nebulae may see a different luminosity
than we do (Penston et al., 1990, e.g.)
The results are shown in Table 3. We find that the nucleus apparently produces enough ionizing photons to power the emission line luminosity in 0810+077 and 0942+355. This is consistent with the results from the comparison with the BPT diagrams and MAPPINGS models (Kunert-Bajraszewska & Labiano, 2010; Allen et al., 2008).
4.4 Radio/X-ray correlations
The Chandra and XMM-Newton studies of GPS/CSS sources performed so far show they are strong X-ray emitters (Guainazzi et al., 2004; Guainazzi et al., 2006; Vink et al., 2006; Siemiginowska et al., 2008; Tengstrand et al., 2009). The X-ray emission of CSS and GPS objects is probably a result of a recent triggering of the nuclear activity and can be characterized by an absorbed power law model with high () column densities (Guainazzi et al., 2006; Vink et al., 2006; Siemiginowska et al., 2008; Tengstrand et al., 2009). But there are also several detections of X-ray morphology in these compact objects. Extended hot 0.5-1 keV interstellar medium (ISM) has been detected in the case of two CSS sources, 3C303.1 (O’Dea et al., 2006) and 3C305 (Massaro et al., 2009), and it is interpreted as shock-heated environment gas. The X-ray jets in GPS sources and large scale X-ray emission associated with some of them have been reported by (Siemiginowska et al., 2008). These objects are classified as ’GPS sources with extended emission’ and discussed in the frame of the theory of intermittent radio activity (Stanghellini et al., 2005). However, the radio structures of GPS and CSS sources are much smaller than the spatial resolution of the current X-ray instruments in most cases, what prevents us from identification of the origin of their X-ray emission. There are several theoretical predictions of X-ray emission from evolving radio sources: i) as thermal emission emitted by the ISM of the host galaxy shock heated by the expanding radio structure (Heinz et al., 1998; O’Dea et al., 2006), or ii) that produced in the accretion disk’s hot corona (Guainazzi et al., 2004; Guainazzi et al., 2006; Vink et al., 2006; Siemiginowska et al., 2008), and finally iii) as non-thermal radiation produced through IC scattering of the local thermal radiation fields off the lobe electron population (Stawarz et al., 2008; Ostorero et al., 2010) or by mini shells (Kino et al., 2013). Tengstrand et al. (2009) show that the radio versus X-ray luminosity plane can be a useful tool to derive constraints on the evolution of compact radio sources. Studies of compact radio AGN so far have been biased towards high-luminosity objects ( erg s-1). In this Section we extend these studies to the low-luminosity regime that our pilot Chandra study probes for the first time.
Our goal is to compare the X-ray properties of different groups of radio objects, GPS, CSS and large-scale FR I and FR II sources as well as the X-ray properties of low and high power compact AGNs. For this purpose we have built the control sample of GPS/CSS sources (Siemiginowska et al., 2008; Tengstrand et al., 2009; Massaro et al., 2010; Massaro et al., 2012) and FR I and FR II objects (Sambruna et al., 1999; Donato et al., 2004; Grandi et al., 2006; Evans et al., 2006; Balmaverde et al., 2006; Belsole et al., 2006; Hardcastle et al., 2006; Massaro et al., 2010; Massaro et al., 2012) from results recently published in the literature. Our pilot sample of low luminosity CSS sources consist of only seven objects. That is why we have also included in it the low luminosity 3C305 described by Massaro et al. (2009). The total number of GPS/CSS sources is 40 objects, and FR I and FR IIs - 34 and 85 sources, respectively. The samples are, however, biased in terms of their redshift distribution. The GPS/CSS and FR II samples are well matched in the redshift, but the FR Is are generally at lower redshift. There are 6 GPS/CSS objects with redshift in the range . All other sources from all groups have redshit .
For all plots presented in this paper we have used the total radio and X-ray luminosity in case of all group of sources. The reason for that is a lack of information of radio core fluxes of most of our compact GPS and CSS sources. Among the seven low power CSS objects only two have 5 GHz observations but without core detection (Kunert-Bajraszewska et al., 2010). Significant part of our sample of GPS/CSS sources is also unresolved in X-rays. The exceptions from the above-stated rule are a few GPS sources with extended structures (Stanghellini et al., 2005). In the case of them the radio and X-rays values used in this paper refers to their milliarcseconds VLBA structures as reported in Tengstrand et al. (2009) and Siemiginowska et al. (2008).
4.4.1 Radio/X-ray luminosity plane
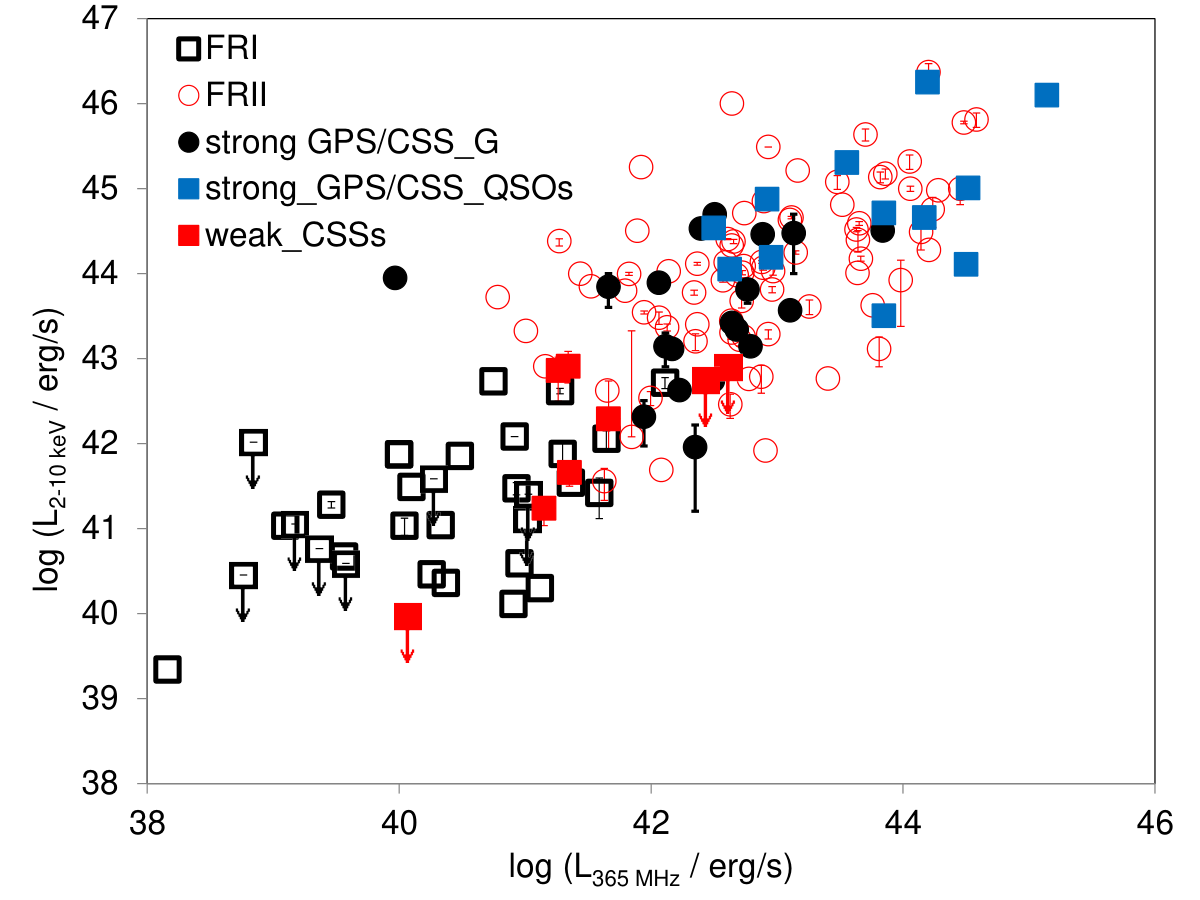
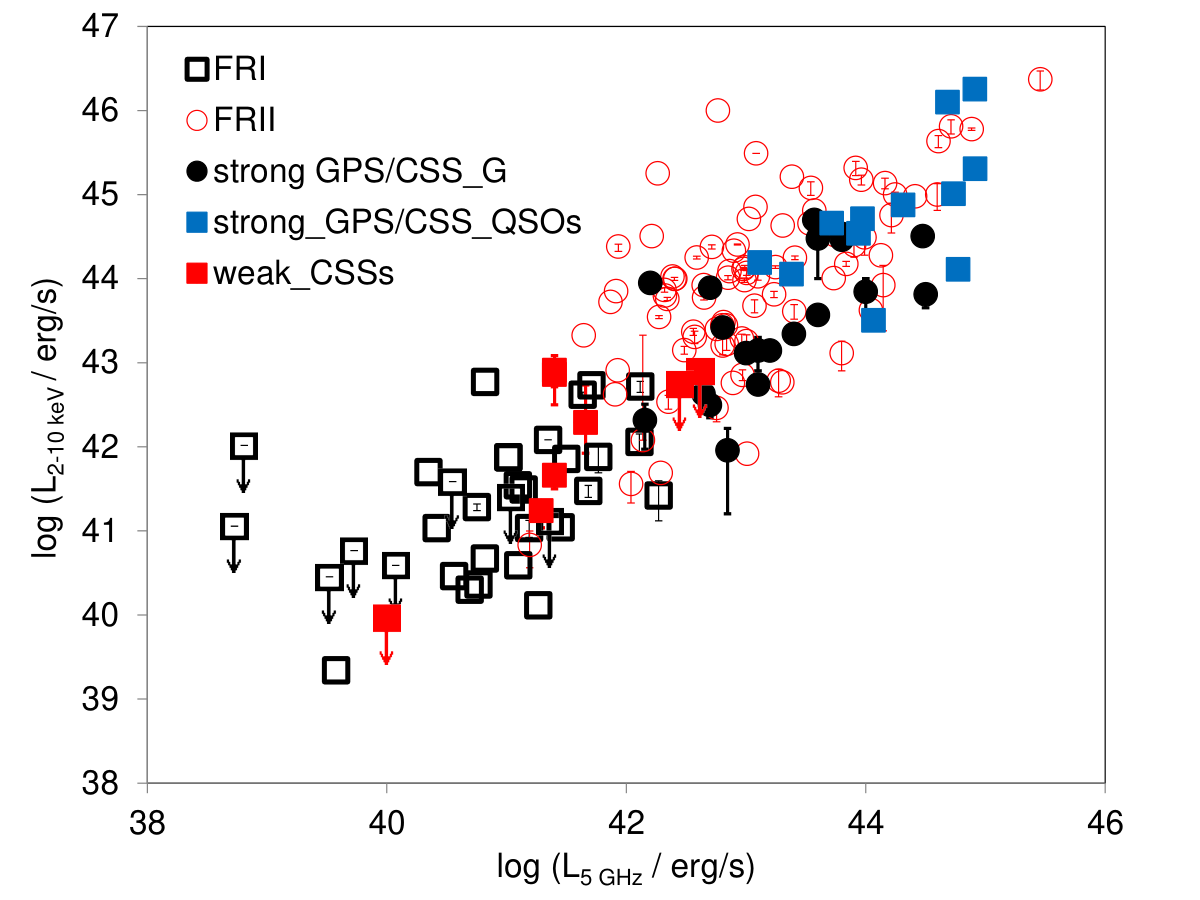
We have compared the X-ray luminosity of the sources from the pilot sample with their radio properties at 5 GHz and 365 MHz (Fig. 2). We have included also the control sample of GPS/CSS and FR I and FR II objects as described above.
The low power objects fit well to the already established X-ray - radio luminosity correlation for AGNs and occupy the space among, weaker in the X-rays, FR I objects. This trend is visible on both plots, X-ray vs. 356 MHz and 5 GHz (Fig.2), and is independent of radio frequency. However, the 356 MHz radio luminosity versus X-ray luminosity plot shows larger scatter among observable data than in the case of 5 GHz luminosity. This is caused by the fact that the X-ray emission is mostly associated with the compact central regions of AGNs while the low frequency flux density is dominated by the extended radio structures. As has been also shown by Hardcastle et al. (1999) much of the dispersion in 5 GHz luminosity originate in beaming. Future X-ray observations of the whole sample of LLC sources would give us a definitive information about their place on the radio/X-ray luminosity plane.
| Sample | N | r-Pearson | Linear Regression | |
|---|---|---|---|---|
| coefficient | Slope | Intercept | ||
| HEG | 82 | 0.68 | ||
| LEG | 38 | 0.78 | ||
We have then plotted all groups of AGNs on the 5 GHz/X-ray luminosity plane (Fig. 3) with a division for high excitation galaxies (HEG) and low excitation galaxies (LEG). We took the optical identification from Buttiglione et al. (2010) in the case of FR I and FR II and indicated them as LEG and HEG/BLO. According to Buttiglione et al. (2010) the broad line objects (BLO) can be considered as members of the HEG class. Identifications of GPS/CSS objects were taken from (Kunert-Bajraszewska & Labiano, 2010) (see also Table 2 in this paper) and Table A1. We have only four LEGs among the GPS/CSS class and actually all of them have been classified as CSS sources. HEGs are found among strong GPS and CSS objects. The HEG/LEG plot confirms what we have previously found in Kunert-Bajraszewska & Labiano (2010). The HEG and LEG AGNs group in two different parts of the plot.
A Pearson correlation analysis applied to both sub-samples revealed a significant X-ray/radio correlation (Table 4). In the radio versus X-ray luminosity plane (Fig. 2), objects with a different morphology are aligned along the same correlation, with an increasing fraction of large-scale FR II morphologies at higher luminosities. Compact sources are well aligned along this correlation, with weak CSS (strong CSS/GPS) closer to the parameter space occupied by FR I (FR II). However, the ionization mechanism seems to discriminate more neatly radio sources in this plane. Low versus high ionization sources occupy distinct locus in this plane, notwithstanding their evolutionary stage. This evidence agrees with a scenario whereby the X-ray emission in large-scale HEG sources is dominated by spectral components due to (obscured) accretion as opposed to LEG objects where the X-ray emission should be dominated by non-thermal synchrotron jets (Hardcastle et al., 2009; Antonucci, 2012; Son at al., 2012). As seen on the radio/X-ray luminosity diagram (Fig. 3), there are two branches, each being driven by different excitation mode and each containing compact sources. The FR morphology, as well as the GPS and CSS division, seems to be independent on the excitation modes (Buttiglione et al., 2010; Kunert-Bajraszewska & Labiano, 2010; Gendre et al., 2013).
4.4.2 Radio/X-ray luminosity ratio
Another test for the AGN evolution models is a comparison of radio to the X-ray luminosity ratio with the size of the sources, and indirectly, with their age (Fig. 4). The long-term evolution of extragalactic radio sources have been investigated by a number of authors in different ways: i) as a variation of the radio power versus the total linear size (O’Dea & Baum, 1997; Kunert-Bajraszewska et al., 2010; An & Baan, 2012), or ii) dynamic evolution of FR II-like double radio sources characterized by the advance speed of the hot spots, total extent of the source and depending on the density distribution in the host galaxy along the path of the jets and lobes (Begelman & Cioffi, 1989; Begelman, 1996; Fanti et al., 1995; Kaiser & Alexander, 1997b; Kino & Kawakatu, 2005; Kawakatu & Kino, 2006; Kaiser & Best, 2007; Kawakatu et al., 2009a). The radio luminosity of the sources evolves through phases governed by the dominant energy-loss mechanism of the radiating, relativistic electrons. From the onset of the radio activity, the GPS/Compact Symmetric Object (CSO) stage, the radio power of the sources increases with time and the source size. The increase rate of radio power diminishes in the transition region (1-3 kpc from the center of the host galaxy) where the balance between adiabatic losses and synchrotron losses have been achieved. After this short period the radio power of CSS sources starts to slowly decreases with the source size. The sharp decrease in the radio power versus the total extent of the source occurs only in the large FR I and FR II objects with the FR Is being below the luminosity threshold, W H , on the radio power/linear size plane. If the X-ray emission in radio-loud AGNs is due to accretion only, the evolution of the radio and X-ray wavebands could be totally decoupled and the radio/X-ray luminosity ratio should reproduced the radio power evolution with the linear size of the source. The Fig. 4 shows that the above assumption is not true not only in the case of large FR Is and FR IIs but probably also in the case of young GPS and CCS sources. The less radio powerful FR Is have the radio/X-ray luminosity ratio higher than many FR IIs what may imply higher X-ray luminosity decrease with radio power in FR Is than FR IIs. This can be explained by the idea that the X-ray emission in FR Is originates from the base of a relativistic jet (Evans et al., 2006) and are thought to be synchrotron emission (Sambruna et al., 2004; Worrall et al., 2009). However, the X-ray emission of the FR IIs comes mostly from the obscured X-ray component probably associated with the accretion and in less part from the relativistic jet produced in an inverse Compton process (Balmaverde et al., 2006; Belsole et al., 2006; Evans et al., 2006). When incorporating a different division among large scale objects we notice that, on average, the low excitation radio galaxies (LERG) and narrow line radio galaxies (NLRG) have higher radio to X-ray luminosity ratio than quasars (Q) and broad line radio galaxies (BLRG). According to Hardcastle et al. (2009) the common correlation of FR II NLRGs, LERGs and FR Is indicates that the X-ray and radio emission comes from the same jet-related component. The interpretation of the place of GPS and CSS sources on the radio/X-ray luminosity ratio versus linear size plane is even more difficult because of the large scatter of the observable values. As we have already mentioned the beaming can disrupt the radio/X-ray correlations. However, at least in the case of compact steep spectrum objects this effect should be small (Wu et al., 2013). We then suggest that what we observe in the group of young GPS and CSS sources is a mix of two different types of X-ray/radio relation. We conclude that at some radio power level the compact AGNs starts to resemble the FR Is, where the X-ray emission is a synchrotron type associated with the jet. It has been already proposed by the SED modelling of two strong CSS objects that their X-ray emission can be a sum of X-ray emission from the accretion disk and non-thermal X-ray emission from the parsec scale radio jet (Kunert-Bajraszewska et al., 2009; Migliori et al., 2012).
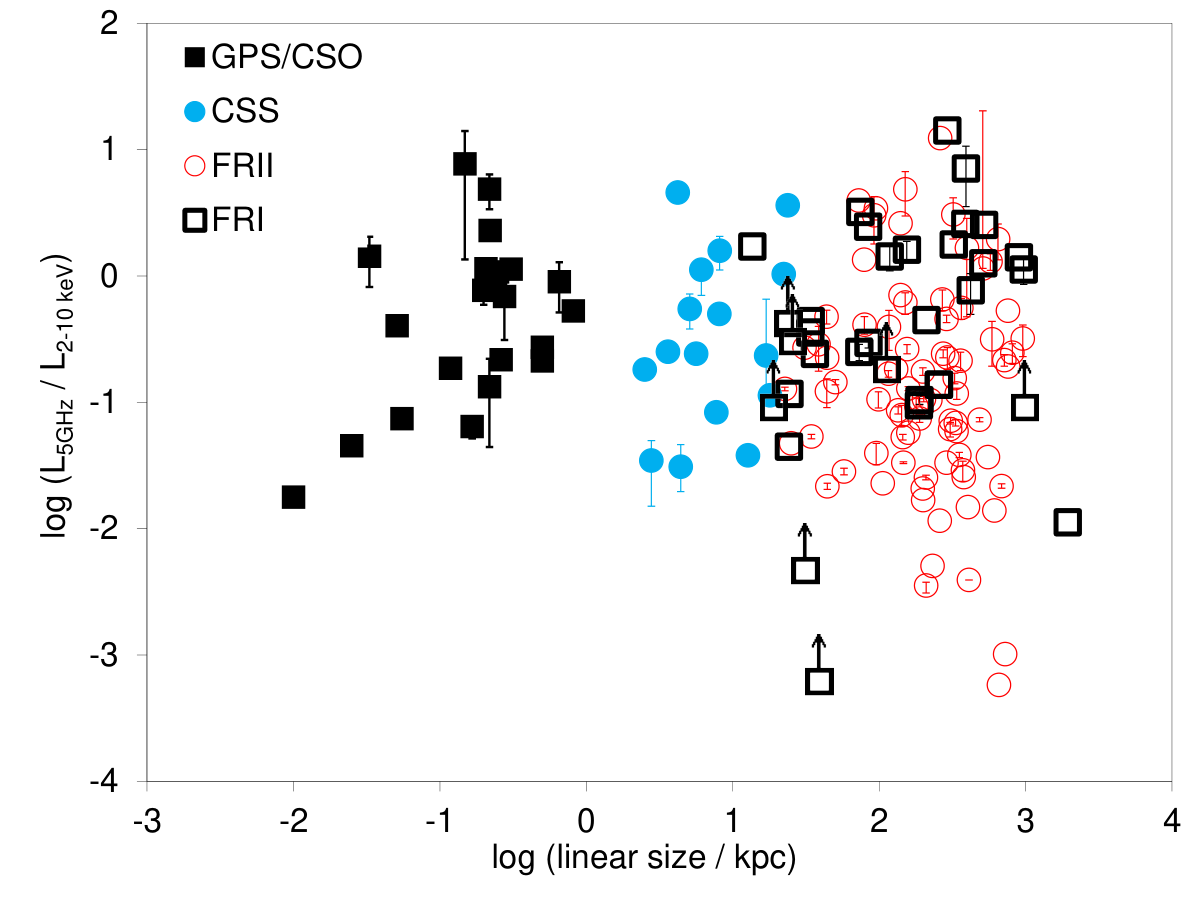
Recently, Stawarz et al. (2008) and Ostorero et al. (2010) have discussed an alternative evolutionary model for GPS sources, which predicts the dependency of the broadband Spectral Energy Distribution on the source linear size. In their model high-energy emission is produced by upscattering of various photon fields by the lobes’ electrons of the 1 kpc size radio source. This process can cause a decrease of the X-ray to radio luminosity ratio by 1-2 orders of magnitude when the GPS source size increases. However, with the data set gathered in this paper we cannot conclude any correlation between the radio/X-ray luminosity ratio and linear size of the sources.
4.4.3 - linear size relation
Finally, we have drawn a relation between the measured column density and the total extent of the radio source for GPS and CSS sources (Fig. 5). It has been already reported (Pihlström et al., 2003; Vermeulen et al., 2003) that the small sources (0.5 kpc) tend to have larger H I column density than larger sources (0.5 kpc) which indicates that GPS/CSO objects evolve in a disk distribution of gas with a power-law radial density dependence. The same explanation could lay behind the (tentative) anti-correlation between X-ray column density and radio size in GPS galaxies (Tengstrand et al., 2009). Ostorero et al. (2010) reported a positive correlation between the radio and X-ray hydrogen column densities what can points toward the cospatiality of the radio and X-ray emission regions. We extended the discussion about the relation of the versus the linear size to the CSS sources. We have noticed that the value of the CSS sources is on average lower than that of GPS objects. However, the correlation between the X-ray column density and radio size does not hold when including larger CSS objects in the sample of small and young AGNs.

5 Summary
In this paper we presented the X-ray Chandra observations of a pilot sample of low luminosity compact steep spectrum (CSS) sources. Four of them have been detected, the other three have upper limits estimations for the X-ray flux. Only for two CSS objects we were able to estimate the X-ray column density which is of the order of . We then expanded the sample of compact AGNs with other GPS/CSS sources with X-ray detections found in the literature and used it, together with a sample of large FR I and FR II sources, to determine the nature of the relation between morphology, X-ray properties and excitation modes in radio-loud AGNs. We found the following results:
We have compared the X-ray luminosity of the radio sources from all above mentioned groups with their radio properties. The large-scale FR II sources and strong GPS and CSS objects settle at higher X-ray and radio luminosities. While the low power CSSs occupy the space among, weaker in the X-rays, FR I objects. This trend is visible independently of radio frequency.
The HEG and LEG sources occupy distinct locus in the radio/X-ray luminosity plane, notwithstanding their evolutionary stage. This is in agreement with the postulated different origin of the X-ray emission in low and high ionization objects. Compact sources can be found in both excitation modes driven branches.
The less radio powerful FR Is have higher radio/X-ray luminosity ratio than many FR IIs what may imply higher X-ray luminosity decrease with radio power in FR Is than FR IIs. This is in agreement with the previous findings saying that the X-ray emission in FR Is originates from the base of a relativistic jet while the X-ray emission of FR IIs has accretion origin. The same can be true in the case of smaller radio AGNs, namely the GPS and CSS sources. The result of this study hints toward the fact that below some radio power level the compact GPS and CSS sources start to resemble the FR Is, or to be more specific, the LERG and NLRG objects.
The X-ray hydrogen column density of the CSS sources is on average lower than that of GPS objects. But the correlation between the X-ray column density and radio size does not hold for the whole sample of GPS and CSS objects.
Acknowledgements
AL wishes to thank CfA for their hospitality and support during the visit.
This research has made use of data obtained by the Chandra X-ray Observatory, and Chandra X-ray Center (CXC) in the application packages CIAO, ChIPS, and Sherpa. This research is funded in part by (NASA) contract NAS8-03060. Partial support for this work was provided by the Chandra grants GO1-12124X and GO1-12145X.
This research has made use of NASA’s Astrophysics Data System Bibliographic Services and of the NASA/IPAC Extragalactic Database (NED) which is operated by the Jet Propulsion Laboratory, California Institute of Technology, under contract with the National Aeronautics and Space Administration.
This publication makes use of data products from the SDSS. Funding for the SDSS and SDSS-II has been provided by the Alfred P. Sloan Foundation, the Participating Institutions, the National Science Foundation, the U.S. Department of Energy, the National Aeronautics and Space Administration, the Japanese Monbukagakusho, the Max Planck Society, and the Higher Education Funding Council for England. The SDSS Web Site is http://www.sdss.org/.
The SDSS is managed by the Astrophysical Research Consortium for the Participating Institutions. The Participating Institutions are the American Museum of Natural History, Astrophysical Institute Potsdam, University of Basel, University of Cambridge, Case Western Reserve University, University of Chicago, Drexel University, Fermilab, the Institute for Advanced Study, the Japan Participation Group, Johns Hopkins University, the Joint Institute for Nuclear Astrophysics, the Kavli Institute for Particle Astrophysics and Cosmology, the Korean Scientist Group, the Chinese Academy of Sciences (LAMOST), Los Alamos National Laboratory, the Max-Planck-Institute for Astronomy (MPIA), the Max-Planck-Institute for Astrophysics (MPA), New Mexico State University, Ohio State University, University of Pittsburgh, University of Portsmouth, Princeton University, the United States Naval Observatory, and the University of Washington.
References
- Allen et al. (2008) Allen, M. G., Groves, B. A., Dopita, M. A., Sutherland, R. S., Kewley, L. J., 2008, ApJS, 178, 20.
- An & Baan (2012) An, T., Baan, W. A., 2012, ApJ, 760, 77
- Antonucci (2012) Antonucci, R., 2012, A&AT, 27, 557
- Axon et al. (2000) Axon, D. J., Capetti, A., Fanti, R., Morganti, R., Robinson, A., Spencer, R., 2000, AJ, 120, 2284
- Balmaverde et al. (2006) Balmaverde, B., Capetti, A., & Grandi, P. 2006, A&A, 451, 35
- Baum & Heckman (1989) Baum, S. A. & Heckman, T., 1989, ApJ, 336, 702
- Begelman & Cioffi (1989) Begelman, M. C. & Cioffi, D. F. 1989, ApJ, 345, L21
- Begelman (1996) Begelman, M. C. 1996, in Proceedings of the Greenbank Workshop, Cygnus A – A Study of a Radio Galaxy, ed. C. L. Carilli, & D. E. Harris (Cambridge: CUP), 209
- Belsole et al. (2006) Belsole, E., Worrall, D. M., & Hardcastle, M. J. 2006, MNRAS, 366, 339
- Buttiglione et al. (2010) Buttiglione S., Capetti, A., Celotti, A., Axon, D.J., Chiaberge, M., Macchetto, F.D., Sparks, W.B., 2010, A&A, 509, 6
- Carvalho (1994) Carvalho, J. C., 1994, A&A, 292, 392
- Carvalho (1998) Carvalho, J. C., 1998, A&A, 329, 845
- Cegłowski et al. (2013) Cegłowski, M., Gawroński, M. P., Kunert-Bajraszewska, M., 2013, A&A, 557, 75
- Czerny et al. (2009) Czerny, B., Siemiginowska, A., Janiuk, A., Nikiel-Wroczyński, B., Stawarz, Ł., 2009, ApJ, 698, 840
- Dickey & Lockman (1990) Dickey, J. M. & Lockman, F. J., 1990, ARA&A, 28, 215
- Donato et al. (2004) Donato, D., Sambruna, R. M., & Gliozzi, M. 2004, ApJ, 617, 915
- Evans et al. (2006) Evans, D. A., Worrall, D. M., Hardcastle, M. J., Kraft, R. P., & Birkinshaw, M. 2006, ApJ, 642, 96
- Fanaroff &Riley (1974) Fanaroff, B. L., & Riley, J. M.: 1974, MNRAS 167, 31
- Fanti et al. (1990) Fanti, R., Fanti, C., Schilizzi, R., et al., 1990, A&A, 231, 333
- Fanti et al. (1995) Fanti, C., Fanti, R., Dallacasa, D., et al. 1995, A&A 302, 317
- Freeman et al. (2001) Freeman, P., Doe, S., & Siemiginowska, A. 2001, Proc. SPIE, 4477, 76
- Fruscione et al. (2006) Fruscione, A., et al., 2006, SPIE, 6270
- Gelderman & Whittle (1994) Gelderman, R. & Whittle, M., ApJS, 1994, 91, 491
- Gendre et al. (2013) Gendre, M. A., Best, P. N., Wall, J. V., Ker, L. M., 2013, MNRAS, arXiv:1301.1526
- Giroletti et al. (2005) Giroletti, M., Giovannini, G., & Taylor, G. B.: 2005, A&A 441, 89
- Grandi et al. (2006) Grandi, P., Malaguti, G., & Fiocchi, M. 2006, ApJ, 642, 113
- Gregory et al. (1996) Gregory, P. C., Scott, W. K., Douglas, K., & Condon, J. J. 1996, ApJS, 103, 427
- Guainazzi et al. (2004) Guainazzi, M., Siemiginowska, A., Rodriquez-Pascual, P., Stanghellini, C., 2004, A&A, 421,461
- Guainazzi et al. (2006) Guainazzi, M., Siemiginowska, A., Stanghellini, C., Grandi, P., Piconcelli, E., Azubike Ugwoke, C., 2006, A&A, 446, 87
- Hardcastle et al. (1999) Hardcastle, M. J. & Worrall, D. M., 1999, MNRAS, 309, 969
- Hardcastle et al. (2006) Hardcastle, M. J., Evans, D. A., & Croston, J. H. 2006, MNRAS, 370, 1893
- Hardcastle et al. (2007) Hardcastle, M. J., Evans, D. A., Croston, J. H., 2007, MNRAS, 376, 1849
- Hardcastle et al. (2009) Hardcastle, M. J., Evans, D. A., Croston, J. H., 2009, MNRAS, 396, 1929
- Heinz et al. (1998) Heinz, S., Reynolds, C. S., Begelman, M. C., 1998, ApJ, 501, 126
- Holt et al. (2006) Holt, J., Tadhunter, C. N., & Morganti, R., 2006, AN, 327, 147
- Kaiser & Best (2007) Kaiser, C. R. & Best, P. N. 2007, MNRAS, 381, 1548
- Kaiser & Alexander (1997b) Kaiser, C. R. & Alexander, P., 1997, MNRAS, 286, 215
- Kalberla et al. (2005) Kalberla, P. M. W. et al., 2005, A&A, 440, 775
- Kawakatu & Kino (2006) Kawakatu, N. & Kino, M. 2006, MNRAS, 370, 1513
- Kawakatu et al. (2009a) Kawakatu, N, Kino, M., Nagai, H. 2009, ApJ, 697, 173L
- Kawakatu et al. (2009b) Kawakatu, N, Nagai, H., Kino, M. 2009, AN, 330, 283
- Kino et al. (2013) Kino, M., Ito, H., Kawakatu, N., Orienti, M. 2013, ApJ, 764, 134
- Kino & Kawakatu (2005) Kino, M. & Kawakatu, N. 2005, MNRAS, 364, 659
- Konar et al. (2012) Konar, C., Hardcastle, M. J., Jamrozy, M., Croston, J. H., Nandi, S., 2012, MNRAS, 424, 1061
- Kozieł-Wierzbowska et al. (2012) Kozieł-Wierzbowska, D., Jamrozy, M., Zola, S., Stachowski, G., Kuźmicz, A., 2012, MNRAS, 422, 1546
- Kunert-Bajraszewska et al. (2006) Kunert-Bajraszewska, M., Marecki, A., & Thomasson, P., 2006, A&A 450, 945
- Kunert-Bajraszewska & Thomasson (2009) Kunert-Bajraszewska, M. & Thomasson, P., 2009, AN, 330, 210
- Kunert-Bajraszewska et al. (2009) Kunert-Bajraszewska, M., Siemiginowska, A., Katarzyński, K., Janiuk, A., 2009, ApJ, 705, 1356
- Kunert-Bajraszewska et al. (2010) Kunert-Bajraszewska, M.,Gawroński, M. P., Labiano, A., Siemiginowska, A., 2010a, MNRAS, 408, 2261
- Kunert-Bajraszewska & Labiano (2010) Kunert-Bajraszewska, M., Labiano, A., 2010b, MNRAS, 408, 2279
- Kunert-Bajraszewska et al. (2013) Kunert-Bajraszewska, M., Siemiginowska, A., Labiano, A., 2013, ApJ, 772, L7
- Labiano et al. (2005) Labiano, A., O’Dea, C.P., Gelderman, R., et al., 2005, A&A, 436, 493
- Labiano (2008a) Labiano, A., 2008a, A&A, 488, 59
- Labiano et al. (2008b) Labiano, A., O’Dea, C. P., Barthel, P. D., et al. 2008b, A&A, 477, 491
- Marecki et al. (2003) Marecki, A., Spencer, R. E., & Kunert, M.: 2003, PASA 20, 46
- Massaro et al. (2009) Massaro, F., et al., 2009, ApJL, 692, L123
- Massaro et al. (2010) Massaro, F., et al., 2010, ApJ, 714, 589
- Massaro et al. (2012) Massaro, F., et al., 2012, ApJSS, 203, 31
- Migliori et al. (2012) Migliori, G., Siemiginowska, A., Celotti, A., 2012, ApJ, 749, 107
- Morrison & McCammon (1983) Morrison, R., & McCammon, D., 1983, ApJ, 270, 119
- O’Dea et al. (1991) O’Dea, C. P., Baum, S. A., Stanghellini, C., 1991, ApJ, 380, 66
- O’Dea & Baum (1997) O’Dea, C. P., & Baum, S. A., 1997, AJ 113, 148
- O’Dea (1998) O’Dea, C. P., 1998, PASP, 110, 493
- O’Dea et al. (2000) O’Dea, C. P., De Vries, W. H., Worrall, D. M., Baum, S. A., Koekemoer, A., 2000, AJ, 119, 478
- O’Dea et al. (2006) O’Dea, C. P., Mu, B., Worrall, D. M., Kastner, J., Baum, S., de Vries, W. H., 2006, ApJ, 653, 1115
- Orienti et al. (2007) Orienti, M., Dallacasa, D., Stanghellini, C., 2007, A&A, 475, 813
- Orienti et al. (2010) Orienti, M., Murgia, M., Dallacasa, D., 2010, MNRAS, 402, 1892
- Ostorero et al. (2010) Ostorero, L., et al., 2010, ApJ, 715, 1071
- Penston et al. (1990) Penston, M. V., et al., 1990, A&A, 236, 53
- Pihlström et al. (2003) Pihlström, Y. M., Conway, J. E., & Vermeulen, R. C. 2003, A&A, 404, 871
- Readhead et al. (1996a) Readhead, A. C. S., Taylor, G. B., Xu, W., et al., 1996a, ApJ 460, 612
- Reynolds & Begelman (1997) Reynolds, C. S., & Begelman, M. C., 1997, ApJ, 487, L135
- Sambruna et al. (1999) Sambruna, R., Eracleous, M., & Mushotzky, R. 1999, ApJ, 526, 60
- Sambruna et al. (2004) Sambruna, R. M., Gambill, J. K., & Maraschi, L. et al. 2004, ApJ, 608, 698
- Siemiginowska et al. (2012) Siemiginowska, A., Stawarz, Ł., Cheung, C. C., et al. 2012, ApJ, 750, 124
- Siemiginowska (2009) Siemiginowska, A., 2009, AN, 330, 264
- Siemiginowska et al. (2008) Siemiginowska, A., LaMassa, S., Aldcroft, T. L., Bechtold, Jill; Elvis, M., 2008, ApJ, 684, 811
- Snellen et al. (2000) Snellen, I. A. G., Schilizzi, R. T., Miley, G. K., de Bruyn, A. G., Bremer, M. N., Röttgering, H. J. A., 2000, MNRAS, 319, 445
- Son at al. (2012) Son, D., et al., 2012, ApJ, 757, 140
- Spergel et al. (2003) Spergel, D. N., et al., 2003, ApJS, 148, 175
- Stanghellini et al. (2005) Stanghellini, C., O’Dea, C. P., Dallacasa, D., et al. 2005, A&A, 443, 891
- Stawarz et al. (2008) Stawarz, Ł., Ostorero, L., Begelman, M. C., Moderski, R., Kataoka, J., Wagner, S., 2008, ApJ, 680, 911
- Tengstrand et al. (2009) Tengstrand, O., Guainazzi, M., Siemiginowska, A., Fonseca Bonilla, N., Labiano, A., Worrall, D. M., Grandi, P., Piconcelli, E., 2009, A&A, 501, 89
- Vermeulen et al. (2003) Vermeulen, R. C., Pihlström, Y. M., Tschager, W., et al. 2003, A&A, 404, 861
- Vink et al. (2006) Vink, J., et al., 2006, MNRAS, 367, 928
- Worrall et al. (2009) Worrall, D. M. 2009, A&AR, 17, 1
- de Vries et al. (1999) de Vries, W. H., O’Dea, C. P., Baum, S. A., Barthel, P. D. 1999, ApJ, 526, 27.
- de Vries et al. (1997) de Vries, W. H., O’Dea, C. P., Baum, S. A., Sparks, W. B., Biretta, J., de Koff, S., Golombek, D., Lehnert, M. D., Macchetto, F., McCarthy, P., Miley, G. K., ApJS 110, 191.
- White et al. (1997) White, R.L., Becker, R.H., Helfand, D. J., Gregg, M.D., 1997, ApJ, 475, 479
- Wilms et al. (2000) Wilms, J., Allen, A., McCray, R., 2000, ApJ, 542, 914
- Wilson et al. (1988) Wilson, A. S., Ward, M. J. & Haniff, C. A., 1988, ApJ, 334, 121
- Wu et al. (2013) Wu, F., et al., 2013, A&A, 550, 113
- De Young (1993) De Young, D. S., 1993, ApJ, 402, 95
- De Young (1997) De Young, D. S., 1997, ApJL, 490, 55
Appendix A Spectroscopic classification of the other CSS/GPS sources with X-ray data
The spectroscopic data are available for 6 CSS sources from the samples of CSS/GPS sources of Tengstrand et al. (2009) and Siemiginowska et al. (2008) (Table A1). The HEG/LEG classification was based on the line ratios observed in the SDSS spectra according to the description by Kunert-Bajraszewska & Labiano (2010).
| Source name | RA(J2000) | Dec (J2000) | z | [O II] | [O III] | Hβ | log L2-10keV | log L5GHz | log L[OIII] | Spectral |
|---|---|---|---|---|---|---|---|---|---|---|
| hh mm ss | dd mm ss | type | ||||||||
| B2 0738+31 | 07:41:10.7 | 31:12:00 | 0.63 | 445.7 | 1490.6 | 3675.6 | 44.9 | 44.3 | 43.4 | |
| Q1250+568 | 12:52:26.3 | 56:34:20 | 0.32 | 1066.0 | 3564.8 | 1653.3 | 44.2 | 43.2 | 43.1 | |
| 1345+125 | 13:47:33.3 | 12:17:24 | 0.12 | 1038.9 | 4682.3 | 623.9 | 43.8 | 42.7 | 42.2 | HEG |
| OQ+208 | 14:07:00.4 | 28:27:15 | 0.07 | 37.8 | 1068.0 | 18749.0 | 43.9 | 42.2 | 41.2 | |
| 4C+00.02 | 00:22:25.4 | 00:14:56 | 0.30 | 29.2 | 54.2 | 2.4 | 42.7 | 43.1 | 41.2 | HEG |
| PKS1607+26 | 16:09:13.3 | 26:41:29 | 0.47 | 63.6 | 200.0 | 44.6 | 44.5 | 43.8 | 42.2 | HEG |