A Signature of Chemical Separation in the Cooling Light Curves of Transiently Accreting Neutron Stars
Abstract
We show that convection driven by chemical separation can significantly affect the cooling light curves of accreting neutron stars after they go into quiescence. We calculate the thermal relaxation of the neutron star ocean and crust including the thermal and compositional fluxes due to convection. After the inward propagating cooling wave reaches the base of the neutron star ocean, the ocean begins to freeze, driving chemical separation. The resulting convection transports heat inward, giving much faster cooling of the surface layers than found assuming the ocean cools passively. The light curves including convection show a rapid drop in temperature weeks after outburst. Identifying this signature in observed cooling curves would constrain the temperature and composition of the ocean as well as offer a real time probe of the freezing of a classical multicomponent plasma.
Subject headings
dense matter — stars: neutron — X-rays: binaries — X-rays: individualI. Introduction
The observation of surface cooling of accreting neutron stars on timescales of days to years after they go into quiescence has opened up a new window on the physics of neutron star crusts. Six neutron stars in low mass X-ray binaries have now been observed to cool after extended accretion outbursts that were long enough to heat the crust significantly out of thermal equilibrium with the core [6, 5, 11, 7, 8, 9]. The subsequent thermal relaxation of the crust depends on its physical properties such as its thickness, thermal conductivity, and heat capacity, with deeper regions being probed at successively later times in the cooling light curve [10, 4, hereafter BC09]. Shternin et al. [21] and BC09 showed that the observed cooling curves of KS 1731–260 and MXB 1659–29 imply that the inner crust has a thermal conductivity corresponding to an impurity parameter of order unity. Page & Reddy [18] find that the cooling curve of XTE J1701–462 is compatible with similar crust microphysics to KS 1731–260 and MXB 1659–29.
Chemical separation occurs when, as a material freezes, the equilibrium compositions of the liquid and solid phases are different. This important process can drive sedimentation or mixing in white dwarf [2] and giant planet [22, e.g.,] interiors, and Earth’s core [13]. Horowitz, Berry, & Brown [14] carried out molecular dynamics simulations of the freezing of the multicomponent plasma expected in the outer layers of accreting neutron stars, and found chemical separation occurred, with lighter nuclear species being preferentially retained in the liquid phase. In a previous paper [16, hereafter MC11] we considered the effect of chemical separation while accretion is ongoing. In that case, as matter is driven to higher pressure and crosses the freezing depth, the light elements released into the neutron star ocean will drive convection, mixing them throughout the ocean and raising the light element fraction. At the same time, because the convection is driven by composition gradients in an otherwise thermally stable layer, the convective heat flux is inward, potentially heating the layers deep in the ocean.
In this paper, we consider the cooling of the outer layers of the star in quiescence, during which the liquid layers freeze into a solid and chemical separation occurs, enriching the ocean further in light elements. We show that the resulting compositionally driven convection can significantly modify the expected cooling curves of accreting transients. We first discuss the expected size of the compositionally driven heat flux and show that it is easily comparable to the cooling flux in the ocean (Section II). We then present simulations of ocean cooling including heat transport by convection, showing that the light curve is significantly modified (Section III). We conclude with a discussion of the theoretical uncertainties and implications for observed sources (Section IV).
II. Chemical separation and the compositionally driven heat flux
The outermost layers of an accreting neutron star form a gaseous atmosphere and liquid ocean [3], in regions where the Coulomb coupling parameter [19], where is the number average over the mixture of nuclei with charge , is the electron sphere radius, and is the temperature. A useful measure of the depth is the column depth , related to the pressure by where is the gravity. The base of the ocean lies at
| (1) |
where , K, , and the subscript ‘’ signifies that the quantities are taken at the base of the ocean. Note that in Eq. (1) we assume , appropriate for an oxygen-enriched ocean; a heavy-element rich can be much shallower, .
BC09 showed that when accretion ends, the cooling of the star proceeds by the temperature profile relaxing from the outside-in. At any given time, lower density layers have cooled and adopted a constant flux temperature profile, whereas deeper layers have yet to thermally relax. The transition occurs at a depth given by setting the thermal timescale
| (2) |
(Henyey & L’Ecuyer 1969; equation 7 of BC09) equal to the current time. In Eq. (2), is the mass density, is the specific heat, is the thermal conductivity, and is the pressure scale height. In the ocean, the pressure is dominated by the relativistic degenerate electrons with , giving the scalings , , and and constant (e.g., MC11 and references therein).
Equations (1) and (2) show that tens of days after the onset of quiescence, the base of the ocean will start to cool and solidify. As new crust is formed, the bottom of the ocean becomes enriched in light elements because of chemical separation [14, 15]. In MC11, we estimated the timescales for particle nucleation, growth, and sedimentation of solid particles, finding that these “microscopic” timescales were much shorter than “macroscopic” timescales such as the time to accrete the ocean, or more relevant here, the time for the ocean to cool. The picture then is that fluid elements with a light composition are deposited at the base of the ocean and will rise upwards, driving convective mixing. Moreover, the convection occurs in a medium that is otherwise thermally stratified. Therefore the convective heat flux, which is proportional to the excess of the temperature gradient in the star compared to the adiabatic gradient , or , is negative; the compositionally driven convection transports heat inwards.
We can estimate the expected size of by comparing the heat and composition fluxes. In mixing length theory, the heat flux is , where is the convective velocity; whereas the composition flux is , where is the composition gradient in the star (MC11), and is the light element mass fraction. The convective velocity is given by the superadiabaticity,
| (3) |
where is the mixing length, , and . In the ocean, the convection is extremely efficient and therefore close to marginal stability, . The heat and composition fluxes are then related by
| (4) |
During cooling, the composition of the ocean is changing with time as the ocean is enriched in light elements. For efficient convection, the light element fraction is fairly constant over the ocean (), and so is roughly constant throughout the ocean. The composition flux is then , and the heat flux is
| (5) |
Taking and (MC11), we find a flux that increases steeply inwards, .
If cooling is unaffected by compositionally driven convection, we estimate the timescale on which is changing, , to be a typical thermal time at the ocean floor: in the standard cooling model the bulk of the ocean freezes on a thermal time; as it does it releases nearly all of its light elements into the remaining ocean and approximately doubles the light element content there. Equation (5) becomes
| (6) |
where we have assumed and [and and in Eq. (2)]. The flux from compositionally driven convection in Eq. (6) easily outweighs the cooling flux, . This suggests that the cooling of an ocean with chemical separation included should be significantly different than without, and motivates our numerical calculations that will be presented in the next section. As we shall see below, the freezing of the ocean is strongly regulated by the convective heat flux, and in turn keeps the heat flux at a much lower level than is suggested by Eq. (6).
III. Numerical simulations of cooling with compositionally driven convection
We solve for the thermal relaxation of the neutron star ocean and crust by solving the thermal diffusion equation following BC09, but including convective heat fluxes modeled using mixing length theory and assuming the convection is efficient as described in MC11, and in addition by following the composition profile as chemical separation and mixing occur. For the examples shown here, we take the ocean composition to be a mixture of oxygen and selenium, for which the phase diagram is shown in the lower panel of figure 1 in MC11. A full description of our numerical code will be presented elsewhere [17]; here we focus on the resulting light curves and describe the influence of compositionally driven convection on the evolution.
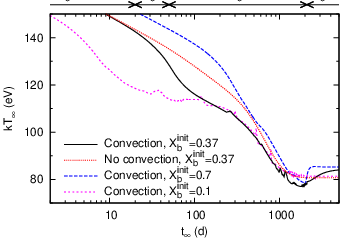


Figure 1 shows an example light curve with and without compositionally driven convection included. Figures 2 and 3 show the temperature and composition profiles, respectively, at different times as the ocean and crust cool. The temperature profile at the end of the accretion outburst is similar to that assumed by BC09, with an inward directed heat flux, and (for Figs. 2 and 3) an initial base composition , corresponding to the steady state (MC11). The kink in the temperature profile at is due to the jump in composition between the ocean and overlying H/He layer (cf. Paper I). The neutron star mass and radius are and , giving a redshift factor of .
We find that the evolution proceeds in four stages. During stage 1, the base of the ocean has not yet started to cool and so the evolution is the same with or without convection included. The light curve is a power-law with slope given by equation 8 of BC09, with the modification that in the ocean rather than 3/4 as in the outer crust.
In stage 2 ( in Figs. 1–3), the cooling wave has reached the bottom of the ocean, and new crust begins to form, driving convection. Because convection transports heat inward from the ocean to the ocean-crust boundary, cooling at the boundary is delayed at the expense of more rapid cooling in the ocean. As a result, the temperature profile in the ocean becomes very steep and the light curve drops faster than without convection. During this stage, the convective heat flux is strong and the boundary cools very slowly; the transition depth and temperature and remain close to their values at the onset of quiescence. In this way, the convection acts analogously to the latent heat.11 1 Note that latent heat is much smaller than the convective heating and does not significantly change the light curve. The cusp in the temperature profile is due to the jump in conductive flux that must occur to balance the large inward convective flux in the ocean.
The temperature profile can not steepen indefinitely, because eventually the temperature gradient at the base of the ocean approaches , the liquidus temperature gradient (i.e., how the melting temperature varies with pressure; see MC11). When , multiple depths at the bottom of the ocean freeze simultaneously. This rapid freezing quickly suppresses itself, however, as strong compositionally driven convection heats the base of the ocean and melts the top of the crust, mixing a heavy-element fluid into the bottom of the ocean and thereby stabilizing the ocean against further convection. Cooling resumes, but convection remains off, such that the steep temperature profile at the ocean base that had been supported by convection quickly flattens due to heat conduction. Once the heavy-element-enriched fluid at the base of the ocean completely solidifies, compositionally driven convection resumes and the temperature profile steepens again.
In this manner oscillates around . We refer to this phase as stage 3 ( in Figs. 1–3). In this stage convection is sporadic in the ocean and can no longer prevent the ocean base from cooling. As a result, the ocean boundary moves outward and the cooling wave then continues its inward motion through the crust. We find generally that ; i.e., that the ocean-crust boundary cools rapidly but moves outward slowly. This is due to the compensating effect of light element enrichment on the freezing depth. During stage 3, the surface temperature still drops with time, but at a rate similar to without convection; and now is constant while and drop and increases.
During stage 4 ( in Figs. 1–3), the crust is thermally relaxed, the ocean cools too slowly for convection to support the steep gradient , and the light curve returns to the shape it would have if there was no ocean convection. Note, however, that due to light element enrichment the asymptotic value of is slightly higher in the case with convection than without (the ocean thermal conductivity , and so for a given base temperature the outwards flux is greater for a lower ). Alternatively, the ocean experiences an abrupt transition to stage 4 when the base is saturated with light elements () and chemical separation halts; this happens at days in the case of Fig. 1.
IV. Discussion and Conclusions
Previous calculations of the thermal relaxation of accreting neutron stars in quiescence have assumed that the ocean cools passively. In contrast, we have shown here that mixing in the ocean driven by chemical separation at the base leads to a significantly different evolution, changing the expected cooling curve. The early time (1–100 days) cooling curve of quiescent neutron stars potentially offers a remarkable new probe of the freezing and chemical separation of a classical plasma in “real time”. The timing of the rapid drop in flux is sensitive to the composition and temperature of the ocean at the end of the outburst. The magnitude of the effect depends on the composition of the ocean, in particular the fraction of light elements and contrast in the atomic mass of the light and heavy nuclei.

Detecting the signature of convection will require better sampling of the early phase of the cooling curve. We can generally fit currently available light curves equally well with and without convection. These fits will be presented in a companion paper [17]; two examples are shown in Fig. 4. XTE J1701–462 [11] is interesting because its high temperature means that the ocean remains liquid for hundreds of days. [18] fit the light curve with a standard cooling model (neglecting the two data points marked in Fig. 4 that are argued to be contaminated with residual accretion). Including convection we find that we can match the drop in luminosity at – days. A general result is that convection lessens, but does not remove, the need for a shallow heat source in the ocean during accretion [18, BC09; Paper I;], because light element enrichment increases the thermal conductivity and reduces the temperature gradient, making the ocean hotter.
Convection could help with recent observations of two classical transients (with shorter 2–3 month outbursts). In IGR J17480–2446 [8], the flux remains elevated above the value observed before the outburst. Convection allows to change from one accretion episode to the next, modifying the ocean conductivity and thereby changing the late time temperature (compare the solid curve with the hatched region in Fig. 4). XTE J1709–267 showed a rapid decrease in temperature during a single 8 hour XMM observation [9]. If due to crust cooling, [9] suggested that a strong heat source must be operating at low densities within the ocean during the outburst, necessary for significant thermal relaxation after a short outburst of only 2–3 months. We can reproduce the rapid drop in temperature with convection if stage 2 of the light curve (Section III) occurs during the observation.
There remains much to be explored theoretically. We have included only two species in our calculations, oxygen and selenium, which approximates the rp-process ashes used by [14]. The phase diagram for multicomponent mixtures is complex but can be calculated [14, 15] and should be included. We have assumed that solid particles form at a single depth. However, electron capture reactions may occur in the ocean (for example, 56Fe captures at a density of , Haensel & Zdunik 12), lowering the at that depth, and potentially leading to formation of solid particles pre-electron capture above the post-electron capture liquid layers. It will be important to include carbon burning in the models. Enrichment of the ocean with carbon remains a major issue for superburst models [20]. Chemical separation during the cooling phase will significantly enrich the ocean in light elements immediately following an outburst, much more efficiently than gravitational sedimentation during quiescence. This may have implications for the puzzling superburst observed immediately before the onset of an accretion outburst in EXO 1745–248 [1].
References
- [1] Altamirano, D., Keek, L., Cumming, A. et al. 2012, MNRAS, 426, 927
- [2] Althaus, L. G., García-Berro, E., Isern, J., Córsico, A. H., & Miller Bertolami, M. M. 2012, A&A, 537, A33
- [3] Bildsten, L. & Cutler, C. 1995, ApJ, 449, 800
- [4] Brown, E. F. & Cumming, A. 2009, ApJ, 698, 1020
- [5] Cackett, E. M., Brown, E. F., Cumming, A., et al. 2013, ApJ, 774, 131
- [6] Cackett, E. M., Brown, E. F., Cumming, A., et al. 2010, ApJ, 722, L137
- [7] Degenaar, N., Wolff, M. T., Ray, P. S., et al. 2011, MNRAS, 412, 1409
- [8] Degenaar, N., Wijnands, R., Brown, E. F., et al. 2013a, ApJ, 775, 48
- [9] Degenaar, N., Wijnands, R., & Miller, J. M. 2013b, ApJ, 767, L31
- [10] Eichler, D., & Cheng, A. F. 1989, ApJ, 336, 360
- [11] Fridriksson, J. K., Homan, J., Wijnands, R., et al. 2011, ApJ, 736, 162
- [12] Haensel, P. & Zdunik, J. L. 1990, A&A, 227, 431
- [13] Hirose, K., Labrosse, S., & Hernlund, J. 2013, Ann. Rev. Earth and Planetary Sciences, 41, 657
- [14] Horowitz, C. J., Berry, D. K., & Brown, E. F. 2007, Phys. Rev. E, 75, 066101
- [15] Medin, Z. & Cumming, A. 2010, Phys. Rev. E, 81, 036107
- [16] Medin, Z. & Cumming, A. 2011, ApJ, 730, 97
- [17] Medin, Z. & Cumming, A. 2014, in preparation
- [18] Page, D. & Reddy, S. 2013, Phys. Rev. Lett., submitted (arXiv::1307.4455)
- [19] Potekhin, A. Y., & Chabrier, G. 2000, Phys. Rev. E, 62, 8554
- [20] Schatz, H., Bildsten, L., Cumming, A., & Ouellette, M. 2003, Nucl. Phys. A, 718, 247
- [21] Shternin, P. S., Yakovlev, D. G., Haensel, P., & Potekhin, A. Y. 2007, MNRAS, 382, L43
- [22] Wilson, H. F., & Militzer, B. 2010, Phys. Rev. Lett., 104, 121101