DFT study of La2Ce2O7: disordered fluorite vs pyrochlore structure
Abstract
The crystal structure of Lanthanum Cerium Oxide (La2Ce2O7) is investigated using ab initio density functional theory (DFT) calculations. The relative stability of fluorite- and pyrochlore-like structures is studied through comparison of their formation energies. These formation energies show the pyrochlore structure to be favored over the fluorite structure, apparently contradicting the conclusions based on experimental neutron and X-ray diffraction (XRD). By calculating and comparing XRD spectra for a set of differently ordered and random structures, we show that the pyrochlore structure is consistent with diffraction experiments. For these reasons, we suggest the pyrochlore structure as the ground state crystal structure for La2Ce2O7.
I Introduction
Since the pioneering work of Zintl and Croatto,[1] La2Ce2O7 has been studied for over half a century. During this time, La2Ce2O7 and more generally the LaxCe1-xO2-x/2 compounds have been studied in the context of three-way automotive catalysts,[2, 3, 4, 5] as an ionic conductor in solid oxide fuel cells,[6, 7, 8] and as oxygen sensor.
In recent years, it has also become of interest as a new material for thermal barrier coatings.[9, 10, 11]
It might also be considered as a new buffer layer in combination with perovskite superconductors for the use in coated conductors on Rolling Assisted Biaxially Textured substrates (RABiTS).[12, 13, 14]
Although this compound has been known for a long time, its crystal structure remains a point of discussion. The two competing models for its crystal structure are the disordered fluorite and the pyrochlore structures.
Many ternary oxides with the formula A2B2O7, with III ions A and IV ions B, adopt a pyrochlore structure, making the latter a good candidate for the La2Ce2O7 structure. Conversely, in many cases where a pyrochlore crystal structure is observed, the A and B ions are indeed lanthanides and/or transition metals. A pyrochlore structure (space group ) can be obtained from a fluorite structure (space group ) with one eighth of the oxygen ions missing ( Wickoff site, when placing the origin at a B cation). Each oxygen vacancy is surrounded by four BIV ions (16 sites), while six oxygen ions ( sites) are each surrounded by two AIII and two BIV ions, and the seventh oxygen ion ( site) is surrounded by four AIII ions ( sites). The pyrochlore structure has a clear short-range order. It turns out to be stable only in a certain range of ionic radius ratios of the two cations. Outside this range, a disordered fluorite structure becomes more stable.[15]
This disordered fluorite structure for La2Ce2O7 is obtained by random replacement of half the Ce cations in the CeO2 cubic fluorite lattice by La cations. In addition, one eighth of the O anions are removed, also through random selection. This structure has the required stoichiometry and the crystal structure is a cubic fluorite with each cation site occupied by Ce and La atoms on average, and each anion site on average occupied by O atoms. As a result, no short-range order is present in a disordered fluorite structure, in contrast to the pyrochlore structure, .
The border between the stability regions of the disordered fluorite and the pyrochlore structures has been defined empirically, to reflect the experimental data as well as possible.[16] With the ionic radius ratio for La2Ce2O7 located very close to this border, La2Ce2O7 itself becomes interesting for investigating the order-disorder transition in pyrochlores. Minervini et al. show in their theoretical study of disorder in pyrochlore oxides that La2Ce2O7 lies at the boundary of stability for pyrochlore formation. They claim that in this boundary region La2Ce2O7 remains a disordered fluorite structure, though the pyrochlore structure appears stable with regard to cation and anion disorder.[16]
Furthermore, there is a list of experiments which are in favor of the disordered fluorite structure. In their early neutron diffraction experiments, Brisse and Knop claim La2Ce2O7 to have a disordered fluorite structure rather than a pyrochlore one.[15] But also more recent XRD experiments point towards a disordered fluorite structure, due to the lack of pyrochlore-specific peaks in the spectrum.[17, 18] It was also shown that this structure remains stable, even at very high temperatures.[9, 10]
In contrast, recent studies of LaxCe1-xO2-x/2 show a different behavior.
XRD experiments by Bae et al.[8] show
that the CeO2 fluorite structure is maintained for La concentrations up to (for La2Ce2O7 ), and only at higher La concentrations the pyrochloric ordering of the cations (LaIII and CeIV) appears. These authors also observe that the lattice parameter does not expand in a linear fashion as was reported earlier by Chambonnet et al.[19], and assume this reduced expansion is due to the clustering of O-vacancies. Other authors find multiple non-linear regions in the expansion of the lattice parameter. Ryan et al.[20] link this behavior to the presence of two phases with different La concentration. Of these, the phase with the high La density shows a discontinuity in the lattice parameter just around % La, and a constant lattice parameter above % La.
Though they do report observing local ordering in the system, unlike Bae et al.[8], they refrain from linking the second phase to a pyrochlore phase. In contrast, O’Neill and Morris find only a single phase in their investigation of LaxCe1-xO2-x/2.[21] However, they only go up to a La concentration of 10%, where Ryan et al.[20] observed the appearance of the second phase at a La concentration of %, indicating that below this La concentration, the second phase was either not present or not distinguishable.
As a result of this complex behavior, no definitive crystal structure has been established for La2Ce2O7, and there exists only a single entry in the ICSD database, referring back to the work of Zintl and Croatto.[1, 22, 23]
Experiments are interpreted in favor of the disordered fluorite as well as the pyrochlore structure, and some authors even refer to La2Ce2O7 both as a pyrochlore and a fluorite structure in the same work.[24]
In this paper we present an ab initio density functional theory (DFT) study of the La2Ce2O7 crystal structure. Based on the order–disorder contrast of the experimentally proposed pyrochlore and disordered fluorite structures, we focus on the effect of order in possible La2Ce2O7 structures. By calculating and comparing the formation energies and XRD spectra for a set of different ordered and random structures, we show the pyrochlore structure to be favored over the disordered fluorite structure.
| La positions | O-vacancies | space group | |
| c111 L NV | 1, 2 | P4/mmm | |
| c111 L 2Ce2La | 1, 2 | 2 | Cmm2 |
| LZO NV | 5, 6, 7, 8 | Fdm | |
| LZO 2Ce2La | 5, 6, 7, 8 | 1, 6 | C2/m |
| LZO 4Ce | 5, 6, 7, 8 | 15, 16 | Fdm |
| LZO 4La | 5, 6, 7, 8 | 13, 14 | Fdm |
| L111 NV | 1, 6, 7, 8 | Rm | |
| L111 3Ce1La | 1, 6, 7, 8 | 15, 16 | Rm |
| L111 1Ce3La | 1, 6, 7, 8 | 13, 14 | Rm |

II Theoretical method
Starting from the CeO2-fluorite structure, the La2Ce2O7 structure is obtained by replacing half of the CeIV ions by LaIII (i.e. CeO2 La2Ce2O8), and, due to charge compensation, removing one eight of the O ions (i.e. La2Ce2O8 La2Ce2O7). This can be achieved in a large number of ways, resulting in both ordered structures and disordered structures. Because an exhaustive study is impossible within the DFT framework, and because the most prominent difference between the disordered fluorite and pyrochlore structures is their amount of short range order, our study can be confined to some highly ordered structures and a “random structure”.
This allows us to investigate the influence of cation-ordering on the stability of the system. Moreover, the chemical environment of the vacancies can be studied in this way.
The three ordered cation distributions we use are: the La2Zr2O7 pyrochlore structure (LZO), the cubic CuAu L structure (c L), with alternating La and Ce layers along the [001] orientation, and the L111 structure, with alternating Ce and La layers along the [111] orientation.
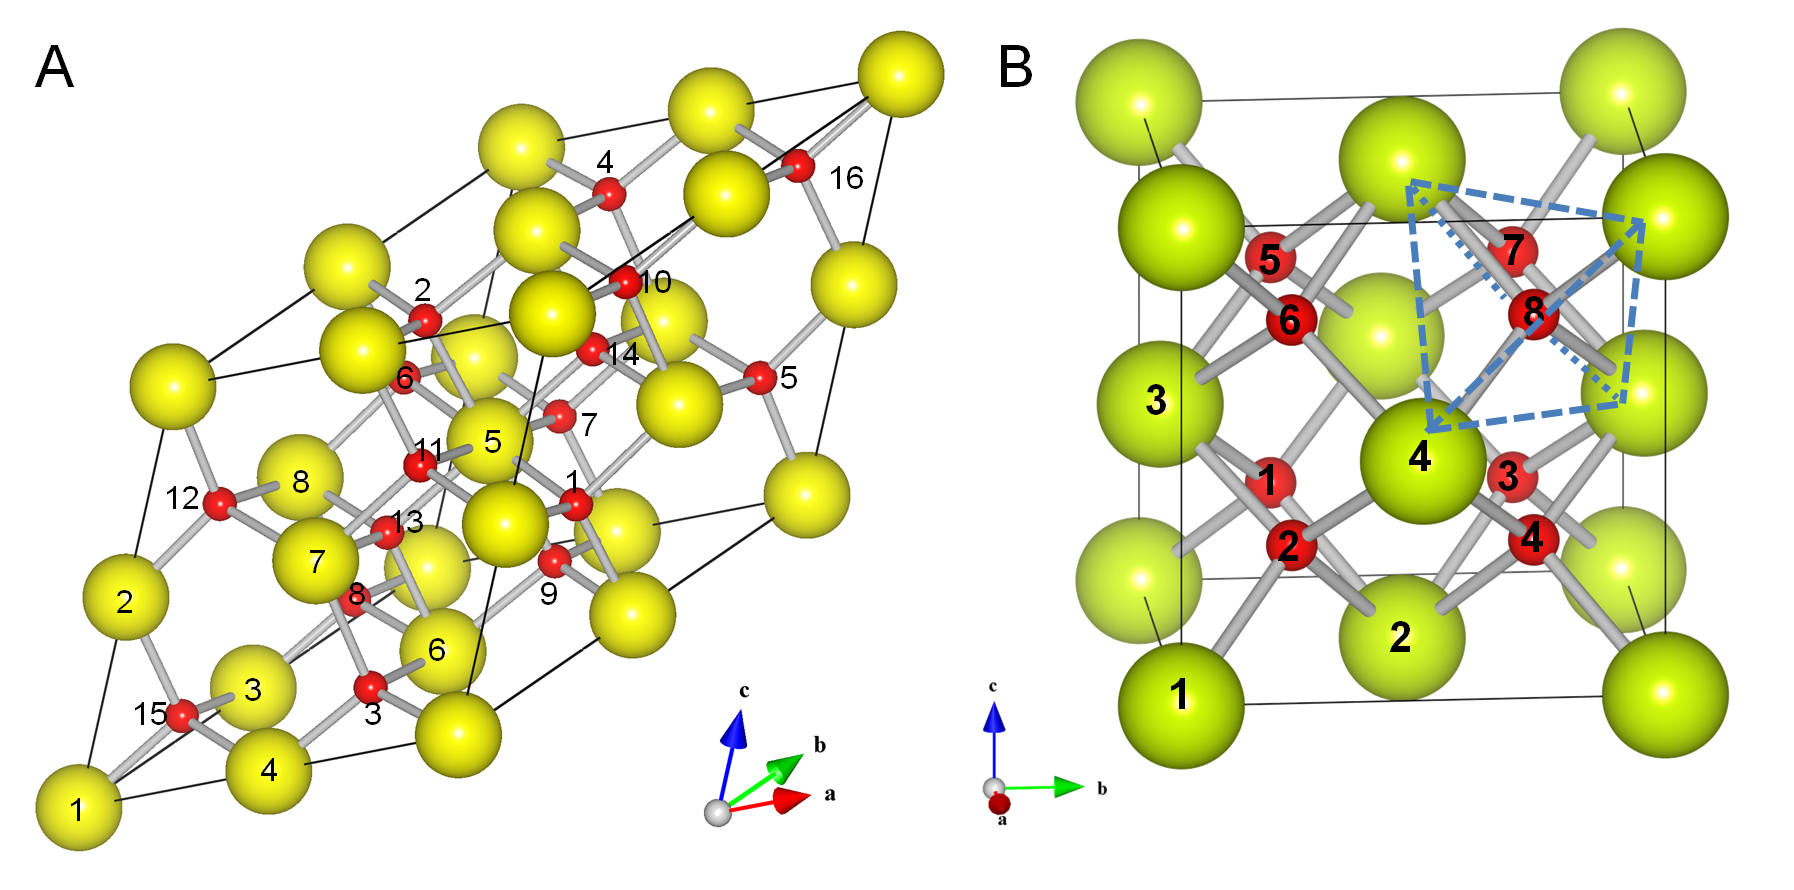
Both the LZO and L111 structures can be constructed using the fluorite p primitive fcc supercell, shown in Fig. 1A, the L structure can be constructed using the cubic fluorite supercell, shown in Fig. 1B. For each of these structures a set of O-vacancies is chosen in such a way that all vacancies in a single system have the same chemical environment.
Table 1 gives the positions of the La cations and O-vacancies in the unit cells used for these structures, and shown in Fig. 1A and B, and the resulting cation distributions are shown in Fig. 2A, B, and C. The tetrahedral surrounding (cf. Fig. 1B) of the vacancies is indicated as CeLa, with and integers giving the number of Ce and La cations in the tetrahedron. Cells without O-vacancies are indicated with NV.
All p222 cells, except the NV structures, contain two vacancies. To improve the comparability of the different structures, the two O-vacancies are always placed symmetrically around a single cation. This way we can assume the contribution to the formation energy due to the O-vacancy interaction energy to be the same for all p222 systems.
As a consequence of this setup, all four cations surrounding the O-vacancy in the p222 cells are -coordinated. Note that we use the term coordination only to indicate the number of anions present surrounding the cation, not the number of anions the cation has an actual bond with.
There are several methods in literature to obtain physical properties of disordered or random structures. The most intuitive perhaps is the use of averaged potentials in the Virtual Crystal Approximation, where instead of using a specific potential for each ionic species one uses a potential representing the average atomic species present.[26]
Another approach is the use of Monte-Carlo methods, and a statistical analysis of the results obtained. However, this method requires one to do thousands (or even more) of calculations, which is not feasible due to the size of our unit cell and the cost of DFT calculations. A third possible approach is the use of cluster expansions, where the configurational dependence of the physical property of interest is described as a sum over bonds or clusters. However, the configurational dependence of any variable can be described exactly by a cluster expansion only if all terms are retained, which is not the case in any practical implementation. Furthermore, predictions of the cluster expansion can depend sensitively on the choices made by the user with regard to for example input structures.[27, 28]
We will make use of what is called a Special Quasi-random Structure (SQS). [29, 30, 31] This is a super cell chosen in such a way that the correlation functions of the system resemble those of a truly random system as closely as possible. Although the super cell is a few times larger than a unit cell, and has no symmetry, the fact that we only need to do calculations with a single structure makes this technique orders of magnitude cheaper than a Monte-Carlo method. Neither is it necessary to use statistical methods to obtain system properties.
The main problem with using SQS is the fact that they need to be constructed first. For the pyrochlore(fluorite) system an SQS containing atoms was previously given by Jiang et al.[25]. We use this SQS to investigate the physical properties of a disordered fluorite structure. A ball and stick representation is shown in Fig. 2D. Because all possible tetrahedral surroundings for the vacancies are present in this system, no tetrahedral surrounding is indicated.
The electronic structure calculations are performed within the DFT framework using the projector augmented wave (PAW) approach for the core-valence interaction and the Perdew-Burke-Ernzerhof (PBE) approximation for the exchange-correlation functional as implemented in the VASP code.[32, 33, 34, 35, 36]
The kinetic energy cutoff is set at eV and special -point sets of
, , and -points are used for static self-consistent calculations in the c111, p222 and the SQS cells respectively. For the SQS cells a smaller -point set is used during relaxation. To optimize the geometry a conjugate gradient algorithm is applied. Both ion positions and cell parameters are optimized simultaneously.
Because the electron of Ce is known to be badly described in DFT at the PBE-level, we also performed calculations including on-site Coulomb corrections (PBE+U).[37, 38] The inclusion of on-site Coulomb corrections has been shown to provide a consistent treatment of Ce ions in ceria.[39, 40, 41, 42, 43]
The choice of U for the Ce electrons is found to be optimal in the range of – eV, depending on which property is under specific investigation.[41, 42, 44]
For reduced ceria, and a consistent description of pure CeO2 and Ce2O3, both Nolan et al.[39] and Andersson et al.[41] suggest for GGA+U a U eV. Because La2Ce2O7 contains a large amount of O vacancies, we will follow this suggestion.
| PBE | PBE+U | |||||
| Hf | Evac,f | dvac-vac | Hf | Evac,f | dvac-vac | |
| (eV) | (eV) | (Å) | (eV) | (eV) | (Å) | |
| c111 L NV | 1.177 | 1.280 | ||||
| c111 L 2Ce2La | 0.758 | -0.419 | 0.800 | -0.480 | ||
| LZO NV | 1.167 | 1.364 | ||||
| LZO 2Ce2La | 0.939 | -0.229 | 1.105 | -0.259 | ||
| LZO 4Ce | -0.016 | -1.183 | 0.220 | -1.143 | ||
| LZO 4La | 1.668 | 0.501 | 1.620 | 0.256 | ||
| L111 NV | 1.169 | 1.564 | ||||
| L111 3Ce1La | 0.452 | -0.717 | 0.668 | -0.896 | ||
| L111 1Ce3La | 1.352 | 0.183 | 1.420 | -0.144 | ||
| SQS NV | 1.160 | 0.699 | ||||
| SQS | 0.527 | -0.633 | n/a | 0.607 | -0.91 | n/a |
In theoretical studies of La doping of ceria surfaces, it was also shown by Yeriskin and Nolan that an on-site Coulomb correction is required to correctly describe the localized hole on the O state.[45] This localized hole results from the introduced LaIII ion at a CeIV site. Since the La2Ce2O7 structure can be interpreted as an extreme case of La doping we use the same U eV on the O states.
The XRD spectra are generated for the relaxed structures using the visualizer tool of the ICSD database.[22, 23]
III Results and Discussion
III.1 Energetics
The energetics of the system are studied through comparison of the heat of formation Hf and the vacancy formation energies Evac,f of the different configurations. The heat of formation is calculated using:
| (1) |
with the total ground state energy of the relaxed system, and the number of Ce and La atoms present in the system, and the bulk energy of CeO2 and La2O3, the number of additional O atoms not accounted for by the CeO2 and La2O3 formula units, and the ground state energy calculated for a free oxygen molecule. The factor is the number of formula units, which we define as the size of a supercell containing a single O-vacancy. The equivalent supercell is used for the systems without vacancies.
The O-vacancy formation energy Evac,f is calculated using:
| (2) |
with and the ground state energies obtained for the systems with and without vacancies, respectively, and the total number of vacancies present in the system with O-vacancies. Negative values indicate a stabilization of the system. The resulting energies are shown in Table 2.
The calculated heats of formation and O-vacancy formation energies presented in Table 2 show some clear trends with regard to the stability of La2Ce2O7. If no O-vacancies are involved (i.e. La2Ce2O8) PBE calculations show all possible cation distributions to be roughly degenerate. Including on site Coulomb corrections for Ce and O lifts this degeneracy and shows the disordered fluorite structure to be the most stable. However, La2Ce2O7 contains % O-vacancies compared to the CeO2 fluorite structure to provide the necessary charge compensation for the introduction of trivalent La in a tetravalent Ce position in the CeO2 lattice. In contrast to the previous, the introduction of O-vacancies shows no qualitative difference between the PBE and PBE+U results. In both cases the introduction of O-vacancies is beneficial for the heat of formation. The sole exceptions are the systems with three or four La cations in the tetrahedral surrounding of the O-vacancy: L CeLa (PBE only) and LZO La (PBE and PBE+U).
Of all configurations studied, the LZO 4Ce system (i.e. the actual pyrochlore structure) has the most favored heat of formation and O-vacancy formation energy. It has a heat of formation that is roughly eV/formula unit better than the SQS system, representing the disordered fluorite structure. Closer examination of Evac,f with regard to the tetrahedral surrounding of the O-vacancy shows the following order of increasing stability:
This shows there is a clear correlation between the number of Ce ions in the surrounding tetrahedron and Evac,f. This result is independent of the introduced Coulomb correction, and results for both PBE and PBE+U functionals in an improvement of Evac,f with eV, going from the least to the most stable configuration. This also means that ordered structures containing Ce tetrahedra show large stability when the O-vacancies are enclosed in these Ce tetrahedra. On the other hand, structures with no Ce in the tetrahedron surrounding the O-vacancy show poor stability (Compare the LZO 4Ce and LZO 4La structures in Table 2. In both cases the cations have a pyrochlore geometry). Due to this stability trend for O-vacancy positions, it is clear why the disordered fluorite structure (i.e. SQS) is less favorable than ordered structures. Because of the random nature of the disordered fluorite structure, fewer pure Ce tetrahedra are present. In addition, because of their random distribution, the O-vacancies are also placed in less favorable surroundings than could be the case in ordered structures.
Irrespective of the correlation between Evac,f and the number of Ce cations in the tetrahedral O-vacancy surrounding, there still appears to be quite some variation in formation energies for the same surrounding when comparing the two CeLa structures in Table 2. These two systems differ in two aspects: the inter-vacancy distance and the coordination of the cations in the system. This leads to the question which of both is responsible for the difference in vacancy formation energy.
| La positions | O-vacancies | space group | |
| p222 L NV | 1, 2, 5, 6 | P4/mmm | |
| p222 L 2Ce2La | 1, 2, 5, 6 | 1, 6 | Imma |
| L111 3Ce1La A | 1, 6, 7, 8 | 15, 16 | Rm |
| L111 3Ce1La B | 1, 6, 7, 8 | 1, 7 | Pm |
| L111 3Ce1La C | 1, 6, 7, 8 | 7, 9 | C2/m |
| Ce-Coord. | PBE | PBE+U | |||||
| ()-fold | Hf | Evac,f | dvac-vac | Hf | Evac,f | dvac-vac | |
| (%) | (eV) | (eV) | (Å) | (eV) | (eV) | (Å) | |
| p222 L NV | () | 1.178 | 1.281 | ||||
| p222 L 2Ce2La | () | 1.007 | -0.171 | 1.115 | -0.166 | ||
| c111 L 2Ce2La | () | 0.758 | -0.419 | 0.800 | -0.480 | ||
| L111 3Ce1La A | () | 0.452 | -0.717 | 0.668 | -0.896 | ||
| L111 3Ce1La B | () | 0.072 | -1.097 | 0.198 | -1.366 | ||
| L111 3Ce1La C | () | 0.123 | -1.046 | 0.263 | -1.301 | ||
| PBE | PBE+U | |||||||
| V | a | a | V | a | a | |||
| vs CeO2 | vs NV | vs CeO2 | vs NV | |||||
| (%) | (Å) | (%) | (%) | (%) | (Å) | (%) | (%) | |
| c111 L NV | 8.044 | 5.606 | 2.613 | 7.945 | 5.609 | 2.581 | ||
| c111 L 2Ce2La | -1.260 | 5.582 | 2.180 | -0.422 | -1.631 | 5.579 | 2.021 | -0.547 |
| p222 L NV | 8.080 | 5.606 | 2.624 | 7.947 | 5.609 | 2.582 | ||
| p222 L 2Ce2La | -1.281 | 5.582 | 2.184 | -0.429 | -1.725 | 5.577 | 1.989 | -0.578 |
| LZO NV | 8.328 | 5.611 | 2.702 | 8.479 | 5.618 | 2.750 | ||
| LZO 2Ce2La | -0.668 | 5.598 | 2.473 | -0.223 | -1.533 | 5.590 | 2.222 | -0.514 |
| LZO 4Ce | 0.108 | 5.613 | 2.739 | 0.036 | -0.228 | 5.614 | 2.672 | -0.076 |
| LZO 4La | -2.889 | 5.556 | 1.704 | -0.973 | -3.793 | 5.547 | 1.434 | -1.281 |
| L111 NV | 8.253 | 5.609 | 2.679 | 8.639 | 5.621 | 2.800 | ||
| L111 3Ce1La A | -0.292 | 5.604 | 2.579 | -0.097 | -1.045 | 5.602 | 2.441 | -0.350 |
| L111 3Ce1La B | -0.081 | 5.608 | 2.651 | -0.027 | -0.889 | 5.605 | 2.495 | -0.297 |
| L111 3Ce1La C | 0.299 | 5.615 | 2.781 | 0.099 | -0.459 | 5.613 | 2.643 | -0.153 |
| L111 1Ce3La | -1.736 | 5.577 | 2.081 | -0.582 | -2.774 | 5.569 | 1.841 | -0.933 |
| SQS NV | 8.530 | 5.614 | 2.766 | 9.173 | 5.630 | 2.969 | ||
| SQS | -0.020 | 5.614 | 2.759 | -0.007 | -1.285 | 5.606 | 2.526 | -0.430 |
We have studied two sets of additional systems, given in Table 3, to further investigate the influence of these aspects. The first set consists of the p L structure. This is the L distribution of the cations but this time constructed using a p222 unit cell (cf. Fig. 1 and Table 3). The O-vacancies are placed at opposing sides of a single Ce cation,[46] reducing the inter-vacancy distance by about Å compared to the c111 L structure. At the same time, the coordination changes from 7-fold coordination for all cations in the c111 L structure to 6-fold coordination for half the Ce and half the La ions and 8-fold coordination for the remaining cations in the p222 L structure. A second set of structures consists of L CeLa B and C (cf. Table 3), where the former L CeLa structure will be referred to as L CeLa A. Table 4 gives the energies, inter-vacancy distances and Ce-coordination for these systems.
Comparing L structures in Tables 2 and 4 shows that the heat of formation, Hf, is exactly the same, as it should be, when no vacancies are present. However, with O-vacancies included, there is a significant difference in Evac,f of eV. This difference between the c and p L CeLa systems is related to their different vacancy configurations. Comparing the three CeLa systems studied, we find that both systems with half the Ce ions 6-fold coordinate are eV less stable than the third system (c111 L 2Ce2La), without 6-fold coordinate Ce.
The three L CeLa configurations can also be used to distinguish the effects of distance and coordination. Due to the three different inter-vacancy distances and the same Ce coordination for the B and C structures one can consider following scenarios: If a large O-vacancy distance is beneficial to the system then the O formation energies should be ranked ABC, with A the best configuration. Contrary, if the opposite is the case, namely clustering or coalescing of the vacancies is beneficial, the C case should be the best structure, giving rise to a ranking CBA. In both these scenarios the Ce coordination is assumed to have little or no influence.
If on the other hand the inter-vacancy distance has little or no influence and the reduced number of -fold coordinate Ce cations causes the decreased vacancy formation energy, then the B and C case should be (nearly) degenerate and more stable than the A case. The resulting ranking should then be ABC.
Comparing the energies in Table 2 and 4 we see a significant improvement ( eV) in the heat of formation and O-vacancy formation energy for the B and C configurations compared to A. This change is comparable to the one found for the L 2Ce2La structures. Table 4 also shows the B and C configurations to be roughly degenerate. This shows that the improved energetics originate from the third scenario described above. The reduced number of -fold coordinate Ce ions causes a significant improvement of the formation energy Evac,f. Upon closer examination we also notice that the B configuration is slightly more stable ( eV) than the C configuration, showing that also the O-vacancy distance plays a role, albeit a minor one, and, more importantly, that the vacancies repel each other.
The results of this section also give us some additional understanding on the structure of LaxCe1-xO2-x/2. The above calculations show that for La2Ce2O7 the Ce atoms prefer to cluster in tetrahedra around the O-vacancies, or vice versa, the O-vacancies prefer to appear inside Ce tetrahedra. If we assume that this behavior is also valid for LaxCe1-xO2-x/2, then the transformation of CeO2 to La2Ce2O7 can be understood as follows: For low La concentrations, and thus low O-vacancy concentrations, the vacancies, imbedded in Ce tetrahedra, will be distributed homogeneously throughout the CeO2 fluorite structure. With increasing La concentration the number of available Ce cations for Ce tetrahedra reduces while the number of O-vacancies increases. For a system where the cations are randomly distributed this means that at La concentrations of % there are too few Ce-tetrahedra available to accommodate all the O-vacancies. This seems to coincide with the experimentally observed discontinuity in the lattice parameter observed by Bae et al.[8] As a result, the attraction between Ce cations and O-vacancies can thus be seen as the driving force for order in the La2Ce2O7 system. Such a link between the ordering of the cation and anion sub-latices is also found for other pyrochlores.[47] The resulting geometry at % Ce substituted by La, is then expected to be a highly ordered structure containing Ce tetrahedra surrounding the O-vacancies. This makes the pyrochlore geometry a very likely candidate for the La2Ce2O7 geometry.
III.2 Lattice parameter
In addition to the energies, we also investigated the cell volume and lattice parameter. Table 5 shows the expansion and contraction of the system compared to the pure CeO2 fluorite structure. Most configurations studied show small distortions of the lattice vectors compared to the cubic fluorite lattice. Only the LZO NV, 4Ce, and 4La configurations retained a cubic lattice.
Because the distortions of the different system lattices are all slightly different, it is impossible to extract a (consistent) lattice parameter from their basis vectors. However, since the distortions are relatively small, less than for the lattice vector angles, and less than % for the lattice vector lengths, we instead choose to use a fictitious lattice parameter, which is determined as the edge of a cube containing a single formula unit, with the same mass density as the actual crystal.
Comparing the results in Table 5 shows the Coulomb corrections to have only limited influence on the geometry. Compared to the CeO2 fluorite system, the La2Ce2O7 systems without vacancies are roughly % larger in volume. The introduction of O-vacancies causes a small contraction of the lattice parameter of a few tenth of a percent compared to the NV systems. This contraction appears to be correlated to the amount of Ce atoms present in the tetrahedral vacancy surrounding; more Ce results in less contraction. This behavior can be understood as a consequence of the increase in ionic radius known for the CeIV CeIII transition.[48, 49]
It is also interesting to note that for the L111 3Ce1La cases the lattice parameter seems to increase with decreasing O-vacancy distance, in contrast to what is intuitively expected.
Looking at the three most stable configurations with regard to Evac,f of the previous section (LZO 4Ce, L111 3Ce1La B and C), we find that these are also the three systems having the largest lattice parameter. Their lattice parameter is Å, which is larger than the normal CeO2 fluorite structure. This is in good agreement with the experimentally observed value of Å for the La2Ce2O7 lattice parameter.[15, 9, 8, 50, 51]
It also shows good agreement with the experimentally observed relative expansion of % by Ryan et al. and Bellière et al.[20, 50]
In addition, the pyrochlore structure LZO 4Ce is the only one of these three structures which retained a perfect cubic lattice, as expected from experiment for La2Ce2O7.[15]
III.3 X-Ray diffraction


An important argument in the discussion on the structure of La2Ce2O7 is its XRD spectrum. The differences between the CeO2 fluorite and a prototypical pyrochlore spectrum are very small and mainly related to the presence of the low intensity peaks of the pyrochlore (), (), and () reflections.[8, 9, 53] The strong similarity between the CeO2 and pyrochlore spectra is due to the nearly equal X-ray scattering factors of La and Ce.[15] As a result very sensitive XRD experiments are required if one is to observe the low intensity peaks indicative of the pyrochlore structure of La2Ce2O7.
To address this point in the discussion, we calculated XRD spectra for all structures studied. Figure 3 shows calculated spectra of the SQS (disordered fluorite) and LZO 4Ce (pyrochlore) geometries in comparison to an experimental powder XRD spectrum of La2Ce2O7.[52] The experimental spectrum shows nine clear peaks that can be identified with the fluorite peaks of CeO2, no small secondary pyrochlore peaks are visible. This is in line with the XRD spectra of La2Ce2O7 generally presented in literature. The two calculated spectra in Fig. 3 represent the spectra of the two possible structures for the La2Ce2O7 structure. In both calculated spectra the nine experimental peaks are clearly visible and their position is still within of the experimental position for the high angle peaks. Furthermore, no additional peaks with intensities % are visible in the calculated spectra.
It is interesting to note that even if a pyrochlore geometry is used, the typical pyrochlore peaks appear to be lacking. However, closer examination of the numerical data shows these peaks to be present, albeit at a much lower intensity than would be expected from other pyrochlore systems such as for example La2Zr2O7. The (311), (331) and (511) peaks have an intensity of % or less (cf. inset Fig. 3). This explains why these peaks are not generally observed in experiments, but only in case of long time step scans.[8] This might lead to an erroneous assignment of the disordered fluorite structure to La2Ce2O7. The SQS structure on the other hand presents a large number of very small secondary reflections. Though they might not be clearly distinguishable in experiments, they should introduce a noticeable additional background (cf. inset Fig. 3). This should be especially clear in experiments where increasing La concentrations in LaxCe1-xO2-x/2 are investigated. However, such experiments do not mention such behavior.[8, 20]
A thorough comparison of the nine high intensity peaks also favors the pyrochlore (LZO 4Ce) over the disordered fluorite (SQS) structure, as geometry for La2Ce2O7. The relative peak heights of the former match the experimental peak heights much closer, as is shown in Fig. 4. We chose not to scale the spectra using the highest intensity peak since it appears to be overestimated for both geometries. By using a different peak as scaling reference the good correlation of the relative peak heights, with the experimental spectrum becomes much clearer.

As a final note, it is interesting to mention that the four high angle peaks, can also be used to exclude the other structures studied in this work. This is because of the broadening of those peaks due to multiple splitting. As a consequence, the two peaks between and merge into a near continuous set of peaks spread over a range of in case of the L111 structures, and nearly in case of the L structures. Two examples are given in Fig. 5. No simple peaks, as present in the curves of Fig. 3 are observed for those structures.
IV Conclusion
In this paper the geometry of La2Ce2O7 was studied using ab initio DFT calculations. Ordered and disordered structures were compared, modeling the pyrochlore and the disordered fluorite structures proposed for this system. Three aspects are taken into consideration: the lattice parameter, the enthalpy of formation and the XRD spectrum.
The calculated lattice parameters and relative lattice expansion of both the pyrochlore and disordered fluorite geometry are found to be in good agreement with the experimentally observed values. Of these the pyrochlore structure retained a perfect cubic lattice, while the disordered fluorite structure showed a small distortion.
Charge compensating O-vacancies are shown to play a crucial role in the stability of La2Ce2O7. If no O-vacancies are present (i.e. La2Ce2O8) the disordered fluorite structure is the most stable geometry. However, if O-vacancies are included in the system, then the pyrochlore structure becomes the most stable geometry. So, in contrast to what is generally assumed in literature, La2Ce2O7 is predicted to have a pyrochlore rather than a disordered fluorite geometry.
Total energy calculations have also shown a clear preference of the O-vacancies to be centered in Ce tetrahedra. This might be seen as a driving force in the formation of a pyrochlore geometry during La2Ce2O7 formation. The formation of La2Ce2O7, however, is beyond the scope of this work, and is, as such, a topic for further research.
The third aspect, the XRD spectra, show for both the disordered fluorite and pyrochlore geometry the nine distinct high intensity peaks observed for La2Ce2O7 in experiment. Although the peak positions are in excellent agreement with the experimental positions, only the pyrochlore geometry presents relative peak intensities that are in good agreement with the experimental ones. Furthermore, the pyrochlore geometry also presents the typical pyrochlore reflection peaks, albeit with a lower intensity than expected from other pyrochlores.
Finally, both formation energies and calculated XRD spectra show a highly ordered structure to be preferred over a disordered structure, as model for the La2Ce2O7 system. Of the structures considered in this work, the pyrochlore geometry is clearly favorable over the disordered fluorite geometry.
V Acknowledgement
We would like to thank Olivier Janssens and Vyshnavi Narayanan for the XRD measurements. The research was financially supported by FWO-Vlaanderen, project n∘ G. N. We also acknowledge the Research Board of the Ghent University. All calculations were carried out using the Stevin Supercomputer Infrastructure at Ghent University. XRD measurements were carried out under the Interuniversity Attraction Poles Programme IAP/VI- (INANOMAT) financed by the Belgian State, Federal Science Policy office.
References
- [1] E. Zintl and U. Croatto, Z. Anorg. Allg. Chem. 242, 79 (1939).
- [2] F. Deganello and A. Martorana, J. Solid State Chem. 163, 527 (2002).
- [3] F. Deganello, A. Longo, and A. Martorana, J. Solid State Chem. 175, 289 (2003), ISSN 0022-4596.
- [4] M. Reddy, Benjaram, L. Katta, and G. Thrimurthulu, Chem. Mater. 22, 467 (2010).
- [5] S. Liang, E. Broitman, Y. Wang, A. Cao, and G. Veser, J. Mater. Sci. 46, 2928 (2011).
- [6] H. L. Tuller and A. S. Nowick, J. Electrochem. Soc. 122, 255 (1975).
- [7] T. Kudo and H. Obayashi, J. Electrochem. Soc. 122, 142 (1975).
- [8] J. S. Bae, W. K. Choo, and C. H. Lee, J. Eur. Ceram. Soc. 24, 1291 (2004).
- [9] X. Cao, R. Vassen, W. Fischer, F. Tietz, W. Jungen, and D. Stover, Adv. Mater. 15, 1438 (2003).
- [10] W. Ma, S. Gong, H. Xu, and X. Cao, Scripta Mater. 54, 1505 (2006).
- [11] X. Q. Cao, R. Vassen, and D. Stoever, J. Eur. Ceram. Soc. 24, 1 (2004).
- [12] I. Van Driessche, G. Penneman, E. Bruneel, and S. Hoste, Pure Appl. Chem. 74, 2101 (2002).
- [13] I. Van Driessche, G. Penneman, J. S. Abell, E. Bruneel, and S. Hoste, Thermec’2003, parts – 426-4, 3517 (2003).
- [14] I. Van Driessche, G. Penneman, C. De Meyer, I. Stambolova, E. Bruneel, and S. Hoste, in Euro Ceramics VII, PT 1-3 (2002), vol. 206-2 of Key Engineering Materials, pp. 479–482.
- [15] F. Brisse and O. Knop, Can. J. Chem. 45, 609 (1967).
- [16] L. Minervini, R. W. Grimes, and K. E. Sickafus, J. Am. Ceram. Soc. 83, 1873 (2000).
- [17] H. Yamamura, H. Nishino, K. Kakinuma, and K. Nomura, J. Ceram. Soc. Jpn 111, 902 (2003).
- [18] H. Yamamura, H. Nishino, and K. Kakinuma, J. Ceram. Soc. Jpn 112, 553 (2004).
- [19] D. Chambonnet, D. Keller, and C. Belouet, Physica C 302, 198 (1998).
- [20] K. M. Ryan, J. P. McGrath, R. A. Farrell, W. M. O’Neill, C. J. Barnes, and M. A. Morris, J. Phys. Condens. Matter 15, L49 (2003).
- [21] W. M. O’Neill and M. A. Morris, Chem. Phys. Lett. 305, 389 (1999).
- [22] G. Bergerhoff and I. D. Brown, in Crystallographic Databases, edited by F. H. Allen, G. Bergerhoff, and R. Sievers (International Union of Crystallography, Chester, 1987), vol. 77.
- [23] A. Belsky, M. Hellenbrandt, V. L. Karen, and Luksch, Acta Cryst. B 58, 364 (2002).
- [24] F. W. Bezerra Lopes, C. P. de Souza, A. M. Vieira de Morais, J.-P. Dallas, and J.-R. Gavarri, Hydrometallurgy 97, 167 (2009).
- [25] C. Jiang, C. R. Stanek, K. E. Sickafus, and B. P. Uberuaga, Phys. Rev. B 79, 104203 (2009).
- [26] N. J. Ramer and A. M. Rappe, Phys. Rev. B 62, R743 (2000).
- [27] D. Lerch, O. Wieckhorst, G. L. W. Hart, R. W. Forcade, and S. Mueller, Modell. Simul. Mater. Sci. Eng. 17 (2009).
- [28] J. Sanchez, F. Ducastelle, and D. Gratias, Physica A 128, 334 (1984).
- [29] A. Zunger, S.-H. Wei, L. G. Ferreira, and J. E. Bernard, Phys. Rev. Lett. 65, 353 (1990).
- [30] S.-H. Wei, L. G. Ferreira, J. E. Bernard, and A. Zunger, Phys. Rev. B 42, 9622 (1990).
- [31] A. V. Ruban, S. I. Simak, S. Shallcross, and H. L. Skriver, Phys. Rev. B 67, 214302 (2003).
- [32] P. E. Blöchl, Phys. Rev. B 50, 17953 (1994).
- [33] G. Kresse and D. Joubert, Phys. Rev. B 59, 1758 (1999).
- [34] G. Kresse and J. Hafner, Phys. Rev. B 47, 558 (1993).
- [35] G. Kresse and J. Furthmüller, Phys. Rev. B 54, 11169 (1996).
- [36] J. P. Perdew, K. Burke, and M. Ernzerhof, Phys. Rev. Lett. 77, 3865 (1996).
- [37] A. Svane, Phys. Rev. B 53, 4275 (1996).
- [38] N. V. Skorodumova, R. Ahuja, S. I. Simak, I. A. Abrikosov, B. Johansson, and B. I. Lundqvist, Phys. Rev. B 64, 115108 (2001).
- [39] M. Nolan, S. Grigoleit, D. C. Sayle, S. C. Parker, and G. W. Watson, Surface Science 576, 217 (2005).
- [40] S. Fabris, S. de Gironcoli, S. Baroni, G. Vicario, and G. Balducci, Phys. Rev. B 71, 041102 (2005).
- [41] D. A. Andersson, S. I. Simak, B. Johansson, I. A. Abrikosov, and N. V. Skorodumova, Phys. Rev. B 75, 035109 (2007).
- [42] C. Loschen, J. Carrasco, K. M. Neyman, and F. Illas, Phys. Rev. B 75, 035115 (2007).
- [43] J. L. F. Da Silva, Phys. Rev. B 76, 193108 (2007).
- [44] C. W. M. Castleton, J. Kullgren, and K. Hermansson, J. Chem. Phys. 127, 244704 (pages 11) (2007).
- [45] I. Yeriskin and M. Nolan, J. Phys.: Condens. Matter 22, 135004 (2010).
- [46] The two O-vacancies, at positions and of the p222 cell shown in Fig. 1A, are located, due to periodic boundary conditions, at opposing sides of the La site 2, the Ce site 3, the La site 5, and the Ce site 8. This causes half the Ce cations of the system to have two neighboring O-vacancies, and half the Ce cations to have no neighboring O-vacancies. In contrast, every Ce cation in the c111 L system (cf. Fig. 1B) has exactly one neighboring O-vacancy.
- [47] J.-P. Crocombette and A. Chartier, Nucl. Instrum. Methods Phys. Res., Sect. B 255, 158 (2007).
- [48] R. D. Shannon, Acta Cryst. A32, 751 (1976).
- [49] J. D. Van Horn, Electronic Table of Shannon Ionic Radii (2001), downloaded 08/13/2010, URL http://v.web.umkc.edu/vanhornj/shannonradii.htm.
- [50] V. Bellière, G. Joorst, O. Stephan, F. M. F. de Groot, and B. M. Weckhuysen, J. Phys. Chem. B 110, 9984 (2006).
- [51] B. C. Morris, W. R. Flavell, W. C. Mackrodt, and M. A. Morris, J. Mater. Chem. 3, 1007 (1993).
- [52] V. Narayanan, D. E. P. Vanpoucke, P. Lommens, E. Bruneel, K. De Buysser, and I. Van Driessche, to be submitted (2011).
- [53] H. Yamamura, H. Nishino, K. Kakinuma, and K. Nomura, Solid State Ionics 178, 233 (2007).