Self assembly of monodisperse CdS nano-cylinders with a pore.
Abstract
We present our conclusions of the investigation of the self assembly and growth of an array of nanotubes: a consequence of a fine balance of directed motion, diffusion and aggregation of reacting and ions. In a previous communication [1], we identified the mechanism of a unexpected growth of a very uniform nano-cylinder from the end of a nano-channel. Furthermore, the cylinder had a pore along the axis but were closed at one end. This unique phenomenon of self assembly of monodisperse CdS nano-cylinders had been observed in a rather simple experiment where two chambers containing 0.1 M and 0.1 M solutions were joined by an array of anodized aluminium oxide (AAO) nano-channels [2]. Interestingly, the growth of CdS nano-tubes was observed only in the -chamber. Our previous study focussed on identifying the principles governing the growth of a single nano-tube at the exit point of a single AAO-nano-channel. In this communication, we identify factors affecting the self-assembly of a nano-tube in the presence of neighbouring nano-tubes growing out an array of closely spaced AAO nano-channel exits, a study closer to experimental reality. Our model is not or specific, and our conclusions suggest that the experimental scheme can be extended to self assemble a general class of reacting-diffusing A and B ions with A (in this case ) selectively migrating out from a nano-channel. In particular, we note that after the initial prolonged growth of nanotubes, there can arise a severe deficiency of B-ions () ions near the AAO-nano-channel exits, the points where the reaction and aggregation occurs to form the nanotube, thus impeding further growth of uniform CdS nano-tubes. We further identify the parameters which can be tuned to obtain an improved crop of monodisperse nanotubes. Thereby we predict the necessary characteristics of reacting systems which can be self assembled using suitable adaptations of experiments used to grow CdS cylinders.
Keywords:
self-assembling nano-structures in flow.pacs
05.60.+b,05.70.Ln,68.43.Jk,61.46.-wControlled self assembly of micron to nanometer sized structures of different morphologies has been at the forefront of research interests for over a decade spanning disciplines of physics, chemistry and even biology [3, 4, 5, 6, 7, 8]. Recently, a very simple experiment produced the unexpected growth of very uniform Cadmium sulphide (CdS) nano-structures of rather unique morphology as was reported by Varghese and Datta [2]. The authors took M and M solutions in two different chambers and allowed them to come into contact with each other through some Anodized Aluminium oxide (AAO) nano-channels. The diameter of AAO nano-cylinders was was varied from nm to nm. The radial dimension of the AAO nano-channels are significantly larger than the ionic dimensions as well as the Bjerrum length ( at room temperature), thereby the authors expected the nano-channels to get clogged by CdS precipitate formed by diffusing and reacting and ions inside the AAO nano-channel.
Contrary to their expectations, cylindrical CdS nano-tubes with a pore along the center of the cylinder but closed at one end were found to grow outwards from the ends of the AAO nano-channels. The diameter of the CdS nano-cylinders were of the same order as that of the AAO nano-channels (N-C for brevity), SEM photos of the CdS nano-cylinders can be found in reference [2]. Furthermore, the CdS nano-structures were found to grow in the chamber only and never in the chamber. The nano-tubes (N-T in short) with a pore continued to grow in the chamber even if the surface charge on the AAO N-C was reversed during the preparation, clearly establishing that the selective migration of from the to chamber is not a simple electrostatic potential effect in the presence of ionic screening or otherwise. Traces of are not found in the chamber indicating ions do not migrate to the chamber through the AAO N-C. However as a control experiment, if the solution is replaced by a chamber of pure water connected to the M solution, one does detect ions in chamber containing pure water. One can conclude that it is not just AAO-specific properties which prevent ions from migrating to the chamber. Further experiments by concerned researchers are needed before one can chose one of the following scenarios (amongst many others) as a possible cause of selective transport of : (a) capillary action induced by chemical potential difference in the two chambers leading to directed motion of solution (b) formation of different-sized large hydrated and ion-clusters with very different diffusivities (c) AAO N-C induced low density of ions inside the channel, thereby, increasing the effective charge screening length.
The other surprising aspect of the experimental observations is the unexpected morphology of the nanotubes formed. What could be the physical conditions at the exit of the AAO-nanochannel that a cylinder with a pore along the center and closed at one end would be formed, each cylinder jutting out from the AAO N-C ends ? This question was investigated in a previous paper of ours, where the main focus was on the growth of a single N-T in the chamber by exiting from a isolated AAO N-C. These ideas are applicable to a general class of reacting-diffusing and aggregating-precipitating chemical species, and hence for the rest of the discussion we shall refer of ions are A, ions as B; thereby , where CdS C. ions remains passive in the model of the process and will not be explicitly considered in the rest of the paper.
The key ingredient to understand the observed morphology of cylinders with a pore is the assumption that A particles exit the N-C with a finite velocity to enter a bath of B-ions. Such selective transport of fluids through a nano-pore is not a unreasonable assumption to make [9]. These A-ions then meet the diffusing B-ions to form C, which in turn diffuse around a bit before they find an appropriate site in the forming C-aggregate. At times of the growth process, A ions meet lots of B, thereby react and aggregate to form a plug of C which is pushed ahead by the pressure of fluid, exiting the N-C. The region between the plug and the N-C exit becomes B-ion scarce thereafter, and is filled in rapidly by the exiting fluid containing A-ions. These then diffuse out to meet the diffusing-in B ions. occurs and aggregation of C forms the walls of the N-T cylinder with a closed plug at one end. These ideas were implemented in a lattice model by us and we obtained cylinders with a pore exactly as seen in experiments. A detailed description can be obtained from reference [1].
The main focus of this rapid communication is the growth of multiple C-nanotubes (N-T) from an array of exit points of AAO N-C. The presence of neigbouring growing N-Ts adds an extra complication to into the phenomenon. The supply of reacting B-ions gets severly depleted near the AAO N-C exit as the reaction proceeds. Diffusion is the principal pathway by which B-ions can move from bulk into the regions near the reaction points close to the N-C exits. In this paper we explore the consequences of the slow diffusion of B and other conditions and criteria which effectively gets imposed to have well formed N-Ts of C particles, with few C-deficient regions within cylinder-walls. This in turn will help experiments to identify and fine tune conditions to self assemble structures from different chemical species separated by a suitably chosen nano-channel.
We very briefly describe the model of self-assembling N-T, this will also help define the various physical quantities relevant for our model. The chamber is modelled as a 3-D lattice of size , and A and B can reside on only discrete points of a lattice. A and B are self-avoiding, however, a diffusing A (or B) ion can hop into a site occupied by B (or A) which then turns into C particle. The probability that a A,B or C particle will attempt a random hop to a neighbouring vacant site (mimicking diffusion) is given by and respectively. The exit points of the N-C (explicitly not modelled) are at , A enters the lattice from different areas of dimension , in turn each of these square exit-areas form a square lattice. This corresponds to N-Cs being arranged in a square lattice in our model for ease of computation, though one can in principle also work with a triangular lattice. The center of from the center of a square to the center of the nearest neighbour square is , and the distance between neighboring N-C walls is . are chosen such that PBC can be maintained in , direction as is varied.
Flow of A is modelled by making A hop a lattice constant to the right (i.e. direction) every iteration (time ) if a vacant site or a site occupied by B is available. Thus the distance hopped in one time step sets the length and time scale of the model. If the lattice site on the right of a about-to-hop A is occupied by another A ion, then the first A tried to “flow” around the A on the right by taking a random step in or direction if suitably vacant. At each time-step, A-ions are replenished with probability at each of lattice-points which constitute the square exits of the N-C at . The initial density of B ions in the lattice is set to be , i.e., is fraction of all lattice points are occupied by B at time . Note however, that if the exit of N-C are already occupied by A, then no new A-s effectively get introduced at the lattice sites at , till they become unoccupied by a hop of A-s in the direction. The number of interations are chosen such that the average length of the N-T at the end of simulation is , i.e. ; thus lower values of correspond to longer simulation runs. Correspondingly for all our runs.


Fig. 1 shows two snapshots of C-particle N-T from our simulations. The radius of the N-C exits are in both figures, however, the distance between the N-C walls are correspondingly are different in Fig. 1 and . For Fig. 1 , the distance between N-C centers is and , whereas for Fig. 1b , and Figure 1(a) shows that the N-Ts are well-formed at one end near the , but the wall has low C-density near , i.e., near the exit of the nano-channel. On the other hand, Fig. 1b, with a higher value of and shows clear and well-formed N-Ts with high density of C along the entire length of the N-T. The reasons for such observations have been discussed earlier: depletion of B-ions supplies near the N-C exits as the reaction and growth of N-T gradually proceeds. A higher value of separation between N-T walls and a higher naturally ensures a better supply of B to the reactant A-ions near the N-C exits leading to better N-Ts, as seen in Fig. 1b.
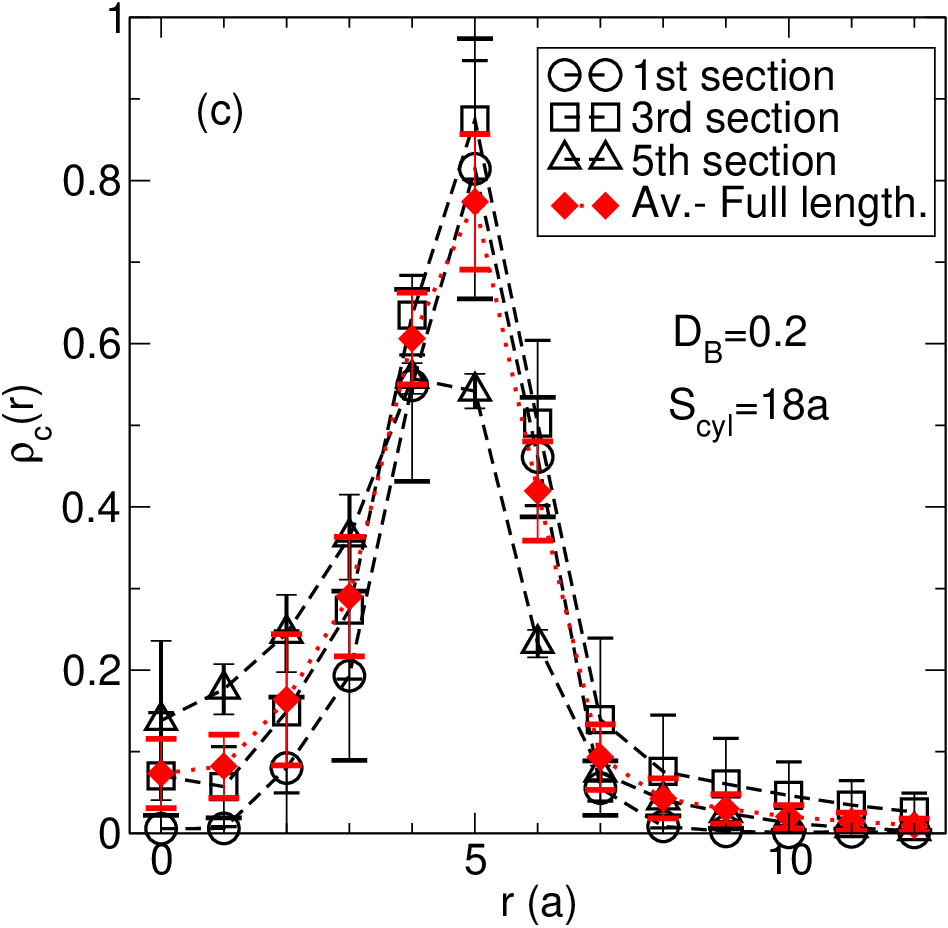
To separate out the effects of varying and in our model we fix a relatively low value of the ratio and vary in subfigures (a), (b) and (c) and plot the average density of as a function of the radial distance from the center of the respective N-Ts. Furthermore, each of the 9 N-Ts are divided into 5 sections along its length, and we calculate and plot the density profile in each section (averaged over the 9 N-Ts) as a function . The quantity has low values near N-T center () but peaks near indicative of the formation of walls of distinct N-T of C with a pore at center, and then decays back nearly to with increase of . A non-zero value of near is indicative of spread of C and the fusion between adjacent N-T, as seen especially for section 4 with . The density profile of section-5 (section containing the closed end and farthest from the NC-exit) is nearly the same for and , but the peak in for section-1 gets progressively higher for larger values. We see a higher density of C in section-4 near in Fig. 2 (b) and (c) because just after the initial phase of flow of A and plug formation, there will be cylinder of surplus A between plug and N-C exit, which will promptly react with B at the surface and aggregate to form N-T walls. This will be followed by B-deficiency leading to lower values of -peak for sections and .


Since the N-T formation by reaction, diffusion and aggregation is critically dependent on the rate of replenishment of A as well as the growth-rate of N-T as compared to the diffusion-rate of B. Hence in Fig. 3 we keep fixed and vary the probabilities and to investigate how the density profile is affected by the variation. Low values of () keeping the ratio fixed fills up the axial of the N-T at with C, as B get more time to diffuse in and react with A. For such cases we obtain solid cylinders as seen in Fig. 3a and b. In Fig. 3b, lowering the rate of replenishment of A by decreasing leads to the shrinking of the radius of N-T seen by the shift in the peak of , whereas, a higher value of ensures an excess of A at the N-C exit which fills up the center of the N-T with A, and so C is excluded from the axial region. Thus a wide tube with a pore at the center is obtained. Moreover, non-zero values of at indicates that this excess A spreads out radially, reacts with B to form C, and gets conjoined with the neighbouring N-T. On the other hand in Fig. 3c with fixed , a low growth rate set by again leads to diffussive spread of excess A exiting the AAO N-C to form C after reacting with B-s at radii , thus again leading to the possibility of fused N-T for . Higher growth rate of N-T lead to the shift in the peak of radially inwards. Thus a balance of the values of and independently are essential for the growth of well-separated distinct N-Ts. Of course experimentally, and are not free parameters as in simulations, but some control and variation over these quantities could be achieved experimentally by playing around with the material of the N-C (in this case AAO) and/or the radius of the N-C.


Next, in Fig. 4a and 4b we observe the change in density profile with varying for two different values of . Higher values of () lead to sharp peaks in the density for at pointing to well separated distinct N-T, refer Fig. 4a. However, increasing leads to diffusive spread of C before setting down to final position within N-T leading to a lower value of maxima of , refer Fig. 4b. But even in this case a large assymetry in the values of and favours high density of C at the N-T walls. There is a jump in the maximum of from to as is changed from to corresponding to change from to , but does not change significantly thereafter. We has shown earlier [1] that is not a amenable condition for good growth of N-T walls, thus a small but finite value of plays a crucial role in the self-assembly.
Figures 4c and 4d focus at the for different sections along the length of the N-Ts for two distinct values of at . The 5th section always has a non-zero density of C at , refer both 4c and 4d. The 3-rd section at the middle of the N-T has a higher density of C than 5th section in Fig. 4d for . Even the 1-st section in Fig. 4d manages a distinct peak corresponding to a dense wall of C particles at . In contrast, we see in Fig. 4c that the 3rd section already feels B-deficiency near the N-C exit for , with lower values of in section-3 than section-5. The values of are close to zero in the 1-st section near N-C exit, indicating an acute scarcity of B-ions. We see also a significant spread in the density profile of at sections and , thus forming fused N-Ts.
The plots of Fig. 5 further analyze the data of Fig.4a, but with added perspective of having two different values of for and . For and in Fig. 5a, the 5th and 3rd section shows a peak around , but for section-2 has a wider spread than for section-5, indicating that A has to diffuse further out before it meets B to form C. Section-1 of Fig. 5a shows low values of , but for in Fig. 5b for all sections show a significant jump in value. Moreover, the ratio of the maximum-values of for section-1 and 5 is lower for Fig. 5b, indicating relatively uniform densitites along the length of the N-Ts. The growth of N-Ts of uniform densities is further improved in Fig. 5c and d for with at the walls. The values of the maxima of is nearly the same in both Fig. 5c and d. This is in contrast with Fig. 5a and b, where the peak in the average (over all sections) is higher in Fig. 5b compared to a. Higher values of B-diffusivities ensure a good supply of B from bulk, thereby in Fig. 5c and d do not crucially depend on -values. Of course, distinct N-Ts of (nearly) uniform densities do not form for .



In conclusion, a improved crop of self-assembling (C) nano-tubes can be obtained by increasing the distance between the N-Cs in the AAO template. This allows larger amounts of (B) to diffuse in between the growing CdS N-Ts. Alternatively, a lower rate of inflow of A () ions into the B () chamber promotes uniform growth, but have to be suitably balanced by growth rate , else one obtains solid cylinders without a axial pore, or else, fused nano-tubes. Furthermore, we predict that good growth of cylindrical C nano-tubes with high-density walls will be occur only when there is marked assymmetry in the diffusion constants of and ions with and a non-zero, small value of . Experimentally, an excess of Cd on the surface of CdS N-Ts have been observed in tune with our expectations [10], but stoichiometric analysis of CdS densities at different sections of the N-Ts are yet to be done.
AC thanks computational facilities of Nano-Science unit at IISER, funded by DST, India: project no. SR/NM/NS-42/2009, and discussions with Shouvik Datta. JK acknowledges the summer research fellowship to visit IISER-Pune provided by IAS, Bangalore, India.
References
- [1] J. Kiruthiga and A. Chatterji, J. Chem. Phys., 138 024905 (2013).
- [2] A. Varghese, S. Datta, Phys. Rev. E., 85, 056104 (2012).
- [3] Intermolecular and Surface Forces, J.N. Israelachvili, 3rd Edition, Academic Press, (2010).
- [4] M. Grzelczak, J. Vermant, E.M.Furst, L.M.Liz-Marzan, ACS-Nano,4,3591 (2010).
- [5] T.A. Witten, Rev. Mod. Phys., 71, S368 (1999).
- [6] A.J. Koch and H. Meinhardt, Rev. Mod. Phys., 66, 1481 (1994).
- [7] M. Einax, W. Dieterich, P. Maass, Rev. Mod. Phys., 85 921 (2013).
- [8] K. Dholakia and P. Zemanek, Rev. Mod. Phys., 82 1767 (2013).
- [9] M. Majumdar, N. Chopra, R. Andrews and B.J. Hinds, Nature, 438, 44, (2005).
- [10] Private communications with Shouvik Dutta.