跳到论文正文
W Papers独立论文阅读器 arXiv:1310.6142 论文正文 计算阅读时间 · 0%
引用这篇论文根据当前论文元数据生成,正式投稿前建议核对。


License: arXiv.org perpetual non-exclusive license
arXiv:1310.6142v1 [hep-ex] 23 Oct 2013

[Uncaptioned image] August 24, 2026

Longke LI11 1 Supported by National Natural Science Foundation of China(No.10935008 and No.10875115)
on behalf of Belle Collaboration

Department of Modern Physics
University of Science and Technology of China, Hefei, China

In these proceedings, we give a summary of the experimental results from CLEO, Belle, BaBar and CDF collaboration about D0−D¯0D^{0}-\overline{D}^{0} mixing and CP violation in self-conjugated-three-body decays D0→KS0​h​hD^{0}\rightarrow K_{S}^{0}hh (where hh can be π\pi or KK). We report preliminary results of measurement of D0−D¯0D^{0}-\overline{D}^{0} mixing and indirect CP violation in D0→KS0​π+​π−D^{0}\rightarrow K_{S}^{0}\pi^{+}\pi^{-} decays using full data sample collected by Belle detector at KEKB asymmetric-energy e+​e−e^{+}e^{-} collider: give values for x=(0.56±0.19−0.09−0.09+0.03+0.06)%x=(0.56\pm 0.19^{+0.03+0.06}_{-0.09-0.09})\%, y=(0.30±0.15−0.05−0.06+0.04+0.03)%y=(0.30\pm 0.15^{+0.04+0.03}_{-0.05-0.06})\%, |q/p|=0.90−0.15−0.04−0.05+0.16+0.05+0.06|q/p|=0.90^{+0.16+0.05+0.06}_{-0.15-0.04-0.05} and arg⁡(q/p)=−6±11−3−4+3+3​()\arg(q/p)=-6\pm 11^{+3+3}_{-3-4}(). We also report results of recent measurement searching for CP violation in D0→KS0​π+​π−D^{0}\rightarrow K_{S}^{0}\pi^{+}\pi^{-} decays by CDF collaboration using 6.0​f​b−16.0~fb^{-1} of data collected in p​p¯p\overline{p} collisions at Tevatron. The phase-space-integrated CP asymmetry is measured to be AC​P=(−0.05±0.57±0.54)%A_{CP}=(-0.05\pm 0.57\pm 0.54)\% and the CP symmetry is also found to be conserved in all individual intermediate contributions.

PRESENTED AT

The 6th International Workshop on Charm Physics
(CHARM 2013)
Manchester, UK, 31 August – 4 September, 2013

1 Introduction and Mixing formalism

The phenomenon of D0−D¯0D^{0}-\overline{D}^{0} mixing has been of great interest since Belle collaboration at KEK and BaBar collaboration at SLAC reported evidence for it in 2007 [1, 2]. This year LHCb collaboration reported first observation of the D0−D¯0D^{0}-\overline{D}^{0} oscillations from a single measurement with significance corresponding to 9.1 standard deviations [3].

The two mass eigenstates D1D_{1} and D2D_{2}, different to flavor eigenstates, are given by

|D1,2⟩=p⁡|D0⟩±q⁡|D¯0⟩\displaystyle|D_{1,2}\rangle=p|D^{0}\rangle\pm q|\overline{D}^{0}\rangle (1)

where |p|2+|q|2=1|p|^{2}+|q|^{2}=1 holds and CPT invariance has been assumed. The mixing parameters xx and yy in neutral DD meson system are defined as

x≡M2−M1Γ,y≡Γ2−Γ12​Γ.\displaystyle x\equiv\frac{M_{2}-M_{1}}{\Gamma},~y\equiv\frac{\Gamma_{2}-\Gamma_{1}}{2\Gamma}. (2)

where M1,2M_{1,2} and Γ1,2\Gamma_{1,2} are the mass and width of D1,2D_{1,2} and Γ=(Γ1+Γ2)/2\Gamma=(\Gamma_{1}+\Gamma_{2})/2.

The proper time evolution of the mass eigenstates is |D1,2​(t)⟩=e1,2​(t)​|D1,2⟩|D_{1,2}(t)\rangle=e_{1,2}(t)|D_{1,2}\rangle, where e1,2​(t)=e−i⁡(M1,2−(i​Γ1,2/2))​te_{1,2}(t)=e^{-i(M_{1,2}-(i\Gamma_{1,2}/2))t}. A state, which is prepared as a flavor eigenstate |D0⟩|D^{0}\rangle or |D¯0⟩|\overline{D}^{0}\rangle at t=0t=0, will evolve according to

|D0​(t)⟩\displaystyle|D^{0}(t)\rangle =\displaystyle= 12​p​[p⁡(e1​(t)+e2​(t))​|D0⟩+q⁡(e1​(t)−e2​(t))​|D¯0⟩],\displaystyle\frac{1}{2p}[p(e_{1}(t)+e_{2}(t))|D^{0}\rangle+q(e_{1}(t)-e_{2}(t))|\overline{D}^{0}\rangle],
|D¯0​(t)⟩\displaystyle|\overline{D}^{0}(t)\rangle =\displaystyle= 12​q​[p⁡(e1​(t)−e2​(t))​|D0⟩+q⁡(e1​(t)+e2​(t))​|D¯0⟩].\displaystyle\frac{1}{2q}[p(e_{1}(t)-e_{2}(t))|D^{0}\rangle+q(e_{1}(t)+e_{2}(t))|\overline{D}^{0}\rangle]. (3)

The decay amplitude for three-body D0​(D¯0)→KS0​h+​h−D^{0}(\overline{D}^{0})\rightarrow K_{S}^{0}h^{+}h^{-} decays, 𝒜⁡(𝒜¯)​(m+2,m−2){\cal{A}}({\cal\overline{A}})(m^{2}_{+},m^{2}_{-}), depends on two kinematic variables: m+2=mKS0​π+m^{2}_{+}=m_{K_{S}^{0}\pi^{+}} and m−2=mKS0​π−m^{2}_{-}=m_{K_{S}^{0}\pi^{-}}. The time-dependent decay amplitude for initially produced D0D^{0} or D¯0\overline{D}^{0} meson is then given by

ℳ⁡(m+2,m−2,t)\displaystyle{\cal{M}}(m^{2}_{+},m^{2}_{-},t) =\displaystyle= 𝒜(m+2,m−2)e1​(t)+e2​(t)2+qp𝒜¯(⇕−∈,⇕+∈)⌉∞(⊔)−⌉∈(⊔)∈,\displaystyle{\cal A}(m_{+}^{2},m_{-}^{2})\frac{e_{1}(t)+e_{2}(t)}{2}+\frac{q}{p}\overline{\cal A}(m_{-}^{2},m_{+}^{2})\frac{e_{1}(t)-e_{2}(t)}{2},
ℳ¯(⇕+∈,⇕−∈,⊔)\displaystyle\overline{\cal{M}}(m^{2}_{+},m^{2}_{-},t) =\displaystyle= 𝒜¯(⇕+∈,⇕−∈)⌉∞(⊔)+⌉∈(⊔)∈+√∐𝒜(⇕−∈,⇕+∈)⌉∞(⊔)−⌉∈(⊔)∈.\displaystyle\overline{\cal A}(m_{+}^{2},m_{-}^{2})\frac{e_{1}(t)+e_{2}(t)}{2}+\frac{p}{q}{\cal A}(m_{-}^{2},m_{+}^{2})\frac{e_{1}(t)-e_{2}(t)}{2}. (4)

The decay rates as function of time are given by squaring the time-dependent amplitudes:

|ℳ|2\displaystyle|{\cal{M}}|^{2} =\displaystyle= |e1​(t)|2​|A1|2+|e2​(t)|2​|A2|2+2​ℛ​[e1​(t)​e2∗​(t)​A1​A2∗]\displaystyle|e_{1}(t)|^{2}|A_{1}|^{2}+|e_{2}(t)|^{2}|A_{2}|^{2}+2{\cal{R}}[e_{1}(t)e_{2}^{*}(t)A_{1}A_{2}^{*}]
=\displaystyle= {|A1|2​e−y​t+|A2|2​ey​t+2​ℛ​[A1​A2∗]​cos⁡(x​t)+2​ℐ​[A1​A2∗]​sin⁡(x​t)}​e−t,\displaystyle\left\{|A_{1}|^{2}e^{-yt}+|A_{2}|^{2}e^{yt}+2{\cal{R}}[A_{1}A_{2}^{*}]\cos(xt)+2{\cal{I}}[A_{1}A_{2}^{*}]\sin(xt)\right\}e^{-t},
|ℳ¯|∈\displaystyle|\overline{\cal{M}}|^{2} =\displaystyle= {|A¯1|2​e−y​t+|A¯2|2​ey​t+2​ℛ​[A¯1​A¯2∗]​cos⁡(x​t)+2​ℐ​[A¯1​A¯2∗]​sin⁡(x​t)}​e−t.\displaystyle\left\{|\overline{A}_{1}|^{2}e^{-yt}+|\overline{A}_{2}|^{2}e^{yt}+2{\cal{R}}[\overline{A}_{1}\overline{A}_{2}^{*}]\cos(xt)+2{\cal{I}}[\overline{A}_{1}\overline{A}_{2}^{*}]\sin(xt)\right\}e^{-t}. (5)

Here tt is in unit of D0D^{0} lifetime. yy modifies the lifetime of certain contributions to the Dalitz plot while xx introduces a sinusoidal rate variation.

2 Measurement Summary

The D0→KS0​h​hD^{0}\rightarrow K_{S}^{0}hh measurements from all experiments are shown in the Table 1. The Heavy Flavor Averaging Group gives D0−D¯0D^{0}-\overline{D}^{0} Dalitz plot results assuming no CP violation: x=(0.419±0.211)%x=(0.419\pm 0.211)\% and y=(0.456±0.186)%y=(0.456\pm 0.186)\% [10].

Exp. Year Data Channel Results
CLEO 2005[5] 9.0​f​b−19.0fb^{-1} h=πh=\pi x=(1.8−3.2+3.4±0.4±0.4)%x=(1.8^{+3.4}_{-3.2}\pm 0.4\pm 0.4)\%
y=(−1.4−2.4+2.5±0.8±0.4)%y=(-1.4^{+2.5}_{-2.4}\pm 0.8\pm 0.4)\%
Belle 2007[6] 540​f​b−1540fb^{-1} h=πh=\pi x=(0.80±0.29−0.07−0.14+0.09+0.10)%x=(0.80\pm 0.29^{+0.09+0.10}_{-0.07-0.14})\%
y=(0.33±0.24−0.12−0.08+0.08+0.06)%y=(0.33\pm 0.24^{+0.08+0.06}_{-0.12-0.08})\%
|q/p|=0.95−0.20−0.09+0.22+0.10|q/p|=0.95^{+0.22+0.10}_{-0.20-0.09}
arg⁡(q/p)=−0.035−0.19+0.17±0.09\arg(q/p)=-0.035^{+0.17}_{-0.19}\pm 0.09
2009[7] 673​f​b−1673fb^{-1} h=Kh=K yC​P=(+0.11±0.61±0.52)%y_{CP}=(+0.11\pm 0.61\pm 0.52)\%
BaBar 2010[8] 469​f​b−1469fb^{-1} h=π/Kh=\pi/K x=(0.16±0.23±0.12±0.08)%x=(0.16\pm 0.23\pm 0.12\pm 0.08)\%
y=(0.57±0.20±0.13±0.07)%y=(0.57\pm 0.20\pm 0.13\pm 0.07)\%
h=πh=\pi x=(+0.26±0.24)%x=(+0.26\pm 0.24)\%
y=(0.60±0.21)%y=(0.60\pm 0.21)\%
h=Kh=K x=(−1.36±0.21)%x=(-1.36\pm 0.21)\%
y=(0.44±0.57)%y=(0.44\pm 0.57)\%
CDF 2012[9] 6.0​f​b−16.0fb^{-1} h=πh=\pi AC​P=(−0.05±0.57±0.54)%A_{CP}=(-0.05\pm 0.57\pm 0.54)\%
Table 1: Self-conjugated decay D0→KS​h​hD^{0}\rightarrow K_{S}hh (here h=Kh=K or π\pi) published measurements from all experiments.

3 CP violation asymmetries measuremt at CDF

In the analysis of time-integrated CP violation asymmetries AC​PA_{CP} in D0/D¯0→KS0​π+​π−D^{0}/\overline{D}^{0}\rightarrow K_{S}^{0}\pi^{+}\pi^{-} from CDF [9], they exploit a large sample of D∗​(2012)±D^{*}(2012)^{\pm} decays using CDF II data with 6.0​f​b−16.0~fb^{-1} of integrated luminosity produced in p​p¯p\overline{p} collision at s=1.96​T​e​V\sqrt{s}=1.96TeV. The neutral DD meson production flavor is determined by the charge of the pion in the D∗⁣+​(2010)→D0​π+D^{*+}(2010)\rightarrow D^{0}\pi^{+} and D∗⁣−​(2010)→D¯0​π−D^{*-}(2010)\rightarrow\overline{D}^{0}\pi^{-} decay (D∗D^{*} tagging).

They use an artificial neural network to distinguish signal and background. The network uses five input variables: the transverse decay length of the D0D^{0} candidate divided by its resolution Lx​y/σLx​yL_{xy}/\sigma_{L_{xy}}(D0D^{0}), the χ2\chi^{2} quality of the D∗⁣+D^{*+} vertex fit, the impact parameter of the pion from the D∗⁣+D^{*+} decay divided by its uncertainty d0/σd0d_{0}/\sigma_{d_{0}}(πD∗⁣+\pi_{D^{*+}}), the transverse momentum of pion from D∗⁣+D^{*+} decay pTp_{T}(πD∗⁣+\pi_{D^{*+}}) and the reconstructed mass of the KS0K_{S}^{0} candidate. The D∗⁣+D^{*+} network training is based on the distribution of mass difference Δ​M=M⁡(KS0​π+​π−​π0)−M⁡(KS0​π+​π−)\Delta M=M(K_{S}^{0}\pi^{+}\pi^{-}\pi^{0})-M(K_{S}^{0}\pi^{+}\pi^{-}) in the range 140<Δ​M<156​M​e​V/c2140<\Delta M<156~MeV/c^{2}. The final neural network output requirement is chosen to maximize S/S+BS/\sqrt{S+B} where SS(BB) is the estimated number of signal(background) events in the signal region estimated from a fit to the MM(KS0​π+​π−K_{S}^{0}\pi^{+}\pi^{-}) distribution. For the Dalitz plot studies, the analysis is restricted to candidates populating two mass range, 1.84<M⁡(KS0​π+​π−)<1.89​G​e​V/c21.84<M(K_{S}^{0}\pi^{+}\pi^{-})<1.89~GeV/c^{2} and 143.4<Δ​M<147.4​M​e​V/c2143.4<\Delta M<147.4~MeV/c^{2}. The selected data sample contains approximately 3.5×1053.5\times 10^{5} signal events and consists of about 90%90\% correctly D∗D^{*}-tagged D0D^{0} signal, 1%1\% mistagged D0D^{0} signal, and 9%9\% background candidates.

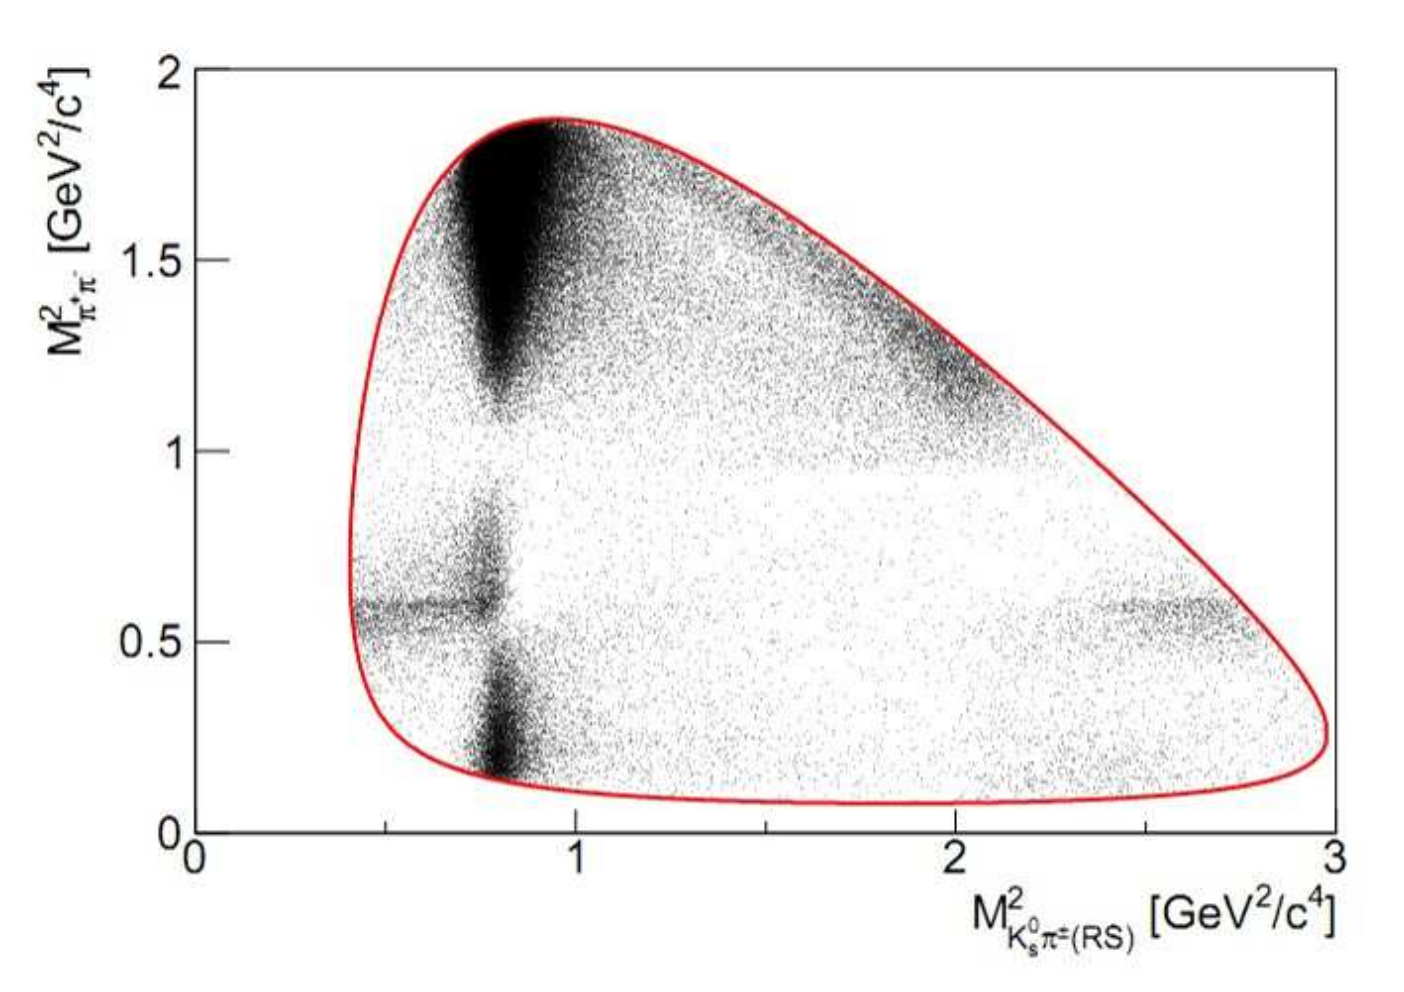
The Dalitz plot of D0→KS0​π+​π−D^{0}\rightarrow K_{S}^{0}\pi^{+}\pi^{-} decay, shown in Figure 1, contains three types of intermediate states contribution: Cabibbo-favored, doubly-Cabibbo-suppressed and CP eigenstates. A measure for the overall integrated CP asymmetry is given by Eq. 6, where ℳ{\cal M} is the matrix element used in isobar model for D0D^{0} decay and ℳ¯\overline{\cal M} the one for D¯0\overline{D}^{0} decay.

AC​P=∫|ℳ|2−|ℳ¯|∈|ℳ|2+|ℳ¯|∈​d​MKS0​π±​(R​S)2​d​Mπ+​π−2∫d​MKS0​π±​(R​S)2​d​Mπ+​π−2\displaystyle A_{CP}=\frac{\int\frac{|{\cal M}|^{2}-|\overline{\cal M}|^{2}}{|{\cal M}|^{2}+|\overline{\cal M}|^{2}}dM^{2}_{K_{S}^{0}\pi^{\pm}(RS)}dM^{2}_{\pi^{+}\pi^{-}}}{\int dM^{2}_{K_{S}^{0}\pi^{\pm}(RS)}dM^{2}_{\pi^{+}\pi^{-}}} (6)
ℳ(ℳ¯)=⊣′⌉⟩δ′+∑|⊣|⌉⟩(δ|±ϕ|)(∞±⌊|⊣|)𝒜|.\displaystyle{\cal M}(\overline{\cal M})=a_{0}e^{i\delta_{0}}+\sum_{j}a_{j}e^{i(\delta_{j}\pm\phi_{j})}(1\pm\frac{b_{j}}{a_{j}}){\cal A}_{j}. (7)
Refer to caption
Refer to caption
Refer to caption
Refer to caption
Figure 1: Dalitz plot of D0/D¯0→KS0​π+​π−D^{0}/\overline{D}^{0}\rightarrow K_{S}^{0}\pi^{+}\pi^{-} and projections of Dalitz-plot fit on the invidual two-body masses.

All CP violation quantities are found to be consistent with zero. The results for the CP violation amplitudes and phase, defined in Eq. 7 and obtained from simutaneous fit to the D0D^{0} and D¯0\overline{D}^{0} Dalitz plots, are displayed in Table 2. None of these is significantly different from zero. The overall integrated CP asymmetry, defined in Eq. 6, is determined to be AC​P=(−0.05±0.57​(s​t​a​t)±0.54​(s​y​s​t))%A_{CP}=(-0.05\pm 0.57(stat)\pm 0.54(syst))\%, and the systematic uncertainties are shown in Table 3.

Resonance Amplitude bb Phase ϕ⁡[]\phi[]
K∗​(892)±K^{*}(892)^{\pm} +0.004±0.004±0.011+0.004\pm 0.004\pm 0.011 −0.8±1.4±1.3-0.8\pm 1.4\pm 1.3
K0∗​(1430)±K^{*}_{0}(1430)^{\pm} +0.044±0.028±0.041+0.044\pm 0.028\pm 0.041 −1.8±1.7±2.2-1.8\pm 1.7\pm 2.2
K2∗​(1430)±K^{*}_{2}(1430)^{\pm} +0.018±0.024±0.023+0.018\pm 0.024\pm 0.023 −1.1±1.8±1.1-1.1\pm 1.8\pm 1.1
K∗​(1410)±K^{*}(1410)^{\pm} −0.010±0.037±0.021-0.010\pm 0.037\pm 0.021 −1.6±1.9±2.2-1.6\pm 1.9\pm 2.2
ρ⁡(770)\rho(770) −0.003±0.006±0.008-0.003\pm 0.006\pm 0.008 −0.5±1.5±1.4-0.5\pm 1.5\pm 1.4
ω⁡(782)\omega(782) −0.003±0.002±0.000-0.003\pm 0.002\pm 0.000 −1.8±2.2±1.4-1.8\pm 2.2\pm 1.4
f0​(980)f_{0}(980) −0.001±0.005±0.004-0.001\pm 0.005\pm 0.004 −0.1±1.3±1.1-0.1\pm 1.3\pm 1.1
f2​(1270)f_{2}(1270) −0.035±0.037±0.013-0.035\pm 0.037\pm 0.013 −2.0±1.9±2.1-2.0\pm 1.9\pm 2.1
f0​(1370)f_{0}(1370) −0.002±0.008±0.021-0.002\pm 0.008\pm 0.021 −0.1±1.7±2.8-0.1\pm 1.7\pm 2.8
ρ⁡(1450)\rho(1450) −0.016±0.022±0.135-0.016\pm 0.022\pm 0.135 −1.7±1.7±3.9-1.7\pm 1.7\pm 3.9
f0​(600)f_{0}(600) −0.012±0.017±0.025-0.012\pm 0.017\pm 0.025 −0.3±1.5±1.4-0.3\pm 1.5\pm 1.4
σ2\sigma_{2} −0.011±0.012±0.004-0.011\pm 0.012\pm 0.004 −0.2±2.9±1.1-0.2\pm 2.9\pm 1.1
K∗​(892)±K^{*}(892)^{\pm}(DCS) +0.001±0.005±0.002+0.001\pm 0.005\pm 0.002 −3.8±2.3±1.2-3.8\pm 2.3\pm 1.2
K0∗​(1430)±K^{*}_{0}(1430)^{\pm}(DCS) +0.022±0.024±0.035+0.022\pm 0.024\pm 0.035 −3.3±4.0±3.9-3.3\pm 4.0\pm 3.9
K2∗​(1430)±K^{*}_{2}(1430)^{\pm}(DCS) −0.018±0.029±0.017-0.018\pm 0.029\pm 0.017 +4.2±5.3±3.0+4.2\pm 5.3\pm 3.0
Table 2: Results of the simultaneous D0−D¯0D^{0}-\overline{D}^{0} Dalitz-plot fit for the CP-violation amplitudes, bb and phase, ϕ\phi. The first uncertainties are statistical and the second systematic.
Effect Uncertainty on AC​PA_{CP}[10−210^{-2}]
Efficiency 0.36
Background 0.09
Fit model 0.37
Trigger 0.05
Form factors 0.10
Total systematic 0.54
Statistical 0.57
Table 3: Uncertainties on the overall integrated CP asymmetry.

4 Updated measurement in D0→KS​π+​π−D^{0}\rightarrow K_{S}\pi^{+}\pi^{-} at Belle

We report the updated measurement of D0−D¯0D^{0}-\overline{D}^{0} mixing by time-dependent Dalitz analysis method using the 921​f​b−1921~fb^{-1} of Υ\Upsilon(4S) and Υ\Upsilon(5S) full data collected by Belle detector at KEKB asymmetric-energy e+​e−e^{+}e^{-} collider.

The decay chain D∗⁣+→D0​πs+D^{*+}\rightarrow D^{0}\pi_{s}^{+}, D0→KS0​π+​π−D^{0}\rightarrow K_{S}^{0}\pi^{+}\pi^{-}, which is reconstructed from c​c¯c\overline{c} process, is used to distinguish between D0D^{0} and D¯0\overline{D}^{0} with the charge of the low-momentum pion πs\pi_{s} and to reduce the background. The D0D^{0} decay time tt and its uncertainty σt\sigma_{t} are obtained by projecting the flight length between D0D^{0} decay and production vertices to momentum direction and then transforming it to the center-of-mass system(CMS). To suppress the combinatorial background and the events from B decays, we require D∗⁣+D^{*+} momentum in CMS to be greater than 2.52.5 GeV/c and 3.13.1 GeV/c for Υ\Upsilon(4S) and Υ\Upsilon(5S) data respectively.

Two observable are used to determined the yield of signal and backgrounds: the invariant mass of D0D^{0} daughter particles: M=mKS0​π+​π−M=m_{K_{S}^{0}\pi^{+}\pi^{-}} and the energy released from D∗⁣+D^{*+} decay: Q=mKS0​π+​π−​πs−mKS0​π+​π−−mπsQ=m_{K_{S}^{0}\pi^{+}\pi^{-}\pi_{s}}-m_{K_{S}^{0}\pi^{+}\pi^{-}}-m_{\pi_{s}}. The MM and QQ distributions of selected candidates are shown in Figure 2.

Figure 2: The projections of MM and QQ for MC data in region 1.81<M<1.92​G​e​V/c21.81<M<1.92~GeV/c^{2} and 0<Q<20​M​e​V/c20<Q<20~MeV/c^{2}, including signal, random π\pi background and combinatorial background.

The Dalitz distribution of D0→KS0​π+​π−D^{0}\rightarrow K_{S}^{0}\pi^{+}\pi^{-} are expressed as a sum of quasi-two-body amplitudes. Different modes are used to describe the decay amplitude: Breit-Weigner model for the P- and D-wave with twelve intermediate resonances, K-matrix model for the π​π\pi\pi S-wave [11] and LASS model for KS0​πK_{S}^{0}\pi S-wave [8]. The final Dalitz plot parameterize is optimized according likelihood and χ2\chi^{2} test.

We performe an unbinned maximum likelihood fit to extract the mixing parameters xx and yy. The distribution of combinatorial background is determined in MM sideband(30<|M−mD0|<50​M​e​V/c230<|M-m_{D^{0}}|<50~MeV/c^{2}). Meanwhile the random π+\pi^{+} background is mixture of true and mistagged D0D^{0} with the fraction determined from QQ sideband(3<|Q−5.85|<14.15​M​e​V/c23<|Q-5.85|<14.15~MeV/c^{2}). In the final Dalitz fit with data sample, see Figure 3, we extract the mixing parameters x=(0.56±0.19−0.09−0.09+0.03+0.06)%x=(0.56\pm 0.19^{+0.03+0.06}_{-0.09-0.09})\% and y=(0.30±0.15−0.05−0.06+0.04+0.03)%y=(0.30\pm 0.15^{+0.04+0.03}_{-0.05-0.06})\%, where the errors are statistical, experimental and model uncertainties respectively, see Table 4, and the D0D^{0} mean lifetime τ=(410.3±0.4)​f​s\tau=(410.3\pm 0.4)fs, see Figure 4, which is consistent with the world average.

Refer to caption
Figure 3: Dalitz plot distribution and Dalitz variables m+2m^{2}_{+}, m−2m^{2}_{-} and mπ​π2m^{2}_{\pi\pi} projections for experimental data with 2-dimensional χ2\chi^{2} test over the Dalitz plot plane: χ2/n​d​f=1.207\chi^{2}/ndf=1.207 for 14264−4214264-42 degrees of freedom.
Figure 4: The proper time distribution for events in the signal region with −2000<t<4000​(f​s)-2000<t<4000(fs)(point) and fit projection for mixing fit(curve).
Source of systematic uncertainty (Δ​x\Delta x)(×10−4\times 10^{-4}) (Δ​y\Delta y)(×10−4\times 10^{-4})
Best Candidate selection +1.05+1.05 +1.87+1.87
Signal and backgrounds yields ±0.30\pm 0.30 ±0.27\pm 0.27
Wrong tagged events’ fraction −0.67-0.67 −0.45-0.45
Time resolution of signal −1.39-1.39 −0.92-0.92
Efficiency −1.13-1.13 −2.09-2.09
Combinatorial’s PDF −4.82+1.90{}^{+1.90}_{-4.82} −3.88+2.28{}^{+2.28}_{-3.88}
K∗​(892)K^{*}(892) DCS/CF reduced by 5%5\% −7.28-7.28 +2.29+2.29
K∗​(1430)K^{*}(1430) DCS/CF reduced by 5%5\% +1.71+1.71 −0.67-0.67
Total uncertainty(experimental sys.) −8.94+2.78{}^{+2.78}_{-8.94} −4.58+3.74{}^{+3.74}_{-4.58}
Resonances’ MM and Γ\Gamma error ±1.40\pm 1.40 ±1.21\pm 1.21
Remove K∗​(1680)+K^{*}(1680)^{+} −1.78-1.78 −3.02-3.02
Remove K∗​(1410)±K^{*}(1410)^{\pm} −1.16-1.16 −3.62-3.62
Remove ρ⁡(1450)\rho(1450) +2.13+2.13 +0.30+0.30
Form factors +4.05+4.05 +2.35+2.35
Γ⁡(q2)=\Gamma(q^{2})=constant +3.33+3.33 −1.61-1.61
Angular dependence −8.46-8.46 −3.86-3.86
K-matrix formalism −2.16-2.16 +1.79+1.79
Total uncertainty(model sys.) −9.09+5.83{}^{+5.83}_{-9.09} −6.42+3.21{}^{+3.21}_{-6.42}
Table 4: The source of two kinds of systematic uncertainty.

We also search for CP violation in D0/D¯0→KS0​π+​π−D^{0}/\overline{D}^{0}\rightarrow K_{S}^{0}\pi^{+}\pi^{-} decays. We obtain identical mixing parameters as fit result without CP violation and these CP violation parameters |q/p|=0.90−0.15−0.04−0.05+0.16+0.05+0.06|q/p|=0.90^{+0.16+0.05+0.06}_{-0.15-0.04-0.05} and arg(q/p)(o)=−6±11−3−4+3+3\arg(q/p)(^{o})=-6\pm 11^{+3+3}_{-3-4} which show no hint for indirect CP violation.

ACKNOWLEDGEMENTS

I am grateful to T. Peng, Z.P. Zhang, A. Zupanc, J. Brodzicka, M. Nakao for advices and collaboration for the contribution for KEKB in achieving the highest luminosity and most stable machine condition.

References

  • [1] M. Starič e​t​a​let~al. (Belle Collaboration), Phys. Rev. Lett. 98, 211803 (2007).
  • [2] B.Aubert e​t​a​let~al. (BaBar Collaboration), Phys. Rev. Lett. 98, 211802 (2007).
  • [3] R. Aaij e​t​a​let~al. (LHCb Collaboration), Phys. Rev. Lett. 110, 101802 (2013).
  • [4] Xing Z Z. Chinese Physics C (HEP & NP), Vol. 32, No. 6, Jun., 2008.
  • [5] D. M. Asner e​t​a​let~al. (CLEO Collaboration), Phys. Rev. D 72, 012001 (2005).
  • [6] L. M. Zhang e​t​a​let~al. (Belle Collaboration), Phys. Rev. Lett. 99, 131803 (2007).
  • [7] A. Zupanc e​t​a​let~al. (Belle Collaboration), Phys. Rev. D 80, 052006 (2009).
  • [8] P. del Amo Sanchez e​t​a​let~al. (BaBar Collaboration), Phys. Rev. Lett. 105, 081803 (2010).
  • [9] T. Aaltonen e​t​a​let~al. (CDF Collaboration), Phys. Rev. D 86, 032007 (2012).
  • [10] HFAG: http://www.slac.stanford.edu/xorg/hfag/charm/April13/results_mixing.html
  • [11] B. Aubert e​t​a​let~al. (BaBar Collaration), Phys. Rev. D 78, 034023 (2008).
  • [12] T. Peng. (Belle Collaboration), ”Charm mixing at Belle”, 36th International Conference on High Energy Physics, July 4-11, 2012, Melbourne, Australia.