Tracer diffusion inside fibrinogen layers
Abstract
We investigate the obstructed motion of tracer (test) particles in crowded environments by carrying simulations of two-dimensional Gaussian random walk in model fibrinogen monolayers of different orientational ordering. The fibrinogen molecules are significantly anisotropic and therefore they can form structures where orientational ordering, similar to the one observed in nematic liquid crystals, appears. The work focuses on the dependence between level of the orientational order (degree of environmental crowding) of fibrinogen molecules inside a layer and non-Fickian character of the diffusion process of spherical tracer particles moving within the domain. It is shown that in general particles motion is subdiffusive and strongly anisotropic, and its characteristic features significantly change with the orientational order parameter, concentration of fibrinogens and radius of a diffusing probe.
pacs
05.45.Df, 68.43.FgI Introduction
The obstructed transport in disordered and inhomogeneous systems may lead to anomalous diffusion. Transport of a dense fluid in a porous host structure, ballistic tracer motion in a spatially heterogeneous medium, a probe or solute diffusing through fixed scatterers within liquid crystalline phases and protein motion in cellular membranes or in cytoplasm, all exhibit characteristics typical for hindered diffusion [1, 2, 3, 4, 5]. Models of such systems usually include variants of Lorentz approach [1] in which static scatterers are fixed in space and tracer particles are allowed to move freely through the resulting mesh. The obstacle density is crucial for the anisotropy of motion and excluded volume effects, since only unoccupied, void volume is accessible to the probe particle traveling in the system.
In the original Lorentz model proposed as a description of the electric conductivity of metals, the motion of a ballistic particle elastically scattered off randomly distributed spherical obstacles has been analyzed. Microscopic theory predicts for this model appearance of a localization transition [6] where at a critical obstacle density the long-range transport ceases. In accordance, as the critical density of scatterers is approached the tracer particle experiences a sublinear in time increase of its mean-square displacement and the diffusion constant vanishes at a critical concentration of obstacles. Such a signature of anomalous diffusive motion is a common observation in experimental studies of various transport processes in cellular fluids [7]. Dependent on density and shapes of crowding agents, meandering subdiffusive motion occurs on larger time windows and its characteristics close to the localization transition exhibit scaling behaviour which can be rationalized in terms of dynamic critical phenomena [1].
Effects of the entrapment within the mesh composed of the obstacles and elucidation of dynamical behavior of spherical tracers diffusing through the collective structure of scatterers have been investigated so far both experimentally [8, 9] and theoretically [10, 1, 11, 12, 13, 14]. In particular, diffusion of silica tracer beads with large radii through colloidal rods have been observed experimentally to depend on the rod density, exhibiting domination of caging effects at high densities of rods. Similar experiments with apoferritin, quantum dots and lysozyme [8] diffusing in poly(ethylene glycol) solutions have been analyzed addressing a connection between the motion of nanoscopic probes in polymer solutions and their macroviscosity. Diffusion of spherical tracers through a liquid crystal consisting of ellipsoidal particles near the isotropic-nematic phase transitions has been investigated theoretically [12] pointing to the increasing anisotropy of the probe dynamics with increasing long-range order of nematogens. In silico, studies performed by Höfling et al.[1] analyzed dynamic scaling picture of anomalous transport in two-dimensional models, in which a Brownian tracers of different sizes were moving between uncorrelated and overlapping circular obstacles. These studies confirmed the universal values of the dynamic exponents of the mean-square displacement (MSD) at leading and next-to-leading order and the subdiffusive motion of tracers was shown to experience the crossover to normal diffusion away from the localization transition, when tracers become immobilized.
Typically, anomalous and complex transport is conveniently described by means of MSD which, by means of the central limit theorem, is expected to grow linearly in time for time scales much larger than microscopic. On the other hand, observed non-linear growth of MSD is a benchmark of unusual, anomalous transport indicating subdiffusive behavior for MSD scaling according to a power law, , with an exponent . Apart from this most common characteristics of subdiffusive motion, other phenomena like strongly reduced and time-dependent diffusion coefficients, persistent correlations in time, non-Gaussian distributions of spatial displacements and heterogeneous diffusion of particles can be also observed [15, 1, 16, 17, 5, 18]. In order to study the effects of varying geometric and spatial anisotropy in the structure of scatterers, in this article we investigate the dynamics of a single tracer particle performing Brownian motion in a two-dimensional mesh of randomly distributed elongated hard obstacles. At a certain critical obstacle density, the motion of the tracer becomes anomalous over many decades in time, which is rationalized in terms of an underlying percolation transition of the void space. We analyze the scaling behavior of the time-dependent MSD and describe various facets of entrapped motion related to the tracer size and organization of the mesh.
II Model and simulations
II.1 Adsorption of fibrinogen molecules
Spherocylindrical objects forming scatterers are assumed to have a form of a fibrinogen molecule (cf. Fig.1) approximated by a linear chain of stiff beads. The side beads have diameter nm and are connected with a central, middle-size bead of diameter nm by chains of ten smaller nm balls .

Presented model had successfully explained the main properties of fibrinogen layers created during irreversible adsorption, like the saturated random coverage ratio and kinetics of the process [19, 20]. The layers of different concentrations of fibrinogen are generated numerically by using the Random Sequential Adsorption (RSA) algorithm [21]. The procedure is based on a stochastic adsorption process in which objects are placed consecutively on a surface in such a way that they do not overlap any previously adsorbed particles and adsorb only after making a contact with an uncovered surface area. As a consequence of prohibited penetration of objects, the adsorption is completed when there is no available (free) area. The pattern of coverage of the surface obtained in such a way reflects the interplay between entropic packing of molecules and their concentration and has been displayed in Fig.2. Accordingly, the concentration of the fibrinogen molecules depends on the orientation of the molecules, i.e. where is the orientational parameter described below.
The single simulation run lasts for steps, where nm2 is an area covered by a single fibrinogen molecule and nm2 is a circular surface of diameter mn. The saturated random coverage of the surface is determined by the dimensionless density where represents the number of adsorbed molecules. The maximal coverage grows weakly [24] with increasing orientational order (the overall impact is only about 10%) and resembles isotropic - nematic transition in a liquid crystal, where typically no significant density change is observed.

Orientational order of a fibrinogen layer is controlled here by the parameter - a width of a Gaussian probability density function, according to which the molecule’s orientations are drawn. However, in order to compare results with other works and experiments it is worthy to introduce yet another order measure, independent of the mechanism that forces molecules to align in parallel. For that purpose we define a global order parameter dependent only on geometrical properties of the coverage [22, 23]:
| (1) |
Here is a number of molecules in a layer, describes a unit vector parallel to the orientation of -th fibrinogen and denotes the order’s direction. Parameter is for totally disordered phase and rises with growing orientational order up to . In consequence, the maximum value of is reached when all molecules are parallel.
The main properties of ordered fibrinogen coverages were discussed in [24]. Here we focus on diffusion processes in such layers. Therefore, an appropriate model of random walk process has to be introduced.
II.2 Diffusive transport
Diffusion inside fibrinogen layer has been studied using Gaussian Random Walk (GRW) process. The process starts at a randomly chosen, uncovered point. Single step is given by a random vector with coordinates drawn (as two independent random variables) according to a normal Gaussian probability distribution. The step is accepted if it follows to an uncovered place. Otherwise, it is treated as the step. The most typical property of such a random walk process is the mean square displacement (MSD) of the walker and its characteristic exponent which reflects the dependence of the asymptotic diffusion process on time :
| (2) |
Here is a diffusion coefficient and describes the character of the motion: for a standard (normal) diffusion MSD is expected to grow linearly in time, i.e. . In contrast, non-linear growth of the MSD is usually taken as an indicator of anomalous diffusive transport with slower than for the normal diffusion increase of MSD in time () typical for the subdiffusion and the enhanced superballistic (superdiffusive) transport corresponding to . This classification requires however some additional care, when diffusive motion is defined as the asymptotic property of random walks, as e.g. charge transport in disordered semiconductors or diffusion in chemical space for random walks over polymer chains. In such realms, the combination of long steps and long breaks between them can be responsible for scaling properties of moments which are in line with ordinary Brownian motion MSD () despite the asymptotic process is significantly non-Markov and different from Gaussian [25, 18, 17].
Characteristics of diffusive motion, namely coefficients and , can be obtained directly from numerical simulations by fitting the power law (2) to measured dependence of on . Clearly, in such case the coefficient carries different units for different exponents s, . Otherwise, the time-scale dependent diffusion coefficient can be introduced
| (3) |
and, by analogy, the apparent exponent can be defined as a logarithmic derivative of the MSD:
| (4) |
Here and are arbitrary units of length and time, respectively. Note that obtained from (2) is the mean of above over a finite time window used for fitting purposes. In our simulations represents a single step of the GRW trajectory with a typical jump length (see below).
II.3 Different diffusion models
In order to check whether obtained results depend on a particular simulation model of the diffusion process, two additional models of diffusive transport have been analyzed. In the first one the step size of a tracer is not drawn from the Gaussian PDF but instead, is preset to a constant nm with the director of the motion sampled from a uniform distribution. The second model, similarly to case (A) uses the Gaussian PDF of steps, however with twice bigger standard deviation (instead of nm, the value nm has been used). The total MSD and its dependence on time for all three models are displayed in Fig.3.

Derived results indicate that subdiffusion inside ordered fibrinogen layers () is not essentially model-dependent. Although diffusion coefficient differs, the slopes of (A) and (B) lines corresponding to subdiffusive exponents do not differ significantly for both models. Slightly larger values of and for (C) line, when a step size of the GRW was (on average) twice larger than in cases (A) and (B) can be explained by nonzero probability of jumping over the obstacles, which effectively speeds up the diffusion process.
III Results
III.1 Short time limit
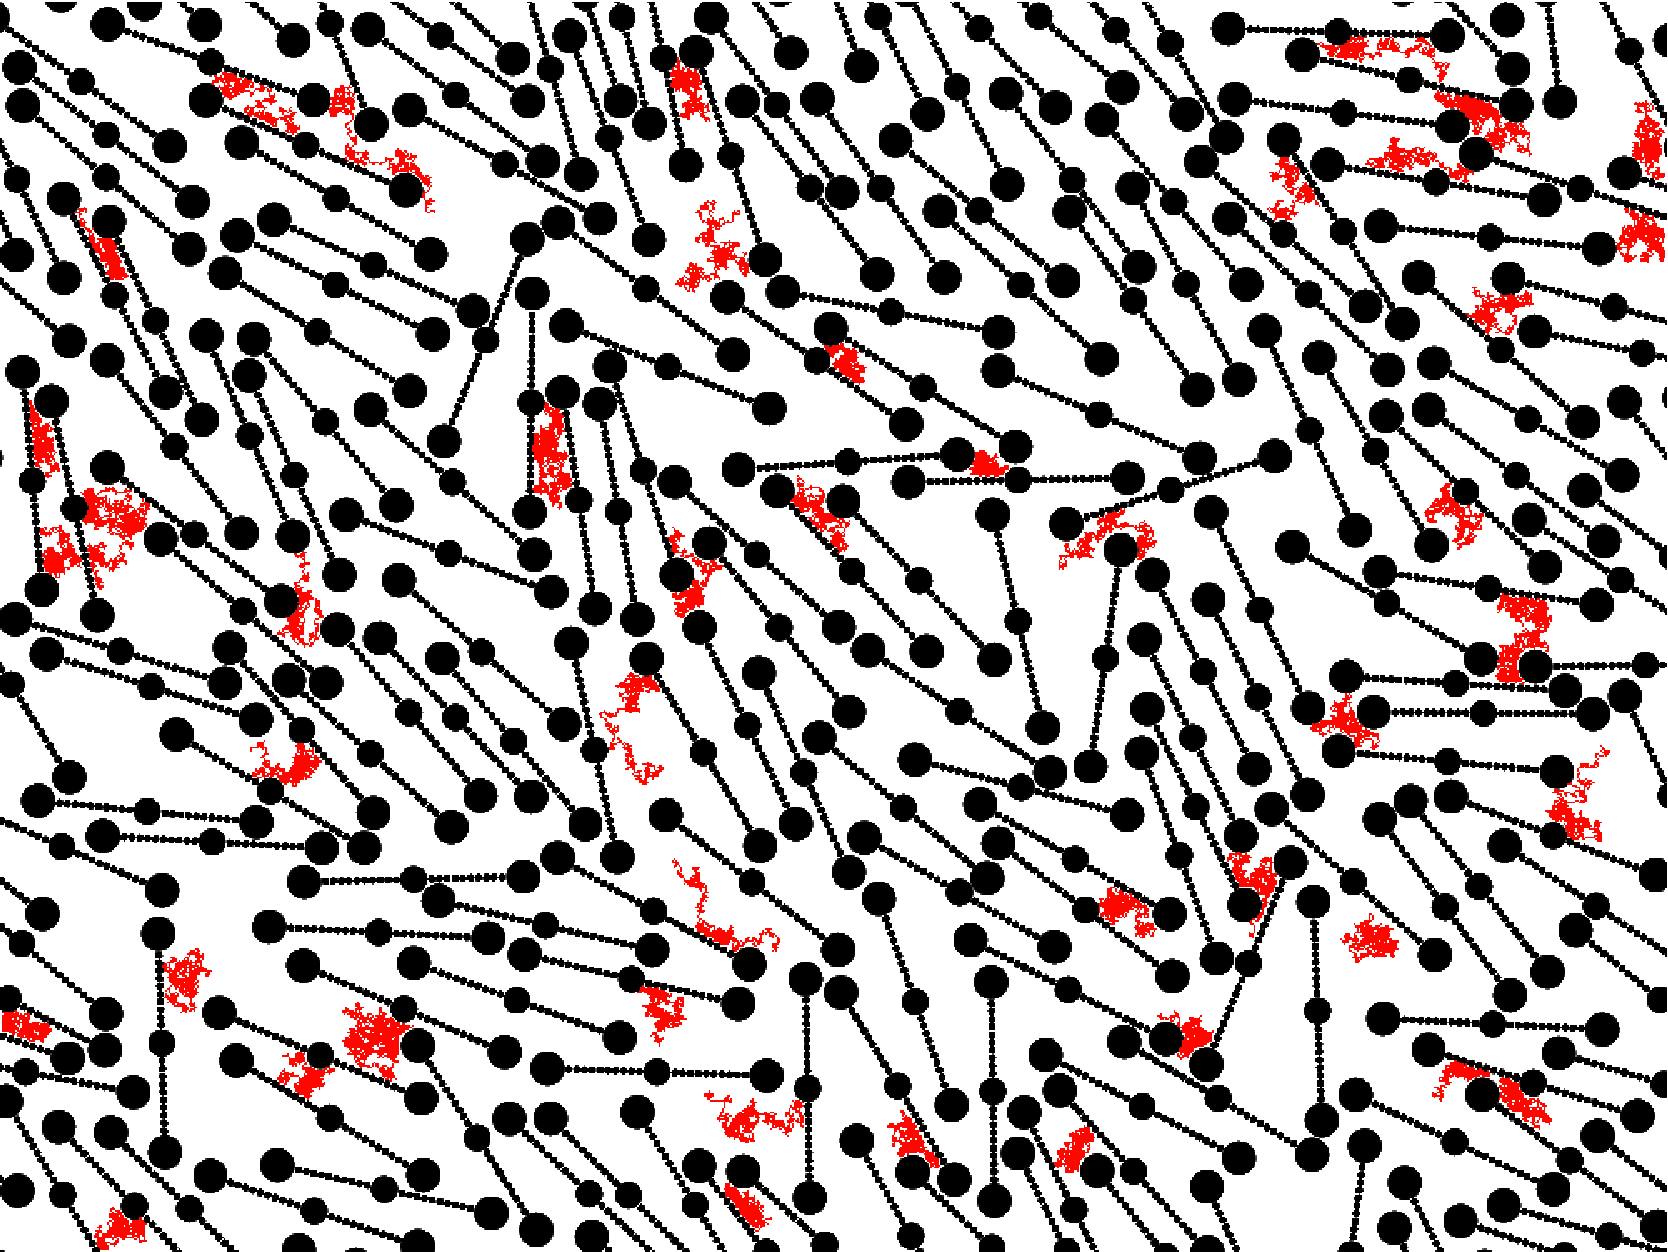
For GRW trajectories of length equal to subsequent steps, the MSD has been estimated as an average over independent realizations of the walk starting from different, randomly chosen points distributed in the void space of surface with saturated random coverage of fibrinogen molecules (cf. Section II A). We have observed that derived values of and differ significantly for various fibrinogen layers generated for the same value of . Therefore, those parameters have been further averaged over ensembles of up to different fibrinogen layers. Fig.4 displays exemplary diffusive trajectories of small, spherical tracer molecules wandering inside the accessible space of the fibrinogen mesh and starting their motion from randomly chosen location.
To relate character of the diffusion process inside fibrinogen layers to the degree of order, we have first concentrated on evaluation of the effective exponent in relation (2). It’s dependence on orientational order parameter is displayed in Fig.5.


In the short time domain subdiffusion is observed in the whole range of the orientational order parameter. Moreover, the slowdown of the diffusion process (as expressed by the value of the effective exponent ) is stronger in more ordered phases, cf. Fig.5. This observation seems to be counterintuitive, as the motion in ideally ordered two dimensional space often reduces to a one dimensional problem (e.g. when formation of channels favors unrestricted motion in a preferential direction) where standard diffusion should be observed. However, in the case analyzed here only nematic-like order is observed and additionally, ordering favors a denser fibrinogen packing [24], which results in more obstacles encountered by a diffusing molecule. To analyze this phenomenon more carefully we treated diffusion as being composed of two separate GRW: parallel and perpendicular to the direction of the global orientational order:
| (5) |
Results obtained for those processes are presented in insets to Fig.5. The parallel diffusion speeds up with increasing order (), in contrast to the perpendicular transport which becomes more obstructed and slows down. Both motions converge to the same exponent value at , as in disordered phase there is no intrinsic preferred direction and the diffusion homogenizes. The effective exponent depends on a tracer’s size and the overall diffusive motion is slower for larger molecules, as expected (see Figs.5,6). For small tracers (), parallel motion approaches normal diffusion () and this behaviour is stronger in ordered layers, see Fig.6. In contrast, low ordering implies higher degree of structural homogeneity of layers and results in almost equal values .


III.2 Long time limit
To get a deeper insight into the global diffusion process, longer trajectories of tracer movement have been analyzed. Additionally, structures of fibrinogen layers have been formed out of a fixed, constant concentration of molecules. Samples of surfaces created in this way are characterized by various spatial configurations of the same number of molecules distributed over the target area. In simulations the maximum length of a single GRW trajectory has been preset to include steps and the MSD has been evaluated as an average over independent GRW trajectories starting from randomly chosen, uncovered points.
The dependence of on number of steps for two different sizes of a spherical tracer is presented in Fig.7.


Unlike for small tracer molecules, diffusive transport of large particles can be seen only in relatively short time intervals. The motion is then characterized by a sublinear MSD behavior (see Fig. 7) and gradually becomes effectively confined within the network of fibrinogen molecules adsorbed on the surface. At longer times () MSD saturates pointing to the immobilization of particles within the mesh. Consequently, in order to avoid the entrapment, further analysis was performed using only small tracers. Their GRW motion has been analyzed by inspecting trajectories of duration . Those longer trajectories exhibit sometimes the slowdown of the diffusion process related to a finite size of the layers. Such cases, whenever observed in simulations, have been excluded from statistical analysis.

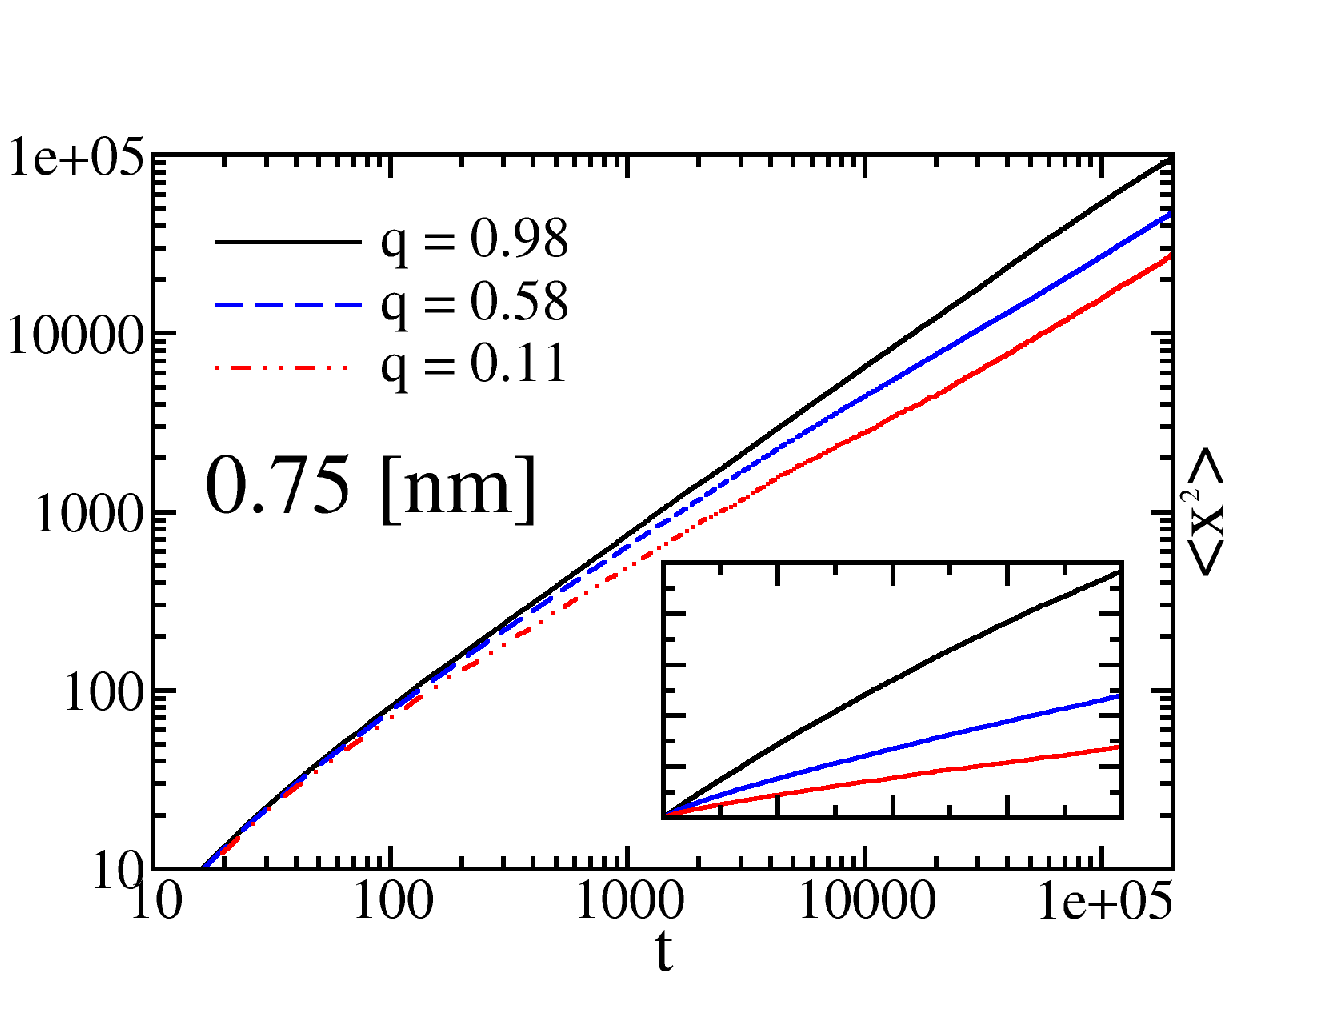
Inspection of Fig.8 indicates that in ordered layers of fibrinogens the parallel component of MSD is promoted, whereas the perpendicular motion becomes hindered, in line with observations drawn from the upper panel of Fig.7.
In order to further elucidate effects due to varying spatial anisotropy and geometry of the fibrinogen mesh, we focused our analysis on the effective exponent and coefficient in relation (2), (3) and (4). It’s dependence on time and orientational order parameter is summarized in Fig.9.
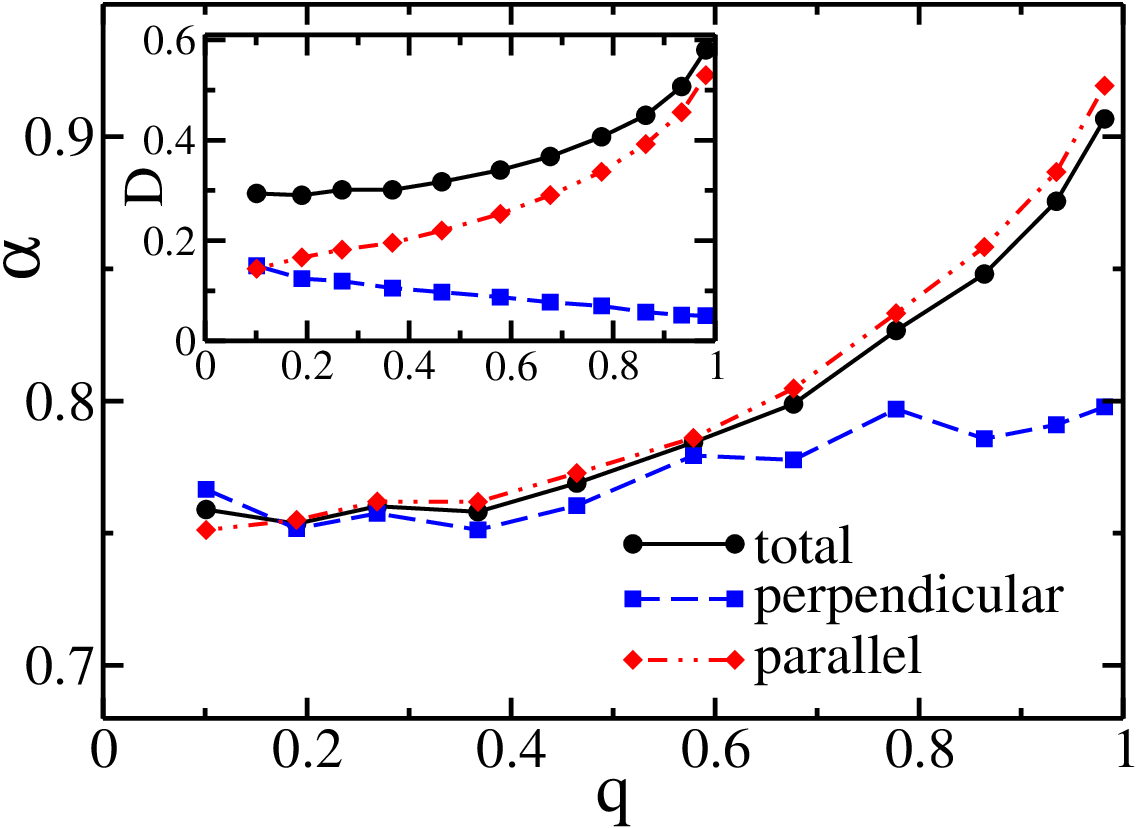

Right panel: the temporary value (cf. Eq.(4)) of the exponent is presented for the order parameter . The inset displays the time-scale dependent diffusion coefficient evaluated for the same time window. In both cases the tracer diameter was nm and the concentration of obstacles .
Similarly to the case of transport observed in the short time domain (see Section III.1), subdiffusion is observed in the whole range of the orientational order parameter and the exponent is highest for parallel MSD component in almost all range of . On the other hand, the diffusion coefficient is significantly lower than for the whole MSD, which reflects variability of and parameters in perpendicular and parallel directions of motion: and . Moreover, for ordered phases () the perpendicular exponent has a broad minimum for intermediate times (see Fig.9, right panel) which corroborates with observation of the plateau in the perpendicular component of MSD (see Fig.8, left panel). This minimum corresponds to the confinement of a tracer between long, parallel filaments made of fibrinogen molecules. Similar effect has been also detected in models of the anisotropic diffusion of a strongly hindered rod represented by a thin needle moving in an array of hard point obstacles [26].
IV Tracer diffusion as a percolation problem
The model we have to do with is essentially a continuous percolation model [25, 27], but not a standard one. To see this, let us consider on the motion of a single tracer of radius and concentrate on the motion of its center. Since both the tracers and the fibrinogen molecules are modeled as solid, impenetrable objects, the motion of center of the tracer is geometrically restricted to the domain of the plane outside the -vicinities of all fibrinogen molecules. Although the areas of the molecules themselves cannot intersect, their -vicinities can, thus leading to creation of effectively impenetrable domains, see Fig.10.

The percolation threshold is defined by a critical concentration of connected accessible points at which the unbounded motion through the lattice becomes possible. In our system the percolation threshold depends however in a complex manner on three control parameters: on the orientational parameter ,
on the concentration of fibrinogen molecules which itself depends on via our generation algorithm,
and on the tracer’s diameter .
Figs.7, 11 show essentially the behavior of the MSD in the percolating and non-percolating cases. In the first case the MSDs continuously grow, in the second case they saturate at the value corresponding to the size of typical finite clusters (accessible areas). The transition here takes place due to both: increasing size of the tracer (Fig.7) and increasing concentration of obstacles (Fig.11) for ordered and disordered situations.


IV.1 Anisotropy
In the percolating regime the system homogenizes, and the diffusion in it is normal, corresponding to the long-time value of , cf. upper panel of Fig.7 and Fig.8. However, this normal diffusion can be strongly anisotropic, as demonstrated in Figs.7, 8, 12. The exact calculation of anisotropy is a hard task, and the results are known only either for small concentrations or for very simple geometric forms of inclusions (ellipses or ellipsoids). Nevertheless, several general remarks can be made based on what is known for such simple cases [25, 27].
If the obstacles are not oriented, no anisotropy can be observed. If they are oriented, the final diffusion coefficient is anisotropic. As a measure of anisotropy the quotient of the values of diffusivity (or, otherwise of the MSD components) parallel and perpendicular to the orientation of obstacles [1, 29] can be taken: , which changes in the interval .


The problem of finding the anisotropy of the diffusion coefficient in a system with obstacles is similar to the problem of finding the heat conductivity or the electric conductivity in similar settings. Such problems were investigated for several different geometries of inclusions. For small concentration of obstacles the diffusivity of the system is well-described by the perturbative approaches [28, 29], and its anisotropy vanishes (which corresponds to ), as also seen in Fig.12.
For the case of intersecting obstacles with centers randomly placed on a plain the anisotropy close to the percolation threshold can grow quite large. Thus, close to percolation transition the anisotropy in a system of highly oriented elongated defects might be approximated by those of a system with ellipsoidal inclusions of the same aspect ratio with being the largest and the smallest dimension of the inclusion, a problem discussed in [30]. The discussion in this work is essentially for 3d, but can be easily adapted to a two-dimensional case. In this case close to the criticality , and by taking geometrical parameters of the fibrinogen model, may get to be as large as in our case. Note that the possibility of intersection and the random position of the centers of inclusions are both crucial for the discussion, and the departures from these assumptions may lead to strong deviations from this prediction in what concerns the anisotropy’s concentration dependence. Thus, in the case of parallel non-intersecting inclusions with large aspect ratio (”scratches”) of length thrown onto a plane with concentration one gets , see [31]. Our situation here is more complex than the both ones considered theoretically due to the fact that the domains are not fully oriented, can intersect but possess hard cores, so that their centers are not randomly distributed. This leads to highly non-monotonous concentration dependencies for the highly oriented case, as seen in the lower panel of Fig.12.
IV.2 Effective exponent of anomalous diffusion
The overall accessible volume of the mesh close to the percolation threshold forms a fractal-like percolation cluster. The effective exponent is connected with a critical exponent of conductivity in percolation theory. The last one is either determined by the lattice percolation exponent or by the distribution of the resistances of the bottleneck (narrow paths between the almost contacting obstacles) [32]. Despite much more complicated geometry of our model, the bottlenecks in it appear close to the contact points of essentially circular areas, and therefore should show the same resistivity singularity behavior as the Swiss cheese model [32] which has the same conductivity exponent as the lattice percolation. This one is translated into the standard value of the anomalous effective diffusion exponent being as defined through the known values of spectral and fractal dimensions of the percolation clusters [25, 33].
This value of the final exponent of anomalous diffusion has to be the same for both principal values of the displacement (i.e. in the directions parallel and perpendicular to the obstacles’ orientation), and is observed to happen for orientational order in our case (cf. Fig.8,9). The behavior of each of the components for the values of parameters corresponding to the percolating phase is also quite typical: The normal short-time diffusion with the seed diffusivity coefficient (corresponding to practically non-constrained particle motion), a crossover to a more or less pronounced intermediate asymptotic subdiffusive behavior typical for percolation, and another crossover back to normal diffusion with the effective diffusion coefficient considerably smaller than the seed one (cf. left panels of Figs.7,8). In the non-percolating domain the last crossover is the one to a saturating MSD.
However, Fig.8 also shows that the positions of the crossover regions and the widths of the crossover domains for the two components are quite different. For example, for the perpendicular component already underwent both crossovers at , while the parallel component has just entered the first crossover domain at the same time. Summing up two functions with so strongly different behaviors to obtain the total diffusivity leads to the effective behavior which is seemingly far from typical percolation predictions. Thus, in the Figs.5, 6 the exponents of single components of MSD are either larger than or equal to (within the error bars) the percolation value of , as it has to be the case for the typical double crossover situation. The exponent characterizing the total displacement can however fall below the value of 0.55, thus absolutely obscuring the percolative nature of the behavior observed.
V Conclusions
In this paper properties of diffusive motion of a tracer particle in crowded, anisotropic environment has been analyzed. In general, transport slowdown with the characteristic effective exponent has been observed. However, details of the process depend in a complex way on three control parameters: concentration of obstacles, their orientational (nematic-like) ordering, as well as on the size of a tracer. Moreover, due to environment anisotropy, the perpendicular and parallel motion to the intrinsic direction represented by the director orientation, cf. Eq.(1) has to be studied separately, as both components of the motion can exhibit a totally different behaviour.
Although our situation is definitely a variant of a continuous percolation model, it shows a very rich and interesting behavior due to its novel aspect, namely the anisotropy. The characteristic crossover times for the components of motion parallel and perpendicular to the main axes can be very different, so that the total diffusion coefficient can show effective time dependence which does not resemble the one for lattice percolation, and can even exhibit much slower effective subdiffusive behavior on intermediate times.
Analysis of the effective exponent averaged over the time window shows that subdiffusive transport of small tracers is observed in the whole range of the orientational order parameter and the expected crossover to percolation limit is detected for , see Fig.9. For high orientational order, closer inspection of time dependent allows to detect another crossover for very long times . Yet, this ”almost normal” diffusion remains strongly anisotropic, () as demonstrated in the right panel of Fig.9 and left panel of Fig.12. In general, positions of crossover regions and duration of the crossover domains are different for two orientational components of motion and can be rationalized in terms of transport on an anisotropic percolating space.
We expect our findings to be relevant in understanding sources of anomalous transport in crowded, heterogeneous environments. Active research in this field is beneficial for control of anomalous subdiffusion in biological media, calibration of measurements by use of fluorescence correlation spectroscopy (FCS) and analysis of single particle tracking within the dense environment of the cell [1, 3, 8]. It is expected also to contribute to further progress in a general theory [13, 14, 15] of the anisotropic motion of objects in entangled suspensions responsible for steric effects.
Acknowledgments
This work was supported in part by European Science Foundation EPSD grant. Francesc Sagués acknowledges financial support from MICINN (FIS2010-21924-C02-01) and from DURSI Generalitat de Catalunya (2009SGR 1055). The authors acknowledge many fruitful discussions with Jakub Barbasz.
References
- [1] F. Höfling, T. Franosch, Rep. Prog. Phys. 76 046602 (2013).
- [2] M.J. Saxton, Biophys. J. 66 394 (1994).
- [3] I. Bronstein, Y. Israel, E. Kepten, S. Mai, Y. Shav-Tal, E. Barkai, and Y. Garini, Phys. Rev. Lett. 103 018102 (2009).
- [4] E. Barkai, Y. Garini, and R. Metzler, Phys. Today 65 (8), 29 (2012).
- [5] I.M. Sokolov, Soft Matter, 8 9043 (2012).
- [6] W. Götze, Complex Dynamics of Glass-Forming Liquids: A Mode-Coupling Theory, Oxford University Press (2009).
- [7] R.J. Ellis, A.P. Minton, Nature 425 27 (2003).
- [8] N. Ziebacz, S.A. Wieczorek, T. Kalwarczyk, M. Fialkowski, R. Holyst , Soft Matter 7 (16) 7181 (2011).
- [9] K. Kang, A. Wilk, J. Buitenhuis, A. Patkowski, J.K.G. Dhont, J. Chem. Phys. 124 044907 (2006).
- [10] A.K. Tucker, R. Hernandez, Phys. Chem. B., 116 1328 (2012).
- [11] A. Ochab-Marcinek, R. Holyst, Soft Matter 7 (16) 7366 (2011).
- [12] R. Vasanthi, S. Ravichandran, B. Bagchi, J. Phys. Chem. 115 10022 (2001).
- [13] M. Majka, P.F. Góra, Acta Phys. Polon. B 43 1133 (2012).
- [14] M. Majka, P.F. Góra, Phys. Rev. E 86 051122 (2012).
- [15] B. Wang, J. Kuo, S.C. Bae, S. Granick, Nature Materials, 11 481 (2012).
- [16] F. Mondiot, J-C. Loudet, O. Mondain-Monval, P. Snabre, Phys. Rev. E. 86 010401(R) (2012).
- [17] M. Khoury, A.M. Lacasta, J.M. Sancho, K. Lindenberg, Phys. Rev. Lett. 106 090602 (2011).
- [18] B. Dybiec, E. Gudowska-Nowak, Phys. Rev. E 80 061122 (2009).
- [19] Z. Adamczyk, J. Barbasz, M. Ciesla, Langmuir, 26 11934 (2010).
- [20] Z. Adamczyk, J. Barbasz, M. Ciesla, Langmuir, 27 6868 (2011).
- [21] J. Feder, J. Theor. Biol. 87, 237 (1980).
- [22] M. Ciesla, J. Barbasz, J. Stat. Mech. P03015 (2012).
- [23] J. Barbasz, M. Ciesla Acta Phys. Polon. B 44 937 (2013).
- [24] M. Ciesla, J. Barbasz, Colloids and Surf. B 110 178 (2013).
- [25] J. Klafter, I.M. Sokolov, First Steps in Random Walks: From Tools to Applications, Oxford University Press (2011).
- [26] T. Munk, F. Höfling, E. Frey and T. Franosch, EPL 85 30003 (2009).
- [27] S. Havlin, D. Ben-Avraham, Adv. Phys. 51 187 (2002).
- [28] P.G. Klemens, Thermal conductivity of inhomogeneous media, High Temp. - High Press. 23 241 (1991)
- [29] B.Ya Balagurov, J. Exp. Theor. Phys., 113 849 (2011).
- [30] B.I. Shklovskii, Phys. Stat. Solidi 85 K111 (1978).
- [31] B.Ya Balagurov, Russ. J. of Phys. Chem. B 7 71 (2013).
- [32] S. Feng, B. I. Halperin and P. N. Sen, Phys. Rev. B 35 197 (1987).
- [33] I.L. Novak, F. Gao, P. Karikivski, B.M. Slepchenko, J. Chem. Phys. bf 134 154104 (2011).