The role of low-mass star clusters in forming the massive stars in DR 21
Abstract
We have studied the young low-mass pre-main sequence (PMS) stellar population associated with the massive star-forming region DR 21 by using archival X-ray Chandra observations and by complementing them with existing optical and IR surveys. The Chandra observations have revealed for the first time a new highly extincted population of PMS low-mass stars previously missed in observations at other wavelengths. The X-ray population exhibits three main stellar density peaks, coincident with the massive star-forming regions, being the DR 21 core the main peak. The cross-correlated X-ray/IR sample exhibits a radial ”Spokes-like” stellar filamentary structure that extends from the DR 21 core towards the northeast. The near IR data reveal a centrally peaked structure for the extinction, which exhibits its maximum in the DR 21 core and gradually decreases with the distance to the N-S cloud axis and to the cluster center. We find evidence of a global mass segregation in the full low-mass stellar cluster, and of an stellar age segregation, with the youngest stars still embedded in the N-S cloud, and more evolved stars more spatially distributed. The results are consistent with the scenario where an elongated overall potential well created by the full low-mass stellar cluster funnels gas through filaments feeding stellar formation. Besides the full gravitational well, smaller-scale local potential wells created by dense stellar sub-clusters of low-mass stars are privileged in the competition for the gas of the common reservoir, allowing the formation of massive stars. We also discuss the possibility that a stellar collision in the very dense stellar cluster revealed by Chandra in the DR 21 core is the origin of the large-scale and highly-energetic outflow arising from this region.
Keywords:
stellar clusters – X-ray stars – massive star formation.1 Introduction
The formation of massive stars is one of the most debated topic in modern Astrophysics. Although they are a key ingredient in the evolution of galaxies, because they inject large amount of energy and turbulence into the interstellar medium, the processes leading to their formation are not fully understood.
Massive stars are usually born in clusters (Lada & Lada 2003), suggesting that clusters play an important role in massive star formation. Smoothed particle hydrodynamics simulations of massive star forming clumps in a giant molecular cloud carried out by Smith et al. (2009) have shown that the formation of massive stars is closely linked to the formation and early evolution of the whole stellar cluster. Recently, Rivilla et al. (2013) have pointed out that the presence of dense sub-clusters of low mass stars in the Orion Nebula Cluster (ONC) and the Orion Molecular Cloud (OMC) may have been key in the formation of massive stars in this region.
Measuring the population and computing the densities of low-mass star clusters in massive star-forming regions is a challenge because they are usually deeply embedded in the parental molecular cloud (visual extinctions of 15 mag). X-ray observations are particularly useful for studying the obscured population because the high energy photons can deeply penetrate into the cloud despite the high extinction. In addition, the X-rays have the advantage of suffering much less from foreground/background contamination than optical or infrared (IR) studies, thus allowing to carry out a more complete census of the low-mass pre-main sequence (PMS) embedded population in massive star-forming regions.
The DR 21 massive star-forming region is located at 1.50 kpc (Rygl et al. 2012) and belongs to the Cygnus X molecular cloud. It harbors a massive and dense filament-shaped cloud (Chandler et al. 1993, Davis et al. 2007), forming part of a large-scale network of filamentary structures (Schneider et al. 2010). DR 21 exhibits three main regions of massive star formation: i) the DR 21 core, where several ultra-compact (UC) HII regions are detected (Cyganowski et al. 2003); ii) the DR 21(OH) hot molecular core (Chandler et al. 1993); and iii) the FIR 1/2/3 region (Chandler et al. 1993; Kumar et al. 2007).
A high energetic outflow has been detected in the DR 21 core (Garden et al. 1991; Smith et al. 2006; Davis et al. 2007), whose origin is still unclear. The outflow has been suggested to be powered by a massive protostar with a luminosity 105-6 L⊙ (Garden et al. 1991), which corresponds to a zero age main sequence (ZAMS) star with spectral types O7O4 (Panagia 1973). However, such a massive star has not been detected (Cruz-González et al. 2007). Moreover, the luminosity of this object would exceed the total luminosity of the DR 21 region of 105 L⊙ (Harvey et al. 1977). Recently, Zapata et al. (2013) claimed that the outflow appears to have been produced by an explosive event.
In this paper we present the results of X-ray Chandra observations of the massive star-forming region DR 21. We complement these data with publicly available optical and near-IR and mid-IR observations. The paper is organized as follow. In Section 2 we describe the data selection. We present the Chandra X-ray source catalog of the DR 21 cluster obtained from the Chandra XAssist Source List archive, and discuss the source membership to the cluster, possible contamination and completeness. We also present the optical and IR catalogs used to complement the X-ray survey. In Section 3 we show the results of the cross-correlation between the Chandra catalog with the optical and IR catalogs, and study the spatial distribution, density, evolutionary stages and extinction of the stellar cluster. In Section 4 we discuss the implications of our results in the formation of the cluster and of the massive stars in the region. In view of the stellar population revealed by Chandra, in Section 5 we evaluate the possibility of a stellar merger as origin of the large-scale and highly-energetic outflow found in the DR 21 core. Finally, in Section 6 we summarize our findings and give our conclusions.

| Observing run | Date | Time exposure (ks) |
|---|---|---|
| 07444 | 2007-08-22 | 48 |
| 08598 | 2007-11-27 | 20 |
| 09770 | 2007-11-29 | 19 |
| 09771 | 2007-12-02 | 9 |
2 Data analysis
In our analysis we used archival stellar catalogs in X-rays, optical and IR wavelengths. We also made use of the Spitzer 4.6 m and 8 m images (Cygnus-X Legacy Project), and the SCUBA 850 m data (Matthews et al. 2009).
2.1 Stellar catalogs
2.1.1 X-rays source catalog (Chandra)
| DR21-X number | RA (J2000) | DEC (J2000) | Counts | log (erg s-1) | SDSS | UKIDSS | Spitzer-SSTCYGX |
|---|---|---|---|---|---|---|---|
| 1 | 20 39 00.04 | 42 19 36.8 | 36 | 30.89 | - | J203900.04+421936.6 | - |
| 2 | 20 39 00.60 | 42 19 36.9 | 9 | 30.27 | - | - | - |
| 3 | 20 39 00.35 | 42 19 31.0 | 9 | 30.28 | - | J203900.35+421931.7 | - |
| 4 | 20 38 59.95 | 42 19 44.6 | 8 | 29.87 | - | - | - |
| 5 | 20 39 00.92 | 42 19 41.4 | 8 | 30.22 | - | - | - |
| 6 | 20 38 59.55 | 42 19 33.3 | 9 | 30.61 | - | - | - |
| 7 | 20 39 01.30 | 42 19 36.5 | 12 | 30.43 | - | - | - |
| 8 | 20 39 01.11 | 42 19 44.5 | 45 | 30.98 | - | J203901.11+421944.3 | - |
| 9 | 20 38 59.09 | 42 19 39.5 | 12 | 30.03 | - | J203859.08+421939.5 | - |
| 10 | 20 39 00.12 | 42 19 51.6 | 24 | 30.31 | - | - | - |
| 11 | 20 38 59.60 | 42 19 53.4 | 13 | 30.45 | - | J203859.61+421953.2 | J203859.65+421952.9 |
| 12 | 20 39 01.02 | 42 19 54.3 | 5 | 30.10 | - | J203901.01+421954.4 | |
| 13 | 20 39 00.45 | 42 19 59.0 | 20 | 30.63 | - | - | - |
| 14 | 20 39 01.19 | 42 19 18.9 | 7 | 30.21 | - | - | - |
| 15 | 20 39 01.21 | 42 19 18.6 | 84 | 30.85 | - | - | - |
- a
X-ray luminosity not corrected from extinction.
We used the catalog of X-ray sources presented in the Chandra XAssist Source List archive (CXOXASSIST11 1 http://heasarc.gsfc.nasa.gov/W3Browse/chandra/cxoxassist.html, Ptak & Griffiths 2003). This database provides Chandra data that have automatically reduced for sources with sufficient counts. The DR 21 region was monitored in four observing runs between August and December 2007, with net exposure times between 48 and 9 ks (Table 1), with the Advanced CCD Imaging Spectrometer (ACIS) onboard the Chandra X-ray Observatory. The ACIS-I array, consisting of four X-ray CCDs, covered a full region of 17.4 17.4, which comprises the full region of DR 21. The telescope position of the field target was RAJ2000 = 20h 39m 0.70s and DECJ2000 = 42∘ 18 56.8. The Chandra point-spread function at the on-axis position is 0.5. For source detection, the CXOXASSIST catalog used a wavelet transform detection algorithm implemented as the WAVDETECT program within the Chandra Interactive Analysis of Observations (CIAO) package version 4.3.0. with a threshold significance of 10-6. Due to intrinsic X-ray variability of PMS stars (expected to be the vast majority of the X-ray sample, see Getman et al. 2005), not all sources are detected in the 4 observing runs. Therefore, to obtain a complete catalog, we have cross-correlated the samples from the 4 different runs. We have estimated the relative positional error of the sources crossing the runs two by two, and calculating the separation between pair of counterparts within separations from 0 to 4. In Fig. 1 we plot the average separation as a function of the distance to the center of the observation. As expected, the positional error increases with the off-axis distance: remains below 1 for distances 5, and below 1.2 in the outer parts of the region studied in this paper. Therefore, we have considered as the same source those sources from different runs that falls within 1 for distances 5 and within 1.5 for distances 522 2 We note that this cross-correlation provides properly the positions of the Chandra X-ray source catalog of the region, which is the interest for this work. However, for a rigorous derivation of the physical X-ray parameters of the sources (which is not the focus of this paper), a deeper image resulting for sum of the 4 observations runs would be more appropriate.. In the case of sources observed in several runs, since some X-ray variability is present between epochs, we selected the observation with better signal-to-noise ratio33 3 The values for signal-to-noise ratio have been determined in terms of the equivalent number of background fluctuations, defined as the net counts in the source over the square root of the background counts..

In this paper we focus our analysis in a region with radius 7.5 around the center of DR 21, obtaining a final catalog with 281 X-ray sources. The spatial distribution of the full X-ray sample is shown in Fig. 2. We present the list of sources in Table 2, with their coordinates, number of counts and luminosities (not corrected by extinction). The luminosities in the 0.3 to 8 keV energy range have been calculated by using , where is the distance to the region and has been obtained from CXOXASSIST44 4 The values for the X-ray luminosities presented in CXOXASSIST are calculated from a power-law model with a default slope of 1.8. Although little changes are expected, we note that for a more rigorous derivation of the luminosities of the stars (which is out of the scope of this paper), a two-temperatures plasma model would be more adequate (see Getman et al. 2005)..
2.1.2 Optical source catalog (SDSS) and IR source catalogs (UKIDSS and Spitzer)
We complemented the X-ray source catalog with the optical catalog provided by the Sloan Digital Sky Survey (SDSS, data release 955 5 http://www.sdss.org/), and with two archival infrared (IR) surveys: i) the UKIDSS (UKIRT Infrared Deep Sky Survey, Lawrence et al. 2007) Galactic Plane Survey (GPS, data release 6, Ukidss 2012), and ii) Spitzer Space telescope catalog provided by the Cygnus-X Legacy survey 66 6 http://irsa.ipac.caltech.edu/cgi-bin/Gator/nph-scan?projshort=SPITZER,77 7 http://www.cfa.harvard.edu/cygnusX/. The UKIDSS survey observed the region at (1.25 m), (1.65 m) and (2.2 m) bands with the Wide Field Camera (WFCAM) on the United Kingdom Infrared Telescope (UKIRT), with typical 90 completeness limits in uncrowded fields of =18.0, =18.75 and =19.5. The Infrared Array Camera (IRAC) onboard the Spitzer telescope observed in band 1 (3.6 m), band 2 (4.5 m), band 3 (5.8 m) and band 4 (8.0 m), with 90 completeness limits in uncrowded fields of 14.98, 14.87, 13.82, and 12.60, respectively (Beerer et al. 2010). We cross-checked the DR 21 X-ray catalog with these catalogs, searching counterparts for the X-ray sources within a radius of 1. In the case that two sources fall within this radius, we selected the best match. In Table 2 we also present the association between X-ray and SDSS, UKIDSS and Spitzer sources. In Fig. 3 we show an scheme summarizing the subsamples resulting from the cross-correlation with the different catalogs.

2.2 Foreground/background contamination
While foreground and background galactic sources produce significant contamination in the IR studies of young clusters, X-ray surveys have the advantage of presenting very little galactic contamination, because PMS stars emit X-rays at levels 10-104 times higher than foreground/background main-sequence stars (Preibisch & Feigelson 2005). Several works (Getman et al. 2005; Townsley et al. 2011; Mucciarelli et al. 2011) have shown that X-ray studies are very effective in revealing the embedded young stellar population in clusters, discriminating the PMS cluster members from unrelated older stars. Besides the sensitivity limit, which will be discussed in Section 2.3, this is mainly because IR surveys are affected by a much higher foreground/background contamination. However, X-ray sources could still be confused with extragalactic (EG) sources. In that case, other criteria, like spatial distribution, must be used to distinguish between cloud members and unrelated sources.
To discriminate the embedded young stellar population from foreground stars, we cross-checked the X-ray source catalog with the SDSS optical survey. We found that 73 out of the 281 X-ray sources (26) have SDSS counterpart (X/SDSS sample). Most of these sources have visual extinctions 5 mag88 8 We have estimated their extinction from their location in a vs. diagram (not showed), using the colors of their UKIDSS counterparts., confirming that they are likely galactic foreground stars unrelated with the cluster. This percentage is the same that was found by Mucciarelli et al. (2011) in the S255-IR cluster. The remaining 208 sources (X/noSDSS sample) are candidates to DR 21 cluster members. We cross-checked this non-optical X-ray sample with the UKIDSS and Spitzer source catalogs finding that 102 X-ray sources have UKIDSS and/or Spitzer counterparts (X/noSDSS/IR sample). The spatial distribution of these very likely cluster members is shown in left panel of Fig. 4.
The remaining X-ray sources without UKIDSS/Spitzer counterpart (106 sources, X/noSDSS/noIR sample) can be new cluster members which are not detected at IR wavelengths (likely because they suffer high extinction) or EG contamination, whose infrared emission is usually too faint to be detected in the IR catalogs. To estimate the expected number of EG sources we used the contamination detected in the more sensitive Chandra observations of the Orion Nebula Cluster (Chandra Orion Ultra Deep Project, COUP, Getman et al. 2005, 850 ks) and the Carina Nebula (Chandra Carina Complex Project, CCCP, Townsley et al. 2011, 80 ks). The COUP analysis classified 10 of the total detected sources as EG contaminants. In DR 21 this would be 28 sources. The CCCP observation exhibits 1.5 EG contaminants per deg2. Scaling these numbers to the field-of-view of DR 21, we obtain 20 sources. Taking into account that these observations are deeper, and then more EG contamination is expected (especially in the very deep COUP), we set an upper limit of 20 EG contaminants in the X/noSDSS/noIR sample. Namely, more than 80 of these sources are likely new cluster members detected by Chandra for the first time. We can also use the spatial distribution as a criteria to discriminate between heavily embedded cluster members and background EG sources99 9 The presence of X-ray flare events has been also used in previous works (see Getman et al. 2005) to identify cluster members from EG contaminants. However, we can not use this criteria because X-ray light curves for the DR 21 sources are not available.. The former are expected to be located preferentially in the more extincted region, which is the N-S cloud traced by the 850 m SCUBA dust emission, while the latter are expected to be distributed throughout the whole field. The right panel of Fig. 4 clearly shows that a significant fraction (30) of the X/noSDDS/noIR sample are distributed along the cloud, peaking at the DR 21 core. We conclude thus that these sources are heavily obscured cluster members. The classification of the other sources (80) is less clear. According to the estimates of the EG contamination, up to 20 could be contaminants, while the remaining would be stars of the cluster.


2.3 Completeness
We can estimate the sensitivity limits of the X-ray source catalog of DR 21 from the distribution of X-ray luminosities of the detected sources. In Fig. 5 we show the histogram of the X-ray luminosities (not corrected from extinction) of the DR 21 population. The minimum value of log is 29.69 erg s-1. Using the correlation between and the stellar mass found by Preibisch & Feigelson (2005) in the Orion Nebula Cluster, this is equivalent to a lower mass limit of 0.38 M⊙. Considering a typical initial mass function (IMF) of young clusters (Chabrier 2003), and a range of masses in the cluster between 0.02 and 10 , the population detected would represent 52 of the total cluster population.
An alternative method to estimate the fraction of stars that Chandra observations has detected towards DR 21 is to calculate the fraction of stars that COUP detected with luminosities above the DR 21 limit of log = 29.69 erg s-1. Fig. 5 shows the histogram of X-ray luminosities (also without extinction correction) of the Orion Nebula Cluster (COUP, Getman et al. 2005), whose census can be considered nearly complete1010 10 With the exception of the population heavily embedded in the Orion Molecular Cloud, see Grosso et al. (2005).. It is clear that the Chandra DR 21 observation is biased to detect the brighter X-ray sources. The fraction of COUP sources with log 29.69 erg s-1 is 45. This is a value similar to the one obtained previously, indicating that the Chandra observation of DR 21 detected around half of the total cluster population in those region in the absence of extinction.
This fraction is obviously even lower in the obscured regions, like the N-S cloud traced by the 850 m dust emission. Grosso et al. (2005) estimated that in the obscured regions in Orion like the Orion Hot Core and OMC1-S regions (which suffers 25 mag) the X-ray observation detected 48-63 of the sources due to obscuration. Therefore, in regions with such high extinctions, like the DR 21 core (see Section 3.1), it is expected that the X-ray observations only detect a half of the population due to extinction. Furthermore, we need to take into account the likely presence of unresolved binaries that the spatial resolution of Chandra is unable to resolve.
To summarize, the Chandra observations of DR 21 have detected a new population of deeply embedded stars. Our analysis indicates that we underestimate the population of stars by a factor of 2 for the regions with low extinction and by a factor of 4 for the highly extincted regions ( 25 mag.).
3 Results: The new X-ray PMS stellar population in DR 21
3.1 X-ray sources with UKIDSS counterparts
The cross-correlation with the UKIDSS catalog shows that 162 X-ray sources within the sample have UKIDSS counterpart (58). For comparison, in the S255-IR star-forming region, the embedded cluster observed with Chandra (Mucciarelli et al. 2011) has a similar IR counterpart fraction of 63. Considering the X/noSDSS sample, 93 of the 208 sources (45) have UKIDSS counterparts (X/noSDSS/UKIDSS sample). The spatial distribution of this sample is shown in the left panel of Fig. 4. It shows a centrally peaked distribution of the stars, with the DR 21 core as the main feature. The morphology of this population shows a filament-like feature towards the NE, with origin in the DR 21 core. In Section 4 we will discuss the possible implications for star formation inferred from this observed structure.
In Fig. 6 we show the vs. color-color diagram of the X/noSDSS/UKIDSS sample. Stars without strong emission from a disk have colors typical of extincted zero-age main sequence (ZAMS) stars and populate the confined region between the two leftmost black dotted lines. Stars with the presence of accretion disks, populate the region between the two rightmost dotted lines, while those with additional IR excess dominated by infalling envelopes should be found in the rightmost region of the diagram. Besides the sources detected in , and bands, there is a significant fraction of X/noSDSS/UKIDSS stars detected in and bands, but not in the band due to extinction. For those sources, we have considered lower limits for the color , using the UKIDSS detection limit for the J band (=19.5 mag, Lawrence et al. 2007; Ukidss 2012).


From the color-color diagram we estimate the extinction suffered by the stars.1111 11 The extinction could also be derived from the values for the hydrogen column density from the fitting of the X-ray spectra of the sources. However, CXOXASSIST only provides values for sources with 100 counts (less than 10 sources). A more detailed spectroscopy study of the X-ray spectra for the full sample would be needed to calculate . Using the extinction law by Rieke & Lebofsky (1985), the color index (in absence of significant near IR emission from disk or envelopes) is related with the visual absorption with the expression: = (-0.2)/0.0631212 12 We adopted =0.2 as the typical intrinsic color of most stars (Siess et al. 2000).. We used this expression to calculate the extinction of sources without near IR excesses. According to Fig. 6 the presence circumstellar disks produce an average excess in the color of 0.3 mag. We estimate then the extinction suffered for the stars with excesses subtracting this contribution to the measured value of . For those sources not detected in we calculate lower an upper limits for the extinction. For the upper limits we consider that the star do not show a near IR excess, i.e., the is only due to extinction (without contribution from disk/envelope). For the lower limits we consider a maximum disk/envelope contribution, assuming that the values are those corresponding to the limit for detection in band (magenta dashed line in Fig. 7), and subtracting the excess due to disk/envelope material. Following Rivilla et al. (2013), we show in Fig. 8 the spatial distribution of the X/noSDSS/UKIDSS sources as a function of extinction: stars with 15 mag (blue dots), stars with 15 mag 20 mag (green dots), and stars with 20 mag (red dots). We also include (red triangles) the sources not detected in the band, expected to be highly embedded. This analysis shows that the X/noSDSS/UKIDSS sources with higher extinction follow the N-S cloud, those with intermediate extinction are concentrated along the NE stellar filament, and those with lower extinction are more distributed and located at larger distances from the cloud. The sources not detected in are concentrated along the cloud, mainly surrounding the DR 21 core, DR 21(OH) and the FIR 3 source, confirming that they are more embedded objects.
In Fig. 7 (left panel) we show the extinction versus the distance to a N-S axis following the 850 m emission from the cloud. It is clear that the extinction increases when the distance to the cloud axis decreases. The X/noSDSS/UKIDSS sources detected in all three near IR bands show extinctions up to =30 mag, peaking in the inner part. This extinction peak is similar to the one found in the low resolution extinction map from Schneider et al. (2006) from the Two Micron All Sky Survey (2MASS). However, the observations from Hennemann et al. (2012) showed that the extinction is even higher in the inner region of the cloud (dashed black curve in Fig. 7)1313 13 We have used the relation /=21021, which is an intermediate value between the relations found by Ryter (1996) and Vuong et al. (2003).. Since the UKIDSS survey is deeper than the 2MASS survey, we expect to detect stars more embedded in the cloud. Actually, as indicated Fig. 7, the X/noSDSS/UKIDSS sources not detected in band are located in the inner region of the cloud, and show extinctions between =20 mag and =50 mag, consistently with the column density profile from Hennemann et al. 2012. In Section 3.4.2 we will show that in the very inner region there are even more extincted stars only detected by Chandra.
In the right panel of Fig. 7 we show the value of the extinction with respect to the center of the cluster, located in the DR 21 core. With the only exception of some high-extincted stars around DR 21(OH) (1 pc) and the FIR 1/2/3 region (2.2 pc), there is also a clear overall trend in the extinction, gradually decreasing with increasing distance to the cluster center.


3.2 X-ray sources with Spitzer counterparts
The cross-correlation between the Chandra and the Spitzer-IRAC source catalogs shows that 145 X-ray sources have UKIDSS counterparts (52). Considering only the X/noSDSS sample, 77 of the 208 sources (37) have Spitzer counterparts (X/noSDSS/Spitzer sample), of which 68 have UKIDSS counterpart (X/noSDSS/UKIDSS/Spitzer sample). Many works have shown that the IRAC data are very efficient identifying young stellar objects, because it detects excess emission well above that expected from reddened stellar photospheres that originates from the dusty circumstellar disks and envelopes surrounding young stars (Allen et al. 2004; Harvey et al. 2006; Jørgensen et al. 2006).
In the right panel of Fig. 2 we presented the spatial distribution of the X/noSDSS/Spitzer sample. Similarly to the X/noSDSS/UKIDSS sample, the morphology of this population shows the NE filament-like feature. Compared with UKIDSS, Spitzer detected less sources in the inner DR 21 core. Besides the higher extinction in the DR 21 central region (which also affect UKIDSS), this is likely due to two other factors: i) the lower Spitzer spatial resolution prevents a complete census of crowded dense clusters (Mucciarelli et al. 2011) like the one found in the DR 21 core; ii) the extended emission from the large outflow (detected in all 4 IRAC bands) decreases the sensitivity to detect point-like stellar sources1414 14 The decrease of sensitivity due to extended emission from the large outflow can also affect the UKIDSS observations in the band, but barely in the and bands, where the outflow is not detected..
From the IRAC colors, it is possible to classify the stars as Class I, Class II and Class III (according to the classification from Wilking & Lada 1983), which indicates their evolutionary stage, from earlier to more evolved. Since extragalactic sources may also be misidentified as young stars or protostars, we use a magnitude-color diagram ([8.0] vs. [4.5]-[8.0], Whitney et al. 2003, Jørgensen et al. 2006, Harvey et al. 2006) that allows the discrimination of EG contamination. The left panel of Fig. 9 shows the extinction-corrected [8.0] vs. [4.5]-[8.0] diagram of the X/noSDSS/Spitzer sample. It is remarkable that none of the sources fall in the region expected for extragalactic contaminants, in agreement with the low extragalactic contamination discussed in Section 2.2.
Although the [8.0] vs. [4.5]-[8.0] diagram effectively discriminate EG contaminants, the relatively poor sensitivity and spatial resolution of the longer wavelength IRAC 8.0 m band (see Ukidss 2012) prevents the classification of many stars. For this reason, to classify the sources in their evolutionary stages we use the -[3.6] vs [3.6]-[4.5] diagram, which in the DR 21 region is able to classify a number of stars twice than the [8.0] vs. [4.5]-[8.0] diagram. The right panel of Fig. 9 shows the -[3.6] vs [3.6]-[4.5] extinction-corrected diagram of the X/noSDSS/Spitzer sample. Since background planetary nebulae and asymptotic giant branch (AGB) stars may also be misidentified as young stars, some of the stars in the Class III region could be stellar contamination unrelated with the cluster. However, the cross-correlation between the Spitzer and Chandra samples makes unlikely this possibility, because X-ray emission from PMS stars is significantly higher than that from main sequence or post-main sequence stars.
The diagram shows that most of the stars with near IR excesses (Section 3.1) are Class II objects, while those without excesses are Class III objects. This is expected because Class II objects are younger PMS stars that still exhibit optically thick circumstellar disks, while Class III objects are more evolved PMS stars with colors more similar to naked stellar photospheres1515 15 Although we note that it is well known that longer IR wavelengths (-band or Spitzer bands) are much more effective (and hence more reliable) to detect excesses from the disk and envelopes (Lada et al. 2000)..
The spatial distribution of the different evolutionary classes from the -[3.6] vs [3.6]-[4.5] diagram is shown in Fig. 10. The youngest objects (Class I1616 16 We have included as Class I candidates those stars not detected in the band whose whose flux corrected with the lower extinction fall in the Class I region.) are found along the N-S cloud, while the subsequent evolutionary stages are more distributed. The NE stellar filament is composed by mainly Class II/III stars, suggesting that this stellar population is more evolved than that embedded in the cloud.

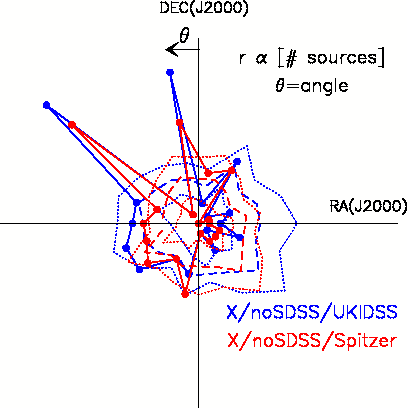
3.3 Angular distribution of the stellar population: the NE filament
We showed in Section 3 that the X/noSDSS/UKIDSS and X/noSDSS/Spitzer samples exhibit in DR 21 an elongated structure from the DR 21 core towards the NE that resemble these radial filaments. In Fig. 11 we plot the angular distribution of the two stellar samples, in angular bins of 20 deg. The presence of the NE stellar filament is evident at 50 degrees. There is also other peak in the angular distribution, at 10 degrees, caused by the sub-clusters around DR21(OH) and FIR 1/2/3 (see Section 3.4) rather than by an stellar filament. To confirm that the NE feature is real and not caused by a random fluctuation in the stellar spatial distribution, we carried out a Montecarlo analysis. For each sample, we generate artificial clusters with random distributions. We show in Fig. 11 the average value and 1 standard deviation values of the set of 10 Montecarlo runs for each angular bin. While the simulations show an approximately isotropic distribution, the observed distribution in DR 21 clearly peaks in the two directions previously noted. Therefore, it is clear that the NE filament is well above the noise level, clearly showing that it is not due to a chance alignment of sources.


3.4 Stellar densities: sub-clusters of PMS stars
3.4.1 Stellar density maps
We have seen that the distribution of the Chandra sample (Fig. 2) are not homogeneously distributed over the DR 21 region, but centrally clustered towards the DR 21 core. Following Rivilla et al. (2013), we compute the stellar density of the X/noSDSS sample (208 sources) using a spatial gridding method. We count the number of stars in square cells with three different sizes: 120120 (0.87 pc0.87 pc), 6060 (0.44 pc0.44 pc) and 3030 (0.22 pc0.22 pc). We choose the cell sizes to match the size range of the clumps resulting from the fragmentation of molecular clouds (Williams et al. 2000; Saito et al. 2007) where massive star formation is expected to occur. The results are presented in Fig. 12. We remark that, according to our completeness estimates, almost 50 of the cluster members still remain undetected in the regions without extinction due to sensitivity limits and only 25 of the sources are detected in the regions affected by extinction (Section 2.3). This means that the stellar densities that we obtained should be multiplied by factors of 2 or 4, respectively. Moreover, even these completeness corrected densities must be considered as lower limits due to the likely presence of binary and multiple systems not resolved by Chandra spatial resolution.
The lower resolution spatial gridding (120120 cell) reveals the general large-scale structures of the cluster. The NE stellar filament is also evident in the stellar density contours. The overall elongated N-S morphology of the X-ray population, peaking in the DR 21 core, agrees with the distribution of the molecular cloud traced by its dust emission at 850 m measured with SCUBA.
The spatial gridding with the 6060 cell reveals the more compact clustering of stars, with three well defined peaks along the cloud. The main peak is located in the central core of DR 21, coincident with the location of the young massive stars exciting the UC HII regions (Cyganowski et al. 2003). A secondary density peak is located at the molecular hot core DR 21(OH) (Chandler et al. 1993), an a third peak is located around the FIR 1/2/3 young massive stars.
The morphology of the stellar density from the 3030 grid also peaks clearly in the three massive star forming regions, following the N-S cloud seen at 850 m (see right panel in Fig. 12). With this higher resolution grid the DR 21(OH) population splits into two sub-clusters, with the more dense located SE the DR 21(OH) main peak. This sub-cluster is coincident with a secondary peak in the 850 m map (also detected at 1200 m, see Chandler et al. 1993), and located close of the center of the massive (8 M⊙) dense cores CygX-N48 MM1 and MM2 (Bontemps et al. 2010), that are candidates to form massive stars. The stellar sub-cluster revealed by Chandra is embedded in the cloud, with 20 mag1717 17 One of their members is detected in and bands, but not in band, show extinction 20 mag (Section 3.1) and it is classified as Class I candidate (section 3.2). Two other members are only detected in the band, and other is not detected by UKIDSS, suggesting that they are all more embedded in the cloud., and may represent the outer part of the more obscured CygX-N48 cluster of cores (log23 cm-2, from Bontemps et al. (2010), i.e., 50 mag). Similarly, the massive dense cores CygX-N53 MM1 and MM2 are located very near the FIR 3 stellar density peak, suggesting that they could be related.
The DR 21 core shows a clear centrally peaked distribution. To provide quantitatively a value for the cluster size we use the clustering parameter () defined by Rivilla et al. (2013) as the ratio between the number of sources found in the 0.22 pc0.22 pc cell and the number found in the 0.44 pc 0.44 pc cell. Our results show that the clustering parameter in the DR 21 core of =0.47. If we assume a Gaussian distribution for the stellar density e (where r is the distance to the center of the cluster and is defined as the cluster diameter), =0.47 corresponds to 0.6 pc. This cluster size is in the typical range for molecular clumps regions of enhanced density within a molecular cloud which will typically form stellar clusters (Williams et al. 2000; Smith et al. 2009).

3.4.2 Cumulative stellar density radial profile
We have shown in previous sections that the DR 21 low-mass stellar cluster is centrally condensed, with its density peak towards the DR 21 core. In this section we derive the radial stellar density profile of the DR 21 core cluster by calculating the cumulative stellar density with respect to the cluster center. We considered that the center of the cluster coincides with the location of the stellar density peak seen in the 0.22 pc 0.22 pc grid (see Fig. 12). We count the number of stars of the X/noSDSS sample within concentric circles with radius increasing in 0.01 pc steps. We considered as the innermost concentric circle the one containing at least 2 stars. The results are presented in Fig. 13. According with the completeness discussion in Section 2.3 we also present the stellar densities corrected by a factor of 2, which accounts for the limited sensitivity of the DR 21 Chandra observation. The cluster follows an approximate radial profile with the exception of the very inner region. This is likely due to the higher extinction in the central part of the core, that prevents the detection of stars with weaker X-ray emission.
We compare the cumulative radial density profile of the X/noSDSS sample with the X/noSDSS/UKIDSS and X/noSDSS/UKIDSS/Spitzer samples. Obviously the stellar density of the X/IR samples are lower because they are subsamples of the Chandra sample. The plot shows that Spitzer is not effective detecting cluster members in the inner 0.25 pc, because as already mentioned, it likely suffers from source crowding and from extended emission from the large outflow. The X/noSDSS/UKIDSS sample, less affected by extended emission, detect sources until 0.15 pc, but only Chandra has revealed the stellar population for smaller distances. The high extinction in the very inner region of the core (Section 3.1) prevents the detection of the stellar population at IR wavelengths. However, the X-ray observations are capable to detect sources more deeply embedded (Mucciarelli et al. 2011; Rivilla et al. 2013). Note that even the X-ray population seems to be heavily affected in the very inner region of the cluster, where the extinction is extremely high, and where the measured stellar density in the Chandra sample also deviates from the profile.
The different profiles of the samples also reflect the centrally peaked structure of the extinction. The profiles gradually deviate one from another for smaller distances to the cluster center. While the density of the X/noSDSS sample increases following the profile, the densities of the X/noSDSS/UKIDSS and X/noSDSS//UKIDSS/Spitzer exhibit less steep profiles. We interpret this as a consequence of the extinction in the cluster (Fig. 7).
4 Competitive accretion scenario for cluster and massive star formation
One of the main results of this paper is that the density of PMS low-mass stars peaks at the massive star cradles: DR 21 core, DR 21(OH) and FIR/1/2/3 region. Beerer et al. (2010) also found that young stars tend to cluster around massive B stars in the Cygnus X region from their Spitzer data. This close association between the low-mass star clusters and the massive star cradles was also reported towards the ONC and OMC (Grosso et al. 2005; Rivilla et al. 2013). This suggests that not only dense gas plays a role to form massive objects, but also a cluster of low-mass stars, in agreement with the ”competitive accretion” theory of massive star formation (Bonnell et al. 2004; Bonnell & Bate 2006; Smith et al. 2009). According to this theory stars located in the densest regions of a stellar cluster benefit from the local potential wells created by the stellar population, and can gather enough mass to become massive.
This scenario predicts three main features: i) massive stars are born in the low-mass stellar density peaks; ii) an overall centrally condensed structure of the extinction, because the potential well funnels gas and dust towards the cluster center; and iii) an overall mass segregation, with the more massive stars expected to be found in the central regions of the cluster.
These 3 conditions are well fulfilled in the ONC/OMC region (Hillenbrand & Hartmann 1998; Allison et al. 2009; Rivilla et al. 2013). As we have shown in Sections 3.1 and 3.4, the first and second conditions are also met in DR 21 region. With the aim of studying the third condition, i.e., the level of mass segregation in the DR 21 region, we use the IR fluxes corrected by extinction () of the X/noSDSS/UKIDSS sample without IR excesses. Whether the IR emission of the sources is not affected by the presence of disks or envelopes, the value of the corrected IR emission is a good proxy for the stellar masses (Siess et al. 2000). Fig. 14 shows that the fluxes in the and bands gradually decrease with increasing distance to the cluster center. Obviously, the central structure of the extinction (right panel of Fig. 7) bias the detection of fainter objects in the inner region where the extinction is higher. However, the important point here is that there is not a population of bright (more massive) stars at larger distances where the extinction is expected to be lower. This pattern is very similar to the result obtained from the competitive accretion simulations from Bonnell et al. (2001) (see their Fig. 3), and shows that the mass segregation in the DR 21 complex could be explained by the competitive accretion scenario.

Supporting this idea, several works (Kumar et al. 2007, Schneider et al. 2010, Hennemann et al. 2012) have found several dusty and molecular filaments falling into the DR 21 N-S cloud. Hennemann et al. (2012) suggested that the mass accretion through these filaments is driven by the gravitational potential of the full cloud. These infalling filaments provide a continuous mass inflow into the cloud and replenish the available mass reservoir. Kumar et al. (2007) suggested that this morphology of filaments compare well with simulations relying on the competitive accretion scenario (Bate et al. 2003). Actually, the results of the Smith et al. (2009) simulations (see their Fig. 1), based on competitive accretion, shows a morphology very similar to the one found in DR 21, with gas filaments feeding the star formation in narrow filament-like structures.


Since the filaments are gravitationally unstable (Hennemann et al. 2012), the inflowing material can fragment (Csengeri et al. 2011) and form stars. As a result, a stellar filament is formed. Since the filaments point towards the accretion center, these filaments can exhibit a radial structure that resembles the spokes of a wheel. Teixeira et al. (2006) detected this ”Spokeslike” structure in the stellar cluster NGC 2264, with the more massive stars located towards the center. The morphology of the stellar population in radial filaments is thought to represent primordial structures in the formation of stellar clusters (Bate et al. 2003; Kurosawa et al. 2004; Teixeira et al. 2006). We have detected in DR 21 a similar structure. In Section 3 and Section 3.3 we showed that the X/noSDSS/IR samples exhibit an stellar filament from the DR 21 core towards the NE.
Once the gas fall towards the cloud, it can feed further stellar formation. The overall gravitational well will funnel a significant fraction of gas and dust to the DR 21 core (explaining the observed overall centrally peaked structure of the extinction), and favoring the formation of a dense low-mass stellar cluster and massive stars at the center, as observed in the DR 21 core. However, this do not rule out that massive stars can also born in outer parts of the cluster. The denser sub-clusters of low-mass stars can also benefit from their own small-scale gravitational potential wells, winning the competition from the surrounding mass reservoir and allowing the formation of massive stars. We propose that this mechanism could explain the massive star formation in the the DR 21(OH) and FIR 1/2/3 regions (which show secondary peaks in the extinction, see right panel of Fig. 7).
In agreement with this scenario, the millimeter interferometric observations from Bontemps et al. (2010) showed that the dense condensations of gas that are expected to be the earliest stages of massive star evolution in the DR 21 cloud (CygX-N48 and CygX-N53, in the DR 21(OH) and FIR 1/2/3 regions, respectively) appears fragmented, forming sub-clusters. Csengeri et al. (2011) proposed that significant amount of competitive accretion may be present in these condensations. In this direction, Rivilla et al. (2013) pointed out that the low-mass stellar population found in the massive star-forming regions in Orion strongly indicates that the natal condensations suffers high levels of fragmentation, forming sub-clusters of low-mass stars rather than single massive objects.
A consequence of the proposed scenario for the DR 21 cluster formation is that one also would expect that the younger stars of the cluster are located along the overall potential gravitational well, where the material from the natal cloud is funneled via the filaments. We discuss here some aspects about the estimated ages of the DR 21 stellar population.
Prisinzano et al. (2008) and Ybarra et al. (2013), combining Chandra and Spitzer data, found a relation between the extinction of the stars and their evolutionary phase: the more extincted the star appears, the younger the star is. Given that the extinction is significantly higher along the N-S cloud, and in particular in the DR 21 core, this would imply an analogous distribution of stellar ages. Kumar et al. (2007) already pointed out that the Spitzer sources with higher IRAC spectral indexes (indicative of youth) are distributed along the dense cloud and also coincident with signposts of massive star formation. Beerer et al. (2010) also find that the younger Class I objects follow the cloud, while the Class II object are more distributed. Our classification of the X/noSDSS/UKIDSS/Spitzer sample also shows that the youngest sources are located within the molecular cloud (Section 3.2).
Using the relation between the extinction and the age found by Ybarra et al. (2013) in the Rossete Nebula, the visual extinction suffered by the stars more deeply embedded in the cloud (15 mag, left panel of Fig. 7) implies that their expected age is 105 yr, in agreement with the estimated age for Class I objects (André 1994; Evans et al. 2009).
To check this we have determined quantitatively the age of one of the embedded stars in the cloud, DR 21-D1818 18 We note that this source is not included in the general analysis of this paper because Chandra did not detect emission, very likely due to the very high absorption produced by the dense circumstellar material.. This source is located in the core of DR 21, believe to ionize the UC HII region D (Cyganowski et al. 2003). We fitted the spectral energy distribution of the source with the Robitaille et al. (2006) stellar models, using the -band flux from UKIDSS, the Spitzer fluxes, and the SCUBA 850 m flux. In Fig. 15 we show the results of the best 100 models. We obtain that this object is a 1011 M⊙ star with a luminosity of 104 L⊙, heavily obscured by 100, with a very massive circumstellar envelope and with an estimated stellar age of 105 yr. This is fully consistent with our previous estimate of the age of the stars deeply embedded within the N-S cloud. On the other hand, Fig. 10 shows that more evolved (but still young) stars (Class II), with an estimated age of 106 yr, exhibit a more spatially distributed configuration. The NE stellar filament has a population of Class II and Class III objects, indicating that they a more evolved that the sources detected in the cloud (Fig. 10). This would imply that the stellar filament has already consumed a significant fraction of the initial gas, in agreement with the lower extinction we have found (Section 3.1 and Fig. 8). This also explain why the filament is not clearly detected at 8 m, far-IR (Hennemann et al. 2012), 850 m or by molecular observations. We note that the absence of the Class II/III objects along the N-S cloud could be caused by the higher extinction in this region. However, the non detection of Class I sources in the outer parts of the field clearly indicate that the more youngest sources are concentrated in the cloud. This age segregation would be consistent with the competitive accretion formation of the cluster, although needs to be confirmed by higher sensitivity observations at mid-IR, far-IR and submillimeter wavelengths of the individual stars.
In summary, all the findings of this work and previous observations agree with the predictions of the scenario where massive star formation is directly linked to the formation and early evolution of the low-mass stellar clusters, and where competitive accretion plays a crucial role.

5 A stellar collision as the origin of the large-scale outflow?
The Chandra detection of a dense stellar cluster of young stars in the core of DR 21, at the expected position of the explosive event proposed by Zapata et al. (2013) (see Fig. 16), leads us to consider the possibility of a coalescence of stars as the origin of the highly-energetic outflow.
Zapata et al. (2011) proposed that the large-scale outflow in Orion BN/KL region was produced by an explosive event. Indeed, this is a plausible scenario since Rivilla et al. (2013) found that the stellar cluster density is 106 stars pc, making the collision between two stars a likely event. Although the stellar density in the DR 21 region is about one order of magnitude lower than that found in the Orion BN/KL region, one may wonder whether a collision can also have occurred in the DR 21 core. A collision event in a dense cluster is favored by the presence of circumstellar disks via disk-captures, which enhance the probability of an encounter (Zinnecker & Yorke 2007; Davies et al. 2006; Bonnell & Bate 2005). This opens the possibility of having stellar mergers that may generate a powerful outflow.
Rivilla et al. (2013) studied a collision involving disks and obtained an expression for the expected time of collision between two stars, (their Eq. A.4.). In Fig. 17 we show versus the stellar velocity (). We used similar stellar parameters to those derived for DR 21 D (Section 4), i.e., masses of M∗=10 M⊙ with disks of 0.1 M∗ and radius of 100 AU. We considered the stellar density estimated in the region in Section 3.4. As indicated by Bonnell & Bate (2006), one might expect that the stars forming part of a young cluster like that in the DR 21 core have a low-velocity dispersion. These authors proposed to use values as low as 0.4 km s-1. Gómez et al. (2008) claimed that typical random motions of recently formed stars have a velocity dispersion of 12 km s-1. As an example, the ONC has a measured stellar velocity dispersion of 2.3 km s-1 (van Altena et al. 1988). With these values, Fig. 17 shows that a single collision in the system can occur in 12 105 yr. Given that the expected age for the stellar cluster embedded in the DR 21 core is around this value, we propose that a collision may have occurred in the center of this dense cluster, which could have led to the explosive event described in Zapata et al. (2013) and possible origin of the large-scale DR 21 outflow.
The energy lost produced during the collision between the disks of two stars can lead to the decay of the system, producing at the end a direct collision between the two stars. In that case, the energy released would be (Bally & Zinnecker 2005), where is the gravitational constant, is the stellar mass, and is the radius of the collision. At that moment the radius of the collision corresponds to twice the value of the stellar radius. Considering then two 10 M⊙ stars with and = 2 R 80 R⊙1919 19 We considered the radius of a 10 M⊙ star with an age of 105 yr, extrapolating from the PMS models of Siess et al. (2000)., the energy produced by the collision would be 5 1048 ergs, which is of the same order as that observed in the DR 21 core (Zapata et al. 2013). Therefore, such a violent event produced by the coalescence of two massive members of the dense DR 21 stellar cluster could occur, and this would explain the highly-energetic outflow observed in the region.
The stellar collisions producing large-scale outflows that may have occurred in DR 21 and Orion BN/KL regions suggest that these events might be more frequent than previously thought during the earliest phases of formation of dense stellar cluster harboring massive stars.

6 Summary and conclusions
We presented for the first time the results of X-ray Chandra observations of the massive star-forming region DR 21. They are summarized as follows:
- The X-rays observations have revealed a new highly embedded population of PMS low-mass stars previously missed in observations at other wavelengths.
- The spatial distribution of the young low-mass PMS stars emitting X-rays shows a central concentration around the DR 21 core. The densest sub-clusters of low-mass stars coincide with the regions of massive star formation: the DR 21 core, DR 21(OH) and the FIR 1/2/3 region.
- The X/noSDSS/IR sample of stars shows a stellar filament from the DR 21 core towards the NE, resembling a ”Spokes-like” structure.
- We obtained the structure of the extinction, which decreases when the distance to the axis of the N-S cloud increases, in agreement with dust observations. Moreover, we found that the extinction also globally decreases with respect to the distance to the cluster center located in the DR 21 core.
- We classified the X/noSDSS/UKIDSS/Spitzer PMS stars in different evolutionary phases. Consistently with previous works, we find evidences for an age segregation, with the younger population (Class I) embedded in the N-S cloud, and more evolved sources (Class II/III) more distributed along the NE stellar filament and the rest of the field.
- We found that the low-mass stellar population of the full cluster appears globally mass-segregated, with a trend of more massive stars at the center.
- The high stellar density found in the stellar cluster embedded in the DR 21 core may have induced the coalescence of two massive stars. We propose that this event could be the origin of the large-scale and highly-energetic DR 21 outflow detected in the region.
Our findings are consistent with a picture where the evolution of the stellar cluster and massive star formation are regulated by competitive accretion. The gravitational potential well of the full cluster accretes large amounts of gas through dusty and molecular filaments. These infalling filaments can also fragment and form stars, producing stellar filaments like the one observed in DR 21. Since the stellar density (and hence the gravitational potential) is centrally peaked towards the DR 21 core, a significant fraction of the material is funneled towards the center, where the densest low-mass stellar cluster is detected. This would explain the observed structure of the extinction, that increases when the distance to the DR 21 core center decreases. However, this does not mean that massive stars can not be formed outside the DR 21 core, as observed. In addition to the full potential well, the dense sub-clusters of low-mass stars can act at smaller scales. Their own local gravitational potential wells contribute to the competition for the surrounding gas reservoir, allowing the formation of massive stars in the DR 21(OH) and FIR 1/2/3 regions.
Acknowledgments
We thank the anonymous referee, whose detailed and thoughtful comments and suggestions helped to improve significantly the original version of this paper. This work has been partially funded by MICINN grants AYA201021697C0501 and FIS201239162C0601, and Astro Madrid (CAM S2009/ESP1496), and CSIC grant JAEPredoc2008. I.JS. acknowledges the financial support received from the People Programme (Marie Curie Actions) of the European Union’s Seventh Framework Programme (FP7/20072013) under REA grant agreement number PIIFGA2011301538.
References
- Allen et al. (2004) Allen L. E., Calvet N., D’Alessio P., Merin B., Hartmann L., Megeath S. T., Gutermuth R. A., Muzerolle J., Pipher J. L., Myers P. C., Fazio G. G., 2004, ApJS, 154, 363
- Allison et al. (2009) Allison R. J., Goodwin S. P., Parker R. J., Portegies Zwart S. F., de Grijs R., Kouwenhoven M. B. N., 2009, MNRAS, 395, 1449
- André (1994) André P., 1994, in T. Montmerle, C. J. Lada, I. F. Mirabel, & J. Tran Thanh Van ed., The Cold Universe, Proceedings of the 28th Rencontre de Moriond, Les Arcs, France, March 13-20, 1993. Observations of protostars and protostellar stages. p. 179
- Bally & Zinnecker (2005) Bally J., Zinnecker H., 2005, AJ, 129, 2281
- Bate et al. (2003) Bate M. R., Bonnell I. A., Bromm V., 2003, MNRAS, 339, 577
- Beerer et al. (2010) Beerer I. M., Koenig X. P., Hora J. L., Gutermuth R. A., Bontemps S., Megeath S. T., Schneider e. a., 2010, ApJ, 720, 679
- Bonnell & Bate (2005) Bonnell I. A., Bate M. R., 2005, MNRAS, 362, 915
- Bonnell & Bate (2006) Bonnell I. A., Bate M. R., 2006, MNRAS, 370, 488
- Bonnell et al. (2001) Bonnell I. A., Bate M. R., Clarke C. J., Pringle J. E., 2001, MNRAS, 323, 785
- Bonnell et al. (2004) Bonnell I. A., Vine S. G., Bate M. R., 2004, MNRAS, 349, 735
- Bontemps et al. (2010) Bontemps S., Motte F., Csengeri T., Schneider N., 2010, AA, 524, A18
- Chabrier (2003) Chabrier G., 2003, PASP, 115, 763
- Chandler et al. (1993) Chandler C. J., Gear W. K., Chini R., 1993, MNRAS, 260, 337
- Cruz-González et al. (2007) Cruz-González I., Salas L., Hiriart D., 2007, RMXAA, 43, 337
- Csengeri et al. (2011) Csengeri T., Bontemps S., Schneider N., Motte F., Dib S., 2011, AA, 527, A135
- Cyganowski et al. (2003) Cyganowski C. J., Reid M. J., Fish V. L., Ho P. T. P., 2003, ApJ, 596, 344
- Davies et al. (2006) Davies M. B., Bate M. R., Bonnell I. A., Bailey V. C., Tout C. A., 2006, MNRAS, 370, 2038
- Davis et al. (2007) Davis C. J., Kumar M. S. N., Sandell G., Froebrich D., Smith M. D., Currie M. J., 2007, MNRAS, 374, 29
- Evans et al. (2009) Evans II N. J., Dunham M. M., Jørgensen J. K., Enoch M. L., Merín B., van Dishoeck E. F., Alcalá J. M., Myers P. C., Stapelfeldt K. R., Huard T. L., coauthors ., 2009, ApJS, 181, 321
- Flaherty et al. (2007) Flaherty K. M., Pipher J. L., Megeath S. T., Winston E. M., Gutermuth R. A., Muzerolle J., Allen L. E., Fazio G. G., 2007, ApJ, 663, 1069
- Garden et al. (1991) Garden R. P., Hayashi M., Hasegawa T., Gatley I., Kaifu N., 1991, ApJ, 374, 540
- Getman et al. (2005) Getman K. V., Feigelson E. D., Grosso N., McCaughrean M. J., Micela G., Broos P., Garmire G., Townsley L., 2005, ApJS, 160, 353
- Getman et al. (2005) Getman K. V., Flaccomio E., Broos P. S., Grosso N., Tsujimoto M., Townsley L., Garmire G. P., Kastner J., Li J., Harnden 2005, ApJS, 160, 319
- Gómez et al. (2008) Gómez L., Rodríguez L. F., Loinard L., Lizano S., Allen C., Poveda A., Menten K. M., 2008, ApJ, 685, 333
- Grosso et al. (2005) Grosso N., Feigelson E. D., Getman K. V., Townsley L., Broos P., Flaccomio E., McCaughrean M. J., Micela G., Sciortino S., Bally J., Smith N., Muench A. A., Garmire G. P., Palla F., 2005, ApJS, 160, 530
- Harvey et al. (1977) Harvey P. M., Campbell M. F., Hoffmann W. F., 1977, ApJ, 211, 786
- Harvey et al. (2006) Harvey P. M., Chapman N., Lai S.-P., Evans II N. J., Allen L. E., Jørgensen J. K. e. a., 2006, ApJ, 644, 307
- Hennemann et al. (2012) Hennemann M., Motte F., Schneider N., Didelon P., Hill T., Arzoumanian D., Bontemps S., Csengeri T., André P., Konyves V. e. a., 2012, AA, 543, L3
- Hillenbrand & Hartmann (1998) Hillenbrand L. A., Hartmann L. W., 1998, ApJ, 492, 540
- Jørgensen et al. (2006) Jørgensen J. K., Harvey P. M., Evans II N. J., Huard T. L., Allen L. E. e. a., 2006, ApJ, 645, 1246
- Kumar et al. (2007) Kumar M. S. N., Davis C. J., Grave J. M. C., Ferreira B., Froebrich D., 2007, MNRAS, 374, 54
- Kurosawa et al. (2004) Kurosawa R., Harries T. J., Bate M. R., Symington N. H., 2004, MNRAS, 351, 1134
- Lada & Lada (2003) Lada C. J., Lada E. A., 2003, ARAA, 41, 57
- Lada et al. (2000) Lada C. J., Muench A. A., Haisch Jr. K. E., Lada E. A., Alves J. F., Tollestrup E. V., Willner S. P., 2000, AJ, 120, 3162
- Lawrence et al. (2007) Lawrence A., Warren S. J., Almaini O., Edge A. C., Hambly N. C., Jameson R. F., Lucas P., Casali M., Adamson A. e. a., 2007, MNRAS, 379, 1599
- Matthews et al. (2009) Matthews B. C., McPhee C. A., Fissel L. M., Curran R. L., 2009, ApJS, 182, 143
- Meyer et al. (1997) Meyer M. R., Calvet N., Hillenbrand L. A., 1997, AJ, 114, 288
- Mucciarelli et al. (2011) Mucciarelli P., Preibisch T., Zinnecker H., 2011, AA, 533, A121
- Panagia (1973) Panagia N., 1973, AJ, 78, 929
- Preibisch & Feigelson (2005) Preibisch T., Feigelson E. D., 2005, ApJS, 160, 390
- Prisinzano et al. (2008) Prisinzano L., Micela G., Flaccomio E., Stauffer J. R., Megeath T., Rebull L., Robberto M., Smith K., Feigelson E. D., Grosso N., Wolk S., 2008, ApJ, 677, 401
- Ptak & Griffiths (2003) Ptak A., Griffiths R., 2003, in Payne H. E., Jedrzejewski R. I., Hook R. N., eds, Astronomical Data Analysis Software and Systems XII Vol. 295 of Astronomical Society of the Pacific Conference Series, XAssist: A System for the Automation of X-ray Astrophysics Analysis. p. 465
- Rieke & Lebofsky (1985) Rieke G. H., Lebofsky M. J., 1985, ApJ, 288, 618
- Rivilla et al. (2013) Rivilla V. M., Martín-Pintado J., Jiménez-Serra I., Rodríguez-Franco A., 2013, AA, 554, A48
- Robitaille et al. (2006) Robitaille T. P., Whitney B. A., Indebetouw R., Wood K., Denzmore P., 2006, ApJS, 167, 256
- Rygl et al. (2012) Rygl K. L. J., Brunthaler A., Sanna A., Menten K. M., Reid M. J., van Langevelde H. J., Honma M., Torstensson K. J. E., Fujisawa K., 2012, AA, 539, A79
- Ryter (1996) Ryter C. E., 1996, ApSS, 236, 285
- Saito et al. (2007) Saito H., Saito M., Sunada K., Yonekura Y., 2007, ApJ, 659, 459
- Schneider et al. (2006) Schneider N., Bontemps S., Simon R., Jakob H., Motte F., Miller M., Kramer C., Stutzki J., 2006, AA, 458, 855
- Schneider et al. (2010) Schneider N., Csengeri T., Bontemps S., Motte F., Simon R., Hennebelle P., Federrath C., Klessen R., 2010, AA, 520, A49
- Siess et al. (2000) Siess L., Dufour E., Forestini M., 2000, AA, 358, 593
- Smith et al. (2006) Smith H. A., Hora J. L., Marengo M., Pipher J. L., 2006, ApJ, 645, 1264
- Smith et al. (2009) Smith R. J., Longmore S., Bonnell I., 2009, MNRAS, 400, 1775
- Teixeira et al. (2006) Teixeira P. S., Lada C. J., Young E. T., Marengo M., Muench A., Muzerolle J., Siegler N., Rieke G., Hartmann L., Megeath S. T., Fazio G., 2006, ApJL, 636, L45
- Townsley et al. (2011) Townsley L. K., Broos P. S., Chu Y.-H., Gagné M., Garmire G. P., Gruendl R. A., Hamaguchi K., Mac Low M.-M., Montmerle T., Nazé Y., Oey M. S., Park S., Petre R., Pittard J. M., 2011, ApJS, 194, 15
- Ukidss (2012) Ukidss C., 2012, VizieR Online Data Catalog, 2316, 0
- van Altena et al. (1988) van Altena W. F., Lee J. T., Lee J.-F., Lu P. K., Upgren A. R., 1988, AJ, 95, 1744
- Vuong et al. (2003) Vuong M. H., Montmerle T., Grosso N., Feigelson E. D., Verstraete L., Ozawa H., 2003, AA, 408, 581
- Whitney et al. (2003) Whitney B. A., Wood K., Bjorkman J. E., Cohen M., 2003, ApJ, 598, 1079
- Wilking & Lada (1983) Wilking B. A., Lada C. J., 1983, ApJ, 274, 698
- Williams et al. (2000) Williams J. P., Blitz L., McKee C. F., 2000, Protostars and Planets IV, p. 97
- Ybarra et al. (2013) Ybarra J. E., Lada E. A., Román-Zúñiga C. G., Balog Z., Wang J., Feigelson E. D., 2013, ApJ, 769, 140
- Zapata et al. (2011) Zapata L. A., Schmid-Burgk J., Menten K. M., 2011, AA, 529, A24
- Zapata et al. (2013) Zapata L. A., Schmid-Burgk J., Pérez-Goytia N., Ho P. T. P., Rodríguez L. F., Loinard L., Cruz-González I., 2013, ApJL, 765, L29
- Zinnecker & Yorke (2007) Zinnecker H., Yorke H. W., 2007, ARAA, 45, 481