Study of top quark pair production near threshold at the ILC
Tomohiro Horiguchi(a), Akimasa Ishikawa(a), Taikan Suehara(a),
Keisuke Fujii(b), Yukinari Sumino(a), Yuichiro Kiyo(c),
and Hitoshi Yamamoto(a)
Abstract
We report on a study of top pair production at the International Linear Collider (ILC) around center of mass energy (ECM) = 350 GeV using an ILD detector simulator based on the Detailed Baseline Design (DBD) configuration. Here we will report on a result of 6-Jet final state, . A result for the 4-Jet final state, , which has almost the same statics as that of the 6-Jet final state will be included in the future. For an energy scan of 11 center of mass energy points (340 - 350GeV) and two beam polarization combinations (P() = (0.3, 0.8)) with 10 fb-1 each, the statistical errors on the top quark Yukawa coupling, its mass and width are estimated. The results are = 4.2%, = 16 MeV in potential subtracted scheme (PS), and = 21 MeV.
1 Introduction
The top quark is the heaviest particle in the Standard Model (SM). Since the top quark mass measured at hadron colliders, GeV[1], is close to the electroweak scale, GeV, top quark may play an important role in the electroweak symmetry breaking. However, top quark mass measured at the hadron colliders is a Monte Carlo parameter, which is very hard to translate into masses defined in other schemes used for theoretical calculation, such as the scheme[2]. With recent measurements of the Higgs boson mass at the LHC and the top quark mass, GeV[3], derived from the top pair production cross section, the vacuum stability can be discussed in the Standard Model. Although the uncertainties are still large, the measurements suggest that the vacuum of our universe might be meta-stable[4]. To draw a definite conclusion, a precise measurement of the top quark mass in a theoretically calculable scheme is essential.
Since the top quark decays very quickly due to its heaviness, the width of the top quark is sizable, about 1.4 GeV, which is predicted in the next-to-next-to-leading order (NNLO) calculation in the SM. The top quark width is an important probe for anomalous couplings and exotic decays. Since the experimental resolution for the top quark mass at the hadron colliders is much worse than the top quark width, its direct measurement is impossible. The D0 Collaboration indirectly measured the top quark width from the t-channel single top production cross section and the branching fraction of the top decaying into a bottom quark and a boson[5]. The result, GeV, is consistent with the SM prediction though the error is still large to discuss exotic contributions.
The top quark Yukawa coupling () is a fundamental parameter in the SM, and also important for physics beyond the SM (BSM), since the top quark Yukawa coupling enters renormalization group equations for many BSM parameters. Recent measurements of Higgs boson production in gluon-gluon fusion at the LHC give an indirect constraint on the top quark Yukawa coupling. In the future, a measurement of Higgs production off top or anti-top quarks, , at the LHC will directly constrain the top quark Yukawa coupling but its precise determination is difficult due to reconstruction under large QCD background and large theoretical uncertainty.
The ILC is an ideal place to measure top quark properties due to the following reasons. Firstly, since it only involves interaction of elementary particles (electrons and positrons), the center of mass energy (ECM) is tunable and its spread is reasonably small[6]. Secondly, the detector exploits state-of-the-art technology, allowing high precision measurements in triggerless operation with no inefficiency in data acquisition thanks to low beam-beam backgrounds. Lastly, uncertainties in theoretical calculations are much lower than at the hadron colliders. Thus one can perform a precision top pair threshold scan at ECM around 350 GeV and extract the top quark mass and width in a theoretical clean manner. The top quark Yukawa coupling can also be derived from precise measurements of the cross sections since it is enhanced by Higgs exchange diagrams (Fig.1), which is proportional to .
The measurement accuracies of top quark mass, width, and yukawa coupling have been studied by the previous work[7][8] and at the CLIC[9]. We report the latest result at the ILC.
This paper is organized as follows. In Section 2, the framework used for the analysis is described. Section 3 explains our event reconstruction and selection designed to suppress backgrounds. Section 4 is devoted to the extractions of the top quark Yukawa coupling, its mass and width with estimations of the statistical errors on these parameters. Finally, in Section 5, we summarize the results.

2 Analysis Framework
2.1 Signal and Backgrounds
Since a top quark decays into a bottom quark and a boson, the decay channels are categorized by the decay of
the two bosons. If the final states of the two s are 4 quarks, 2 quarks + 1 lepton + 1 neutrino,
or 2 leptons + 2 neutrinos, the channels are hereafter called 6-Jet, 4-Jet and 2-Jet, respectively.
In this paper, a 6-Jet analysis will be reported and the other top pair channels are treated as backgrounds.
Processes with high jet multiplicity and a comparable cross section to that of the top pair production
such as , , and () are considered as backgrounds.
Other backgrounds with 6-Jet final states such as , , and will be added in the future.
2.2 Polarization and Integrated luminosity
The running scenario around the ILC ECM = 350 GeV, an operation as the top factory, has not been decided yet. Here we assume the following settings. The data will be acquired using two polarization configurations
P(, ) = (+30%, -80%)
P(, ) = (-30%, +80%)
so that we can also separate top couplings to photon and boson. Throughout this paper, the former (latter) polarization configuration is denoted as “Left” (“Right”). The top threshold scan is performed at 11 energy points, every 1 GeV from 340GeV to 350GeV for both polarization combinations with an integrated luminosity of 10 fb-1 each, which amount to 220 fb-1 in total.
2.3 Event Generators
To estimate the signal efficiencies and background yields, event samples at around ECM = 350 GeV were generated by Monte-Carlo event generators. For signal top pairs, Physsim[10] was used as an event generator, while for backgrounds, Whizard[11] was utilized. Both of them are of Leading Order (LO). The top quark pole mass was set at 174 GeV/c2. Physsim is based on full helicity amplitudes including QCD enhancement near the top pair threshold, calculated using HELAS[12], which properly takes into account the angular correlations of the decay products. Parton-showering and fragmentation of colored quarks and gluons are done by PYTHIA[13] with parameter tuned by the OPAL collaboration. The beam parameters, which include initial state radiation, beamstrahlung, and beam energy spread, are common for both generators, as specified by a so called Lumi-linker file[14].
2.4 Detector Simulation
The ILD detector has a tracker system and a finely segmented calorimeter system to realize the particle flow algorithm (PFA) [15]. In addition, a solenoid magnet which provides 3.5 T magnetic field, a muon tracker combined with iron yoke magnetic flux return, and luminosity and beam monitors are equipped.
The tracker consists of three doublet layers of silicon pixel detector (VTX), a silicon strip tracker system, and a time projection chamber (TPC). The inner-most layer of the VTX is placed at 1.6 cm from the interaction point in radial direction to achieve the impact parameter resolution of 5 15/p sin, which is necessary for excellent flavor tagging of heavy quarks, such as bottom and charm quarks. The silicon strip tracker system consists of the silicon inner tracker (SIT), the silicon external tracker (SET), and the endcap tracking detector (ETD). The SIT is located in between the VTX and the TPC at barrel region. The SET and the ETD envelop the TPC at barrel and endcap regions, respectively. The role of silicon strip tracker system is to improve the momentum resolution and to extrapolate charged tracks from the TPC to the VTX or to the calorimeter system. The TPC is a gaseous cylindrical chamber with inner and outer radii of 329 mm and 1808 mm and half-length of 2350 mm in direction. The spacial resolution of TPC in the r- direction is better than 100m and two-track separability is about 2 mm. The momentum resolution using only TPC is GeV-1, and this can be improved to (1/p) 2 10-5 GeV-1 with a full tracking system.
The calorimeter system comprises an electromagnetic calorimeter (ECAL), which measures energy of photons and identifies electrons, and a hadronic calorimeter (HCAL), which measures energy of neutral hadrons. Both the ECAL and HCAL are finely segmented sampling calorimeters to detect showers from individual particles in order to give the excellent performance with the PFA. The absorber and active material for the ECAL and HCAL are tungsten and silicon pixel sensors, iron and tile scintillators with MPPCs, respectively.
3 Event Reconstruction and Selection
3.1 Event Reconstruction
After the detector simulation, PFOs (Particle Flow Objects) were clustered to jets using Durham algorithm. In the Durham algorithm, each PFO is regarded as a jet on its own to begin with, a jet pair and gets combined if the pair has the lowest value which is defined as
where is the angle between the momentum vectors of the two particles. In this analysis, PFOs were forced to cluster into 6 jets. Among the 6 jets, two most like jets were identified using the LCFIPlus flavor tagging algorithm, using vertex and mass information. The two s were reconstructed from the remaining 4 jets. The two top quarks were then reconstructed by pairing like jets with candidates. Since there were multiple possible ways to combine the jets, we defined a quantity called as
and chose the jet combination which minimized the value. Here () is the invariant mass from 2(3) jets. For the two jets used for m2j, we do not use like jets. and are the top mass (174 GeV) and the mass (80.0 GeV) defined in the generators, and are mass resolutions for the top quark and the boson.
3.2 Event Selection
After the event reconstruction, backgrounds from 4-Jet and 2-Jet, , , and events were suppressed by various selection cuts to maximize the significance. Since the signal and background cross sections are different for “Left” and “Right” polarizations, we adopted different selection cuts for them.
The background can be suppressed by requiring two like jets, because boson decay to a bottom quark is CKM suppressed while the branching fraction for top quark decay to a bottom quark and a boson is more than 99%. After requiring two like jets, we applied cuts on thrust and visible energy. Isolated leptons were then looked for by using energy flow in a cone around a lepton candidate track. When the energy flow in this cone was lower than 5 GeV, we regarded this track as an isolated lepton. When some isolated lepton candidate was found, the event was discarded. The remaining events were subject to further cuts on the Durham value (), missing transverse momentum (), and the number of PFOs (nPFOs). The numbers of signal and background events after each selection cut for the “Left” and “Right” polarizations are summarized in Table 2 and Table 2. Notice that we generated the signal events for each energy point to estimate signal efficiency, while the background events were generated only at ECM = 350 GeV. The background at other energy points were estimated by scaling the cross section to save CPU time. Fig 2 shows the obtained cross section and signal efficiency at each energy point.


| ECM= 350(GeV) on “Left” | 6-Jet | 4-Jet | 2-Jet | ||||
|---|---|---|---|---|---|---|---|
| Generated | 3288 | 3167 | 763 | 65328 | 6008 | 1389 | 11.6 |
| btag1 >0.1, btag2 >0.1 | 3136 | 3004 | 725 | 7567 | 2832 | 982 | 23.2 |
| thrust <0.84 | 3090 | 2882 | 645 | 867 | 917 | 815 | 32.2 |
| Visible Energy >310(GeV) | 3063 | 1194 | 37 | 434 | 573 | 577 | 39.9 |
| nlep = 0 | 3021 | 399 | 3 | 429 | 571 | 571 | 42.8 |
| >0.0012 , >0.0007 | 2956 | 331 | 2 | 174 | 176 | 193 | 47.8 |
| p >38(GeV) | 2942 | 160 | 0 | 173 | 175 | 192 | 48.7 |
| nPFOs = 95 | 2917 | 137 | 0 | 115 | 143 | 170 | 49.4 |
| ECM= 350(GeV) on “Right” | 6-Jet | 4-Jet | 2-Jet | ||||
|---|---|---|---|---|---|---|---|
| Generated | 1572 | 1515 | 365 | 4326 | 2773 | 937 | 14.7 |
| btag1 >0.065 , btag2 >0.065 | 1546 | 1483 | 355 | 1181 | 1591 | 720 | 18.7 |
| thrust <0.84 | 1522 | 1425 | 318 | 141 | 424 | 594 | 22.9 |
| Visible Energy >305(GeV) | 1514 | 687 | 24 | 73 | 267 | 438 | 27.6 |
| nlep = 0 | 1495 | 224 | 2 | 72 | 265 | 431 | 29.9 |
| >0.0014 , >0.0006 | 1472 | 189 | 1 | 30 | 89 | 161 | 33.4 |
| p >38(GeV) | 1465 | 89 | 0 | 30 | 88 | 160 | 34.2 |
| nPFOs = 95 | 1453 | 74 | 0 | 18 | 66 | 140 | 34.7 |
4 Estimation of statistical errors on the top quark Yukawa coupling, its mass and width
4.1 Top quark Yukawa Coupling
Since the enhancement of the top quark pair production cross section due to Higgs exchange diagram is energy-independent, approximately 9%, in the threshold region, we can combine the numbers of signal and background events at all the 11 energy points (340 GeV 350 GeV) to estimate statistical error on the top quark Yukawa coupling. The cross section can be expressed by amplitudes with and without higgs exchange as follows.
Since the exchanged Higgs boson couples to the top quark twice, the leading correction term due to Higgs exchange is proportional to , which corresponds to approximately a 9% enhancement. The term is small enough to ignore. The sensitivities to the top quark Yukawa coupling were estimated using the following formula.
The expected statistical errors on top quark Yukawa coupling are 5.0% and 7.1% for the “Left” and “Right” polarization combinations, respectively, and 4.2% when combined (Table 3).
| “Left” | “Right” | Combined | |
|---|---|---|---|
| cross section | 0.84 % | 1.2 % | |
| top quark Yukawa coupling | 5.0 % | 7.1 % | 4.2 % |
4.2 Top mass and width
The top mass and width can be determined with unprecedented sensitivity by performing threshold scan at the ILC. We fit the two parameters simultaneously using the cross section values measured at the 11 energy points in the threshold region of 340 to 350 GeV.
4.2.1 Mass scheme and assumptions
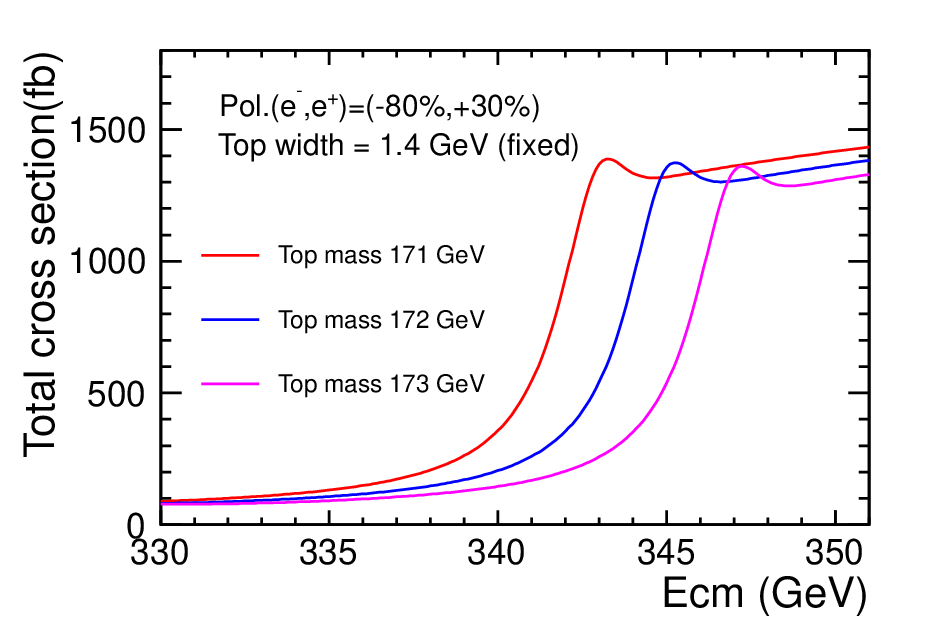
The mass is the most suitable mass scheme in most of the top physics. In this study, we adopt the Potential Subtracted mass (PS mass)[18], which is considered to have the least correlation to the strong coupling constant () in extracting the top mass, and then convert the PS mass to the mass. We perform a fit to the cross section as a function of ECM floating the PS mass and the top width. Here we fix to 0.12, expecting that it will be determined with much higher precision by the time the ILC starts. The top cross sections were calculated at NNLO in QCD. Figure 4 shows the calculated cross sections for various top masses and widths. The assumed integrated luminosity is the same as in the study of the top quark Yukawa coupling. In extracting the mass and the width, we have to consider initial state radiation (ISR), beamstrahlung, and beam energy spread, which significantly affect the cross section curve. Figure 4 shows the luminosity spectrum of the ILC at ECM = 350 GeV. We use this spectrum for all the beam energies with energy scaling. Since the theoretical calculation has been done assuming monochromatic energies, we convolute the theoretical cross section with the beam spectrum as in the following equation.
where (where is the collision energy which is affected by beam effects and is the nominal center of mass energy) is the NNLO total cross section before convolution, is the normalized luminosity spectrum, and is the NNLO total cross section after convolution. The theoretical cross sections to be convoluted have been calculated at every 100 MeV from ECM of 330 to 351 GeV.


4.2.2 Fitting and Result
Using the convoluted NNLO cross sections we estimate statistical errors on the top mass and width
with threshold scan at the ILC. Since the detector simulation studies have been done with the leading-order (LO)
calculation, we assume that the signal selection efficiency and remaining background at NNLO are the same as in
the LO analysis. The selection efficiency and background in the LO analysis are shown in
Fig. 2, Table 2, and Table 2. The obtained number of signal events
which is scaled to the NNLO signal cross section and the number of background events after selection
at each center-of-mass energy was randomized by Poisson distribution (toy-MC) and fitted to templates
with two free parameters, namely the of top mass and its width. We produced the template samples of
GeV (at every 5 MeV in GeV and every 10 MeV in other region)
and GeV at every 10 MeV, resulting in over 24,000 templates. Linear interpolation was used
for parameters between templates. Minuit2Minimizer[19] in ROOT was used for the minimization.
10,000 toy-MC experiments have been performed. Table 4 shows the obtained mass and width errors and
Figure 5 shows the correlation of the two parameters as well as convoluted cross sections
with measurement errors at several parameter values. We obtained 16 MeV statistical error for the top quark mass
in the PS scheme and 21 MeV for the top width with the “Left” and “Right” results combined.
| PS Mass (GeV) | Width (GeV) | |
|---|---|---|
| “Left” (110 fb-1) | 172.000 0.020 | 1.399 0.026 |
| “Right” (110 fb-1) | 172.000 0.028 | 1.398 0.038 |
| “Left” + “Right” (220 fb-1) | 172.000 0.016 | 1.399 0.021 |
The conversion from the PS mass to the mass can be written as
Using of PDG value, we obtain = 163.80 0.016(stat) .


5 Summary
Measuring properties of the top quark is quite important to test the SM and search for physics beyond the SM.
By the threshold scan, the top properties such as its mass, width, and Yukawa coupling, will be able to be measured
accurately at the ILC.
We have estimated the statistical errors on the top mass, width, and Yukawa coupling
using the ILD simulation framework. In our study, 11 energy points (between 340 and 350 GeV) and
two beam polarization combinations (P() = (0.3, 0.8)) with 10 fb-1 each, 220 fb-1
in total, are used for the threshold scan. Only 6-Jet final state, ,
was considered as the signal in this study. For the top quark Yukawa coupling, 4.2% statistical error was obtained.
For the top mass and width, NNLO total cross section was used to scale the LO analysis.
We obtained = 16 MeV for the potential subtracted mass and = 21 MeV for the top width.
Our results were compared with the previous study[8] and the study at the CLIC[9]. According to the previous study, the prediction of determination of the top quark mass, with an experimental accuracy better than 30 MeV and of width, with an accuracy at the 2% level, is quit robust. Therefore = 14 MeV and = 18 MeV which were obtained when our results were scaled from 220 to 300 fb-1 were consistent. Since the study at the CLIC, which used the luminosity spectrum of the ILC and CLIC_ILC detector, estimated = 27 MeV, = 24 MeV which was our result scaled from 220 to 100 fb-1 was also consistent.
We plan to add 4-Jet final states, which has similar branching ratio to 6-Jet, to improve the sensitivities. Since sensitivities can be improved by optimizing the strategy of the threshold scan, we also plan to study several running scenarios.
Acknowledgments
The authors would like to thank all the members of the ILC physics subgroup [20] for useful discussions on this work and those of the ILD software and optimization group, who maintain the software and Monte Carlo samples used in this work. This work is supported in part by the Creative Scientific Research Grant No. 18GS0202 of the Japan Society for Promotions of Science (JSPS), the JSPS Grant-in-Aid for Science Research No. 22244031, and the JSPS Specially Promoted Research No. 23000002.
References
- [1]
Particle Data Group 2013
http://pdg.lbl.gov/2013/tables/rpp2013-sum-quarks.pdf - [2] Y. Kiyo, Y. Sumino Phys. Rev. D67 (2003) 071501
- [3] D0 Collaboration Phys. Lett. B703 (2011) 422-427
- [4] Giuseppe Degrassi, Stefano Di Vita JHEP 1208, 098 (2012)
- [5] D0 Collaboration Phys. Rev. D85 (2012) 091104
- [6] The International Linear Collider Technical Design Report - Volume 3.II: Accelerator Baseline Design arXiv:1306.6328
- [7] K. Fujii, T. Matsui and Y. Sumino, “Physics at t anti-t threshold in e+ e- collisions,” Phys. Rev. D 50, 4341 (1994).
- [8] M. Martinez and R. Miquel, Eur. Phys. J. C 27, 49 (2003) [hep-ph/0207315].
- [9] K. Seidel, F. Simon, M. Tesar and S. Poss, “Top quark mass measurements at and above threshold at CLIC,” Eur. Phys. J. C 73, 2530 (2013) [arXiv:1303.3758 [hep-ex]].
- [10] http://acfahep.kek.jp/subg/sim/softs.html
- [11] W. Kilian, T. Ohl and J. Reuter, “WHIZARD: Simulating Multi-Particle Processes at LHC and ILC,” arXiv:0708.4233.
- [12] H. Murayama, I. Watanabe, K. Hagiwara, KEK-91-11, (1992) 184.
- [13] T. Sjostrand, L. Lonnblad, S. Mrenna and P. Z. Skands, “Pythia 6.3 physics and manual,” hep-ph/0308153. CITATION = HEP-PH/0308153;
- [14] https://confluence.slac.stanford.edu/display/ilc/Standard+Model+Data+Samples
- [15] T. Behnke, J. E. Brau, P. N. Burrows, J. Fuster, M. Peskin, M. Stanitzki, Y. Sugimoto and S. Yamada et al., arXiv:1306.6329 [physics.ins-det].
- [16] P. Mora de Freitas and H. Videau, LC-TOOL-2003-010, Prepared for LCWS 2002,. Jeju Island, Korea, 26-30 Aug 2002.
- [17] M. A. Thomson, “Particle flow calorimetry at the ILC,” AIP Conf. Proc. 896, 215 (2007).
- [18] M. Beneke Phys. Lett. B434 (1998) 115-125
- [19] http://root.cern.ch/root/html/ROOT__Minuit2__Minuit2Minimizer.html
- [20] http://www-jlc.kek.jp/subg/physics/ilcphys/.