The resolved structure of the extragalactic supernova remnant SNR 4449-1
Abstract
We present very long baseline interferometry (VLBI) observations of the milliarcsecond-scale radio structure of the supernova remnant SNR 44491 in the galaxy NGC 4449. This young and superluminous remnant was observed at 1.6 GHz ( cm) with the European VLBI Network. The observations confirm earlier identifications of this object with a supernova remnant (SNR) while revealing a somewhat different morphology compared with the structure reported by Bietenholz et al. from VLBI observations at 1.4 GHz. This difference is discussed here in the context of structural sensitivity of both observations. The 1.6 GHz image yields accurate estimates of the size (0.0422 arcsec 0.0285 arcsec and 0.8 0.5 pc) and age (55 yr) of SNR 44491. With a total flux of 6.1 0.6 mJy measured in the VLBI image, the historical lightcurve of the source can be well represented by a power-law decay with a power index of 1.19 0.07. The SNR exhibits a decline rate of the radio emission of 2.2 0.1 yr-1 and a radio luminosity of 1.74 1035 erg s-1.
Keywords:
Stars: supernovae: individual: SNR 4449-1 – ISM: supernova remnants – Radio continuum: general.1 Introduction
The young and ultraluminous supernova remnant SNR 44491 was discovered in the late 1970s (radio, Seaquist & Bignell 1978; optical, Balick & Heckman 1978) in the star-forming galaxy NGC 4449. NGC 4449 is a barred Magellanic-type irregular galaxy hosting a number of areas of extensive star formation (Reines et al. 2008). The galaxy is located at an estimated distance of 3.82 0.27 Mpc (Annibali et al. 2008).
The SNR 44491 was identified as a young and very luminous oxygen-rich supernova remnant (SNR) embedded in an HII region (Blair & Fesen 1998), based on observations in several different wavebands. It was first discovered as a bright, unresolved non-thermal radio source (10 mJy at 2.7 GHz; Seaquist & Bignell 1978) located approximately 1arcmin north of the nucleus of NGC 4449. A steep spectral index 11 1 The spectral index is defined here from , where S is the flux density at frequency (Seaquist & Bignell 1978) in the radio band and observations of both broad and narrow lines in the optical spectrum (Balick & Heckman 1978) indicated that the source was a SNR.
SNR 44491 is one of the few known intermediate-age SNRs, with an age between that of Cas A (330 yrs; Thorstensen et al. 2001) and those of the oldest known extragalactic radio supernovae (SNe), like SN 1923A in M83 (83 yrs; Eck et al. 1998) and SN 1957D, also in M83 (49 yrs; Pennington & Dufour 1983). The SNR in NGC 4449 is also notable as the most luminous and most distant member of the class of oxygen-rich SNRs (Blair et al. 1983). The nature of such a bright luminosity was long suspected to be due to interaction with a surrounding HII region, but Hubble Space Telescope (HST) observations (Milisavljevic & Fesen 2008) suggested that the remnant is instead interacting with a very dense circumstellar material (CSM) from the SNR’s progenitor star of mass 20 M. The remnant possesses the characteristics of typical SNe of massive stars, since it lies inside a rich cluster of high-mass stars surrounded by a presumably SN- and wind-blown interstellar medium bubble, it is interacting with the dense CSM and it exhibits the chemical properties of an hydrogen-poor envelope progenitor (Milisavljevic & Fesen 2008).
While SNR 44491 is currently quite luminous, the significant decline in the remnant’s X-ray and radio flux over the last three decades implies that it was even brighter in the past. Lacey et al. (2007) combined newer Very Large Array (VLA) observations of NGC 4449 with archive VLA and Westerbork Synthesis Radio Telescope observations to present the lightcurve of the SNR at 6 and 20 cm from 1973 to 2002. The radio flux of SNR 44491 measured at 4.9 GHz has undergone a signficant decline over the last three decades, dropping from 13 to 4 mJy between 1973 and 2002 (Lacey et al. 2007).
SNR 44491 was identified with an ultraluminous X-ray source (ULX), NGC 4449-X4, based on ROSAT High Resolution Imager (HRI) observations (e.g., Liu & Bregman 2005; Sánchez-Sutil et al. 2006). Application of an absorbed, non-equilibrium ionization model (e.g., Yokogawa et al. 2002) to NGC 4449-X4 yielded an X-ray temperature K in the 0.3–8.0 keV band, a column density of = 1.26 1021 cm-2 and an absorption-corrected luminosity erg s-1 (Summers et al. 2003). The X-ray temperature measurement was used to estimate an age of 270 yrs and an ambient medium density of 120–200 cm-3 for this SNR (Summers et al. 2003).
Very long baseline interferometry (VLBI) observations made in 1980 and 1981 with the EVN22 2 The European VLBI Network, www.evlbi.org yielded an upper limit of 0.07 arcsec (1.3 pc at 3.82 Mpc) for the angular diameter of SNR 44491 (de Bruyn 1983). This upper limit was obtained from interferometric visibilities, while the data were insufficient for obtaining an image. Optical observations with the HST in 1996 and 2005 yielded somewhat smaller upper limits of 0.028 arcsec (0.5 pc; Blair & Fesen 1998) and 0.037 arcsec (0.69 pc; Milisavljevic & Fesen 2008), respectively. The expansion velocity of 6000 km s-1 obtained from the [OIII] optical emission line (Blair & Fesen 1998) provided an estimated age of the remnant of 50 yr (Milisavljevic & Fesen 2008). Recently, Bietenholz et al. (2010) reported the first resolved radio image of the remnant, obtained with VLBI and showing two parallel ridge-like structures with an angular extent of 65 mas 40 mas. Using a slightly larger velocity expansion of 6500 km s-1, they obtained an age estimate of 70 yrs for the SNR.
We have made a VLBI observation of SNR 44491 using the EVN at 1.6 GHz ( cm), as part of a larger study of milliarsecond-scale structure of radio counterparts of ULXs (Mezcua & Lobanov 2011; Mezcua et al. 2013a) identified from a cross-correlation of positions of ULX objects with the FIRST33 3 Faint Images of the Radio Sky at Twenty-cm catalogue (Sánchez-Sutil et al. 2006). General results of this study will be described in a forthcoming paper, and here we focus on discussing the properties of milliarcsecond-scale emission in SNR 44491.
In Section 2, we describe the EVN observations and data reduction. The resulting image of the millarcsecond-scale structure of radio emission from SNR 44491 is presented in Section 3. A discussion given in Section 4 brings these results in the context of long-term evolution of the SNR. We adopt a distance to the SNR of 3.82 Mpc (Annibali et al. 2008), which corresponds to a linear scale of 18.4 pc arcsec-1.
2 Observations and data reduction
SNR 44491 in NGC4̇449 was observed during a 12 h observing run, during which two other ULXs were also observed, on 2009 June 1 using the EVN at 1.6 GHz (wavelength of 18 cm). Nine EVN antennas participated in the observations, and their basic technical parameters are listed in Table 1.
The observations were made in the phase-referencing mode, with the compact radio source J1221+4411, located 1∘ away from the target, used as a phase calibrator. Observing scans on J1221+4411 and SNR 4449–1 were interleaved, with a calibrator–target cycle time of 8 min (2 min on the phase calibrator and 6 min on the source). This resulted in a total integration time of 2 h spent on SNR 4449–1. A bright and relatively compact radio source, 4C +39.25, was observed as a fringe finder and bandpass calibrator.
The data were recorded in dual-circular polarization, at a rate of 1024 megabit per second (Mbps), resulting in a total bandwidth of 256 MHz (comprising eight intermediate frequency bands, each covering a 16 MHz band split into 32 spectral channels). After the observations, the data were correlated at the EVN Correlator Facility at JIVE44 4 Joint Institute for VLBI in Europe, Dwingeloo, the Netherlands. using a correlator averaging time of 2s. This ensured that the target source could be effectively detected within the 3 error box of the VLA FIRST position measurement.
The correlated data were fringe-fitted using the AIPS55 5 Astronomical Image Processing Software of National Radio Astronomy Observatory (NRAO). and phase solutions obtained on the phase-reference calibrator J1221+4411 were applied to the target source. No ionospheric corrections were applied. The target was subsequently imaged using the AIPS task IMAGR. The resulting image is shown in Fig. 1 and discussed below.
| Participating telescopes | |||
| Antenna | SEFD | ||
| (m) | (Jy) | (mJy) | |
| Effelsberg (DE) | 100 | 19 | … |
| Jodrell Bank (UK) | 76 | 44 | 0.24 |
| Medicina (IT) | 32 | 600 | 0.87 |
| Noto (IT) | 32 | 780 | 1.00 |
| Onsala (SE) | 25 | 320 | 0.64 |
| Shanghai (CN) | 25 | 670 | 0.92 |
| Torun (PL) | 32 | 230 | 0.54 |
| Urumqi (CN) | 25 | 270 | 0.58 |
| Westerbork (NL) | 83a | 30 | 0.20 |
Notes. – antenna diameter; SEFD – system equivalent flux density (an integral measure of antenna sensitivity); – rms noise for 1 min integration on the baseline between the given antenna and Effelsberg; a – equivalent antenna diameter for a phased array of 1125 m antennas used for the observations.
3 Results
A phase-referenced image of SNR 4449–1 shown in Fig. 1 is obtained by applying CLEAN deconvolution to the naturally weighted data. The cleaning is done without self-calibration. The resulting restoring beam (CLEAN beam) is 7.9 mas 3.5 mas, oriented at a position angle of 25∘.8. The image has an off-source rms noise of Jy beam-1 and a peak flux density of Jy beam-1, thus corresponding to a detection of signal-to-noise ratio (S/N).
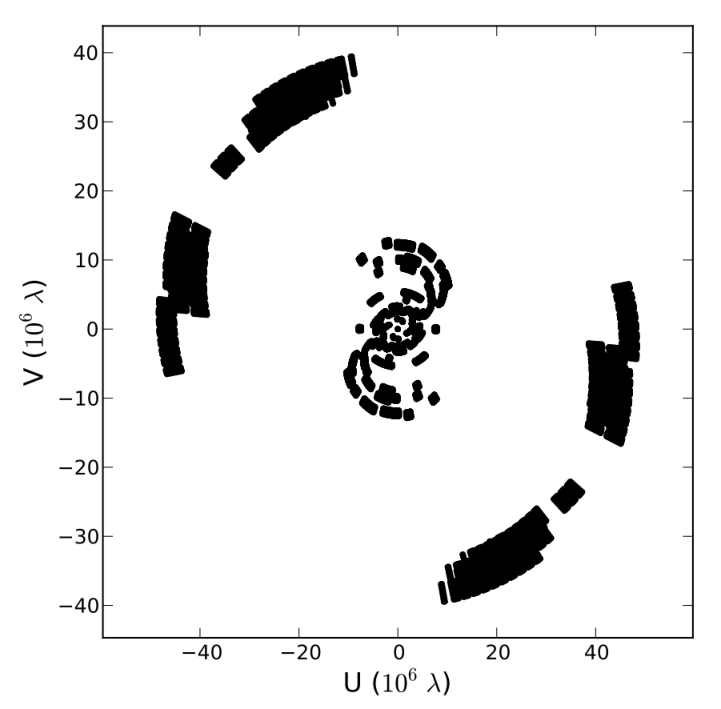
The remnant is clearly resolved into several “spot-like” components, which is likely to reflect the limitations of deconvolution applied to visibility data with an incomplete uv-coverage due to the short integration time on the source (see Fig. 2). This effect may also contribute to the apparent discrepancy between the image in Fig. 1 and the structure observed with the HSA66 6 The High Sensitivity Array, comprised of 10 antennas of Very Long Baseline Array, the Robert C. Byrd Green Bank Telescope, and the Effelsberg 100 m telescope at 1.4 GHz by Bietenholz et al. (2010). The total flux density and the spatial extent of the radio emission are similar in both the 1.4 GHz HSA image and the 1.6 GHz one.
The most likely factor contributing to the morphological discrepancy is the difference of the baseline sensitivity and filling factors of the uv-coverages in the two data sets. The 1.4 GHz HSA data have a better rms noise resulting from a longer integration time and a superior uv-coverage on long baselines. However, the 1.6 GHz EVN observations have better coverage and better sensitivity on baselines shorter than 1000 km, which enhances detection of emission on angular scales of 35 mas. Making a firm conclusion on the structure of this SNR would require obtaining a robust uv-coverage on baselines of km which can be provided by eMERLIN.
Six distinct regions (labelled A through F in Fig. 1) can be identified in the image. The basic properties of components A–F (coordinates, total flux densities, and brightness temperatures) have been obtained from fits by two-dimensional Gaussian components to the image plane. Table 2 lists the parameters obtained. The errors are taken from the covariance matrix of the fits.

The integrated flux density of the components identified varies from 0.269 to 0.648 mJy while the brightness temperature ranges from to K. The whole structure has a total flux of mJy, from which we derive a radio luminosity at 1.6 GHz of erg s-1.
Component F is detected at an S/N, while an even fainter component of 0.150 mJy of integrated flux is also present in the image, to the north-west from component D. These components are likely to be spurious features resulting from a sidelobe or deficiencies of the CLEAN convolution. In order to check the reliability of such components, we investigate variations in the deconvolution and data weighting schemes. We first repeat the data calibration and, in order to improve the image fidelity, split the data without applying any frequency averaging. We then perform CLEAN deconvolution using natural weighting and uniform weighting. The resulting images have off-source rms noises of 37 and Jy beam-1 (see Fig. 3, left and right, respectively), and show a resolved structure formed by several spot-like components similar to those of Fig. 1. Some of the components previously observed are not detected here (e.g., component A seems to have merged with B), while the previous possible spurious detection of component F seems to be still detected at an S/N. Despite the improvement in the image sensitivity, the structure of both images still shows an elliptical shape caused by the spatial frequencies sampled by the interferometer (see a further discussion on the image fidelity in the Appendix).
| Component | RA | Dec. | Integrated flux | |
|---|---|---|---|---|
| (J2000) | (J2000) | (mJy) | (106 K) | |
| A | 12h28m10s.94738 0s.00006 | 44∘06′48′′.5181 0′′.0008 | 0.524 | 3.8 |
| B | 12h28m10s.94691 0s.00006 | 44∘06′48′′.5200 0′′.0008 | 0.423 | 3.1 |
| C | 12h28m10s.94611 0s.00003 | 44∘06′48′′.5223 0′′.0004 | 0.648 | 5.6 |
| D | 12h28m10s.94444 0s.00005 | 44∘06′48′′.5146 0′′.0007 | 0.592 | 3.5 |
| E | 12h28m10s.94481 0s.00003 | 44∘06′48′′.5008 0′′.0005 | 0.424 | 4.5 |
| F | 12h28m10s.94588 0s.00004 | 44∘06′48′′.5423 0′′.0007 | 0.269 | 3.0 |
3.1 Positional centre and size of the remnant
The positional centre and an estimate of the SNR diameter size can be
determined from the resolved structure. The fit of an ellipse to the
structure formed by the peak of the five brightest components A-E (Fig. 4)
yields the best position for the SNR centre at
RA = 12h28m10s.9463 0s.0001, Dec. =
44∘06′48′′.508 0′′.001,
and a SNR size of major axis = 0.0422 arcsec
0.0023 arcsec and minor axis = 0.0285 arcsec
0.0024 arcsec corresponding to 0.8 pc 0.5 pc at the
distance of the galaxy. This estimate is limited by the uncertainty in
the distance to NGC 4449. In order to compare the radio diameter to
the one derived from optical images, we derive a geometrical mean value of
0.0347 arcsec 0.0025 arcsec. This size is
larger than the value of 0.028 arcsec (Blair &
Fesen 1998) and very similar to the 0.037 arcsec (Milisavljevic &
Fesen 2008)
estimated from the HST images, suggesting that the
outer layers of SNR 4449–1 do also emit at optical wavelengths. The SNR
mean diameter of 35 mas is larger than the 30 mas
peak-to-peak separation between the two bright parallel ridges of
emission found by Bietenholz
et al. (2010).
If the component F also belongs to the remnant (as suggested in Bietenholz
et al. 2010), the size of the remnant can be determined from the distance between components A–D and F–E. This yields a size of 32 mas 43 mas, agreeing better with the size obtained by Bietenholz
et al. (2010).
It should be stressed here once more that deviations
from the expected circular or elliptical morphology reported by
Bietenholz
et al. (2010) for SNR 4449–1 are not likely
to result from deconvolution errors or gaps in the uv-coverage. These deviations (and the morphological discrepancy of the HSA and the EVN images of the remnant) most likely result from the
deficiency in the structural sensitivity of both data sets for scales larger than mas. While peculiar non-circular structures have also been observed in other SNRs (e.g., 41.95+575 in M82; McDonald
et al. 2001), the apparent discrepancy of the structural appearance of the SNR in our image and the image of Bietenholz
et al. (2010) calls for further more detailed imaging of this SNR.

4 Discussion
4.1 Light curve
Using archival radio observations of NGC 4449, Lacey et al. (2007) presented the light curves of the SNR at 6 and 20 cm from 1972 to 2002 revealing a remarkable decline in its radio emission. An up-to-date version of the light curves, including the new flux densities from Bietenholz et al. (2010) and this work, is presented in Fig. 5.
Our flux density measurement is in agreement with the radio decline and we use it to estimate the decay rate of the emission from a power-law fit of the form
| (1) |
where is the date of the SN explosion, is a scaling factor, is the observing frequency, is the spectral index, and is the index of the power-law decay (see, e.g., Weiler et al. 2002). From a combined fit to the lightcurves at 20, 18 and 6 cm (dashed and solid lines, Fig. 5), we obtain Jy, yr (AD), , and , with a .
The value of obtained from this fit yields a secular decline rate of the radio emission of % per year. This decline rate is similar to the ones found for SN 1970G in the periods 1973–1991 and 1991–2001 (Cowan et al. 1991; Stockdale et al. 2001), and it is slightly lower than the value % obtained by Lacey et al. (2007) under the assumption of the SNR age of yrs.
Lacey et al. (2007) report variations of the spectral index, , observed over the time period 1972–2002. The spectral index remains relatively constant from 1982 to 1996, with an average value of 0.65 obtained largely from 1.4 and 4.8 GHz measurements. This value is in good agreement with the spectral index derived from our combined fit to the light curves at 6 and 20 cm. It steepens later to 1, albeit in measurements involving 22 GHz where spectral aging is more pronounced.
4.2 Constraining the age of SNR 4449–1
The estimate of yr (AD) indicates that the SN should have exploded 55 yr ago. This age agrees with the upper limit of 100 years (Milisavljevic & Fesen 2008) and with the 70 yr suggested by Bietenholz et al. (2010). It is also in agreement with the detections of the SNR on optical plates (see Milisavljevic & Fesen 2008 for a discussion), which indicated that the SN explosion must have taken place in 1961 or before.
Using the [OIII] optical emission line of the SNR spectrum, a range of expansion speeds of the SNR of 3000-6000 km s-1 was found (Blair & Fesen 1998). An estimated maximum expansion velocity of 6500 km s-1 was later provided (Bietenholz et al. 2010). This velocity range can be used to derive a lower limit on the age of SNR 4449–1. Adopting the SNR radius of 14–21 mas, as given by the semimajor and semiminor axes of the elliptical fit shown in Fig. 4 and an expansion speed of 6500 km s-1, we estimate an age of the SNR between 39 and 59 yr (assuming a constant expansion speed). The SN explosion would thus have taken place between 1951 and 1971, which is in agreement with the found from the fit to the radio light curves. Adopting an SNR radius of 16–21 mas, as given by the size estimate made with the feature F included, we obtain an age of the SNR of between 44 and 60 yr. This constrains the year of the SN explosion between 1950 and 1965, which is also in agreement with .
We note that these estimates are made under the assumption that the radio shell is expanding together with the optical [OIII] emitting gas, at a constant speed of 6500 km s-1. This is supported by the finding that the size of the shell-like structure observed at 1.6 GHz is similar to the one in the optical. If the outer shock front were moving faster than 6500 km s-1, the ages estimated using this expansion speed would constitute an upper limit to the remnant’s age.
Decelerated expansion
A deceleration in the shock front, produced by the interaction of the ejecta with a dense CSM, would affect the estimated age of the SNR as well. Chevalier (1982a); Chevalier (1982b) proposed that the relativistic electrons and enhanced magnetic field necessary to produce the observed radio synchrotron emission arise from the SN shock wave interacting with a dense CSM, which is presumed to have been established by a very effective mass-loss wind from the SN stellar progenitor.
According to Chevalier (1982a); Chevalier (1982b), the shock front of the SN in the CSM expands following a power law of time, , where is the deceleration parameter defined as
| (2) |
The radial density profiles of the ejecta and the CSM are also described as power laws, with indices and , respectively (i.e., the ejecta density is and the CSM density is ). The deceleration parameter, , can also be written in terms of the spectral index, , and the flux-density decay rate, , in the form (see Martí-Vidal et al. 2011b)
| (3) |
Taking the values of and , estimated from our fit to the radio light curves, equation 3 results in a deceleration parameter , if we use a radial CSM profile with (i.e., if we assume a constant mass-loss rate for the progenitor star). This value is in agreement with the typical values reported in other SNe (where the expansion has been monitored during several years). It is found in all cases that (Bietenholz et al. 2002; Weiler et al. 2002; Marcaide et al. 2009; Martí-Vidal et al. 2011a; and references therein).
5 Summary
We have presented the shell-like resolved structure of the young oxygen-rich SNR in NGC 4449. We obtain the most accurate estimates of the SNR position and size (0.0422 arcsec 0.0285 arcsec, corresponding to 0.8 pc 0.5 pc at a distance of 3.82 Mpc), making this object one of the largest extragalactic SNRs imaged with VLBI. The historical light curve of the source can be well fitted by a power law of index , after the inclusion of the total flux density at 1.6 GHz, and an SNR age of 55 yr. A decline rate of the radio emission of % yr-1 is found.
According to the fit of the radio light curves, the SN should have exploded around 1956, which is in agreement with the detection of the SN in the optical plates and with the age obtained assuming linear expansion with a maximum speed derived from the optical oxygen lines of 6500 km s-1. The constraint of the explosion date of SNR 4449–1 places this source in a unique position as being the youngest known supernova remnant (Cas A is the youngest Galactic SNR with an age of 330 yrs; Thorstensen et al. 2001).
From the 1.6 GHz VLBI observation, we derive a luminosity of erg s-1, which is comparable to the peak luminosity of SN 1970G and higher than the current luminosities of the Galactic SNRs Cas A and the Crab (see Lacey et al. 2007 for further discussion). This makes SNR 4449–1 an interesting link between SNe and their remnants and calls for classifying this object as a transition-type source that links SN explosions and SNRs (Lacey et al. 2007) or as an intermediate-age SNR with an exceptionally high radio luminosity (the so-called ‘radio hypernova remnant’; Wilkinson & de Bruyn 1990).
Additional monitoring at multiple radio frequencies is required to refine the fractional decline rate, light curve and spectral index evolution of the SNR, and to determine its properties and classification.
Acknowledgements
The authors are grateful to the comments of the anonymous referee, which helped to improve the manuscript. The EVN is a joint facility of European, Chinese, South African and other radio astronomy institutes funded by their national research councils. MM was supported for this research through a stipend from the International Max Planck Research School (IMPRS) for Astronomy and Astrophysics at the Universities of Bonn and Cologne.
References
- Annibali et al. (2008) Annibali F., Aloisi A., Mack J., Tosi M., van der Marel R. P., Angeretti L., Leitherer C., Sirianni M., 2008, AJ, 135, 1900
- Balick & Heckman (1978) Balick B., Heckman T., 1978, ApJ, 226, L7
- Bietenholz et al. (2010) Bietenholz M. F., Bartel N., Milisavljevic D., Fesen R. A., Challis P., Kirshner R. P., 2010, MNRAS, 409, 1594
- Bietenholz et al. (2002) Bietenholz M. F., Bartel N., Rupen M. P., 2002, ApJ, 581, 1132
- Blair & Fesen (1998) Blair W. P., Fesen R. A., 1998, in BAAS. p. 1365
- Blair et al. (1983) Blair W. P., Kirshner R. P., Winkler Jr. P. F., 1983, ApJ, 272, 84
- Chevalier (1982a) Chevalier R. A., 1982a, ApJ, 259, L85
- Chevalier (1982b) Chevalier R. A., 1982b, ApJ, 259, 302
- Cowan et al. (1991) Cowan J. J., Goss W. M., Sramek R. A., 1991, ApJ, 379, L49
- de Bruyn (1983) de Bruyn A. G., 1983, A&A, 119, 301
- Eck et al. (1998) Eck C. R., Roberts D. A., Cowan J. J., Branch D., 1998, ApJ, 508, 664
- Heywood et al. (2009) Heywood I., Blundell K. M., Klöckner H.-R., Beasley A. J., 2009, MNRAS, 392, 855
- Lacey et al. (2007) Lacey C. K., Goss W. M., Mizouni L. K., 2007, AJ, 133, 2156
- Liu & Bregman (2005) Liu J.-F., Bregman J. N., 2005, ApJS, 157, 59
- Marcaide et al. (2009) Marcaide J. M., Martí-Vidal I., Perez-Torres M. A., Alberdi A., Guirado J. C., Ros E., Weiler K. W., 2009, A&A, 503, 869
- Martí-Vidal et al. (2011) Martí-Vidal I., Marcaide J. M., Alberdi A., Guirado J. C., Pérez-Torres M. A., Ros E., 2011, A&A, 526, A142
- Martí-Vidal et al. (2011) Martí-Vidal I., Pérez-Torres M. A., Brunthaler A., 2011, A&A, 529, A47
- McDonald et al. (2001) McDonald A. R., Muxlow T. W. B., Pedlar A., Garrett M. A., Wills K. A., Garrington S. T., Diamond P. J., Wilkinson P. N., 2001, MNRAS, 322, 100
- Mezcua et al. (2013) Mezcua M., Farrell S. A., Gladstone J. C., Lobanov A. P., 2013, MNRAS, preprint (arXiv:1309.4463)
- Mezcua & Lobanov (2011) Mezcua M., Lobanov A. P., 2011, Astron. Nachr., 332, 379
- Milisavljevic & Fesen (2008) Milisavljevic D., Fesen R. A., 2008, ApJ, 677, 306
- Pennington & Dufour (1983) Pennington R. L., Dufour R. J., 1983, ApJ, 270, L7
- Reines et al. (2008) Reines A. E., Johnson K. E., Goss W. M., 2008, AJ, 135, 2222
- Sánchez-Sutil et al. (2006) Sánchez-Sutil J. R., Muñoz-Arjonilla A. J., Martí J., Garrido J. L., Pérez-Ramírez D., Luque-Escamilla P., 2006, A&A, 452, 739
- Seaquist & Bignell (1978) Seaquist E. R., Bignell R. C., 1978, ApJ, 226, L5
- Stockdale et al. (2001) Stockdale C. J., Goss W. M., Cowan J. J., Sramek R. A., 2001, ApJ, 559, L139
- Summers et al. (2003) Summers L. K., Stevens I. R., Strickland D. K., Heckman T. M., 2003, MNRAS, 342, 690
- Thorstensen et al. (2001) Thorstensen J. R., Fesen R. A., van den Bergh S., 2001, AJ, 122, 297
- Weiler et al. (2002) Weiler K. W., Panagia N., Montes M. J., Sramek R. A., 2002, ARA&A, 40, 387
- Wilkinson & de Bruyn (1990) Wilkinson P. N., de Bruyn A. G., 1990, MNRAS, 242, 529
- Yokogawa et al. (2002) Yokogawa J., Imanishi K., Koyama K., Nishiuchi M., Mizuno N., 2002, PASJ, 54, 53
Appendix
Discussion on the image fidelity
The sparse uv-coverage of our observations has a direct effect on the fidelity of the SNR N44491 image. Holes in the uv-coverage map into a complete filtering of a range of spatial frequencies in the image plane. Hence, any structure with spatial scales corresponding to spatial frequencies not covered in our observations will be invisible to the interferometer.
On the one hand, extended sources (like spherical shells or rings) have different amplitude components at different spatial scales. If we are unable to measure all these components at all spatial frequencies, it is difficult (if not impossible) to recover the source structure with a high fidelity, unless some assumptions are made. On the other hand, things are different for sources consisting of a discrete set of compact (i.e., point-like) components. A point source has exactly the same amplitude at all the spatial scales. Hence, the imaging of such a source (or a discrete set of such sources) is very robust, even if the uv-coverage is sparse.
Our image of SNR N44491 consists of a set of compact sources distributed following a somewhat elliptical manner. This image can be understood as an elliptical structure, whose spatial frequencies have been filtered by a sparse uv-coverage. As a result of the spatial-frequency filtering, the image is only sensitive to the portions of the elliptical structure whose spatial frequencies are sampled by the interferometer. The effect of a sparse uv-coverage on extended sources (in particular, the shell-like structures corresponding to radio-SNRs) was studied by Heywood et al. (2009) and discussed (and discarded) in Bietenholz et al. (2010) as a possible origin of the distorted structure seen in their HSA image of SRN N44491.
We have performed a test similar to that described in Bietenholz et al. (2010), although with some substantial differences. Instead of simulating observations of a spherical shell from a synthetic uv-coverage and receiver noise, we added the shell model to the residual (i.e., post-CLEAN) visibilities of our own observations. This way, the noise and the visibility weights result to be exactly the same as those of the real source observations. The deconvolved image of the spherical shell (of size 50 mas) is shown in Fig. 6.The recovered signal from the shell is broken into several compact features, which are distributed around the outer edge of the source structure. Hence, if the structure of SNR N44491 is extended (as it is indeed the case), our sparse uv-coverage translates into an incomplete detection of the whole structure, with several compact components distributed along the radio-emitting region. Hence, it is not possible to discern the innermost details of the source structure from our observations (i.e., we cannot tell whether the source resembles more a disc, a ring, or a shell), but we can still get information on the source size, based on the distribution of the compact components recovered in our image.