Microwave and EUV Observations of an Erupting Filament and Associated Flare and CME
C. E. Alissandrakis11
1
Department of Physics, University of Ioannina, GR-45110 Ioannina, Greece,
A. A. Kochanov22
2
Institute of Solar-Terrestrial Physics, Lermontov St. 126, Irkutsk 664033,
Russia,
S. Patsourakos1, A. T. Altyntsev2,
S. V. Lesovoi2,
N. N. Lesovoya2
Accepted for publiction in PASJ, 2013/07/17
Keywords: Sun: radio radiation – Sun: prominences – Sun: coronal mass ejections (CMEs)
Abstract
A filament eruption was observed with the Siberian Solar Radio Telescope (SSRT) on June 23 2012, starting around 06:40 UT, beyond the West limb. The filament could be followed in SSRT images to heights above 1 R⊙, and coincided with the core of the CME, seen in LASCO C2 images. We discuss briefly the dynamics of the eruption: the top of the filament showed a smooth acceleration up to an apparent velocity of km s-1. Images behind the limb from STEREO-A show a two ribbon flare and the interaction of the main filament, located along the primary neutral line, with an arch-like structure, oriented in the perpendicular direction. The interaction was accompanied by strong emission and twisting motions. The microwave images show a low temperature component, a high temperature component associated with the interaction of the two filaments and another high temperature component apparently associated with the top of flare loops. We computed the differential emission measure from the high temperature AIA bands and from this the expected microwave brightness temperature; for the emission associated with the top of flare loops the computed brightness was 35% lower than the observed.
1 Introduction
Magnetic structures containing dense and cool chromospheric plasma which is suspended against the solar gravity high up in the corona are observed as filaments against the solar disk or as prominences off-limb. They can experience long periods of stability by persisting for several solar rotations.

The occasional eruption of quiescent filaments has been known for many decades (see e.g. D’Azambuja (1925)). Soon after Coronal Mass Ejections (CMEs) were detected, it was realized that filament eruptions can lead to CMEs with a high probability; for example, Gopalswamy et al. (2003) found that 72% of the filament eruptions they studied led to CMEs. Moreover, filament eruptions are involved in a significant fraction of the observed CMEs. For example Subramanian & Dere (2001) showed that 60% of CMEs in their sample was associated with filament eruptions. Sometimes, during their ascend, eruptive filaments experience some mild heating (i.e., not leading to flare temperatures), e.g., Landi et al., 2010). CMEs related to filament eruptions could be launched either from active regions (active region filaments) or the quiet Sun (polar crown filaments).
An important problem of the physics of CMEs is related to the nature of their seed magnetic structure with basically two opposing schools of thought. There are CME models which require the existence of a magnetic flux rope, i.e., a structure with twisted magnetic field lines along its central axis, before the eruption, whereas there are other models in which a flux rope forms during the eruption (see for example the reviews of Forbes, 2000 and Klimchuk, 2001). While direct imaging observations of pre-existing flux ropes started to become available with recent AIA observations in hot, flare emissions (e.g., Zhang et al. ,2012, Patsourakos et al., 2013), observations of filaments both before and during CMEs can also supply important information for the above-mentioned problem. This is because filaments frequently show evidence of twisted structure before and during their eruption and undergo kinking and rotations (e.g. Williams et al., 2005). All the above are frequently interpreted in terms of instabilities of magnetic flux ropes. It is thus obvious why the study of filaments, both when they are in quiescence and when they erupt, is important in the study of solar eruptions.
In the microwave range filaments have been observed both on the disk as temperature depressions and as prominences in emission beyond the limb (Kundu, 1972). Combined microwave (VLA) and EUV (SUMER, CDS) observations of a filament on the disk were analyzed by Ciuderi Drago et al. (2001). In the metric range filaments are seen as depressions on the disc (e.g. Marqué, 2004), but there have also been reports of their association with emission sources at decametric wavelengths (Lantos et al., 1987).
With the availability of daily observations from the Nobeyama Radio Heliograph (NoRH) and the Siberian Solar Radio Telescope (SSRT), several reports of erupting filaments and associated CMEs have been published (see, e.g. Gopalswamy, 1999). Uralov et al. (2002) presented an event observed by both instruments and proposed that the eruption may have been caused by the interaction of two filaments. More cases were studied by Grechnev et al. (2006).
In this work we report a filament eruption observed with the SSRT. Unfortunately the event did not occur within the time range of the NoRH, so we have no spectral information. However, we complete our microwave data with images from STEREO behind the limb and high cadence AIA/SDO images; both STEREO and SDO data are used in this context for the first time. We start with an overview of the event, we discuss briefly its dynamics and we use AIA data to compute the contribution of the high temperature plasma to the microwave emission
2 Overview of the Event
The Siberian Solar Radio Telescope (SSRT, Grechnev et al., 2003), operating at 5743 MHz (5.2 cm), observed a filament eruption beyond the West limb, which started around 06:40 UT on June 23, 2012. Figure 1 gives a sequence of SSRT images, which show the classic picture of initial slow rise followed by a rapid expansion. It is the central part of the filament that rises, while its edges remain more or less fixed. Although its contrast decreases with time, the filament remains visible up to a height of more than 1 R⊙, until its top overlaps with a grating image of the solar disk, seen in Figure 1 at the upper right corner of the images. The visibility of the filament is also affected by sidelobes from the two bright points that appeared near the limb during the late phases of the event; most of this effect has been removed by “cleaning” in Figure 1. The brightness temperature of the filament was K at 06:53:22 UT, dropping to K at 07:19:51 UT; note that due to the varying sky background the accuracy of these measurements is not better than 500 K.

Figure 2c shows the first LASCO C2 image (at 07:24:18 UT) where the CME went above the occulting disk, together with the corresponding 304 Å AIA image. In the nearest SSRT image (Figure 2b) at 07:24:15 UT, the filament is very faint and its top is already inside the grating image of the sun; still, the flank of the filament (marked F in the figure) is visible in both the SSRT and C2 images, which demonstrates that the erupting filament corresponds to the core of the CME. For reference, the previous SSRT and the next C2 images are shown in Figure 2a and 2d respectively.

It is clear from Figure 1 that the event occurred behind the limb. In the days prior to the eruption, the filament was visible on the disk, on top of the neutral line of NOAA Active Region 11506; this filament had merged with a pre-existing filament located at its NE. AR 11506 was in its decay phase, with no sunspots visible after June 18.
At the time of the event STEREO-A was at an angle of 116 degrees with respect to the earth. As expected, STEREO-A/EUVI gives a very good view of what happened behind the limb (Figure 3; see also movies 1 and 2 which show almost simultaneous SDO and STEREO-A images in the 304 and 171 Å bands, as well as movie 3 showing the flare evolution in all four STEREO bands). We can see here a classic two ribbon flare, accompanying the filament eruption, with the first brightening appearing around 06:47 UT at 304 Å and at 06:50 at 171 Å. Note that it was the eastern portion of the filament that first erupted. Note also the existence of a second, arch-like dark filament, best seen in the 195 and 204 Å bands (marked f2 in the Figure), oriented almost perpendicularly to the main filament. While the eruption of the main filament was already in progress, it interacted with the main filament, giving rise to intense emission in all STEREO bands with a maximum around 07:07 UT (third column of images in Figure 3, marked E in the 284 Å image). We further note that the eruption had the characteristics of a disparition brusque: the main filament reformed approximately one day later, as evidenced by the STEREO-A data.

Going back to the earth point of view, Figure 4 shows an H and a Heii 304 Å image in the early stage of the event, both at a resolution much better than the 23′′ resolution of the SSRT. The images, H in particular, show two discrete prominence structures: a lower structure, apparently corresponding to filament f2 seen in STEREO-A and a higher structure, corresponding to the main erupting filament (we will call this structure f1 hereon). A detailed examination of the series of images shows that the activation of f2 occurred after f1 (see movie 1 and discussion in section 4). Also visible in the SDO images in the 171 Å band (movie 2) is a set of expanding loops spanning the filament.
Let us now compare the morphology of the microwave and the EUV emission. We remind the reader that the AIA channels are sensitive to temperatures in the range from K to K, while the microwave brightness temperature is much lower. Still a comparison is meaningful, because in the microwaves we may have contribution of optically thin emission from material at temperatures much higher than the brightness temperature. We chose to compare in Figure 5 an SSRT image with a low temperature band (304 Å, K) and a high temperature band (94 Å, and K) image. The time of the images in the figure was chosen so that the erupting filament was still inside the AIA field of view, which does not extend in height beyond 0.35 R⊙, significantly less than the SSRT.

Taking into account the difference in resolution, the SSRT image looks very much like the 304 Å image; we note that the 304 Å image is also very similar to the 1600 Å band image (not shown here), which has significant contribution from the Civ lines at 1548 Å, also formed at a temperature of K. Comparing the 304 and 94 Å images, we can identify hot and cold components: The filaments f1 and f2 are practically invisible in the 94 Å image, while the bright region E, the result of the interaction between the two, is seen in both bands. In addition, the high temperature band shows a bright component just above the limb (marked b in the figure), invisible in the 304 Å image.
It is interesting to note that all these components are present in the SSRT image. On the basis of the above, we can roughly identify three temperature components in the microwave emission: (a) a low temperature component, associated with the erupting filaments, (b) an intermediate temperature component associated with the interaction of the two filaments and, (c) a hot component just above the limb, the nature of which will be further elaborated upon later in this article. As for the filament-associated component, the fact that it appears in absorption on the disk implies that its electron temperature is below the disk brightness temperature of K, i.e. much below the average formation temperature of the Heii 304 Å line. However, it is not clear if the appearance of the filament in the 304 Å band image is due to the extension of its temperature sensitivity down to K or due to the transition region between the filament and the corona.
3 Radio Emission at Metric and Longer Wavelengths
Earth-based instruments show no trace of metric emission associated with the event,

apparently due to the occultation of the source by the solar disk; thus the only source of information is the SWAVES-A receiver aboard STEREO-A which, however, observes below 16 MHz that corresponds to a radial distance R⊙, according to the Newkirk model. The dynamic spectrum (Figure 6) shows a group of type III bursts from 06:48 to 07:18 UT; this is after the filament activation and nearly at the same time as the appearance of the first flare kernels in the STEREO 304 images (06:47 UT). The type IIIs were seen near the earth by WIND/WAVES at lower frequencies, as well as by SWAVES-A; they were detectable down to at least 30 kHz, well into the interplanetary medium.
A second instance of metric emission was from 07:35 to 07:54 UT, which was after the sequence of SSRT images shown in Figure 1. This comprised a strong type III at 07:37 and a type II-like emission with fundamental-harmonic structure; the middle frequency of this feature was 5.51 MHz at 07:48 UT and its logarithmic drift rate was s-1.

4 Dynamics
The AIA/SDO data show a complex dynamic behavior of the eruption, in particular at the region of interaction of the two filaments as evidenced in the AIA 304 Å images in movies 1 and 2. We will outline here the motion of the main filament and we will defer a detailed study to a subsequent publication.
In spite of the complex dynamics in the interaction region, the main filament rises smoothly, as shown in the upper panel of Figure 7, which presents the projected height of the top of the filament as a function of time, measured in 304 Å, SSRT and LASCO C2 and C3 images. The values among the four data sets are fairly consistent, with SSRT bridging the gap between AIA and LASCO data. The filament can be followed up to a height of R⊙ in the C2 field of view and up to R⊙ in C3. The velocity, shown in the middle panel of Figure 7, also shows a smooth rise and stabilizes to km s-1 after 07:30 UT.
We fitted the projected height of the filament top, with the smooth function:
| (1) | |||||
proposed by Sheeley et al. (2007). Here and are the initial and final (asymptotic) values of the expansion velocity, is the time when the velocity attains its average value, , is the corresponding height and is the time-scale of the acceleration. The corresponding velocity, , is:
| (2) |
and the acceleration, is:
| (3) |
The acceleration maximizes at with a maximum value of
| (4) |
the width of the curve being approximately .
We fitted both the projected height to Equation (1) and the velocity, computed numerically as the forward difference of consecutive heights, to Equation (2). The numerical computation of the acceleration was much too noisy to be used for a fit to Equation (3). The obtained parameters from the two fits had similar values, so we used their average to plot the smooth curves in Figure 7. The acceleration derived from the fit (lower panel of Figure 7) has a maximum value of 0.74 km s-2 around 07:09:53 UT, and a width of min.

The dynamics is much more complex in the region of interaction of the two filaments. We show in the top row of Figure 8 three 304 Å AIA images at characteristic phases of the eruption: before the 2-filament interaction, during and after. In the middle row we present images of the intensity as a function of time and position along the lines marked 1 and 2 in the upper row; they show very well the rise of the two filaments, f1 and f2. Cut 1 shows clearly that the phase of rapid rise of f2 was delayed by a few minutes with respect to f1; it also shows very well the interaction, which appears as bright emission between 06:55 and 07:13 UT. Note also that the interaction appears to have no effect to the top of the main filament (f1), as evidenced by cut 2.
The cuts parallel to the limb (bottom row of Figure 8) also show very well the interaction region. The first thing to notice is that the motion is much more complex in the north leg of the filament, where the interaction occurred, than in the south. Strong twisting motions are observed and the material spreads out considerably, in contrast to the south leg where twisting motions are weak and the material remains fairly confined.
5 Contribution of High Temperature Plasma to the microwave emission
The EUV bands of AIA, with the exception of the one at 304 Å, can be used for computations of the differential emission measure (DEM) in the temperature range between of 5.5 to 7.5. The DEM, in turn, can be used to compute the contribution of the plasma within this temperature range to the microwave brightness temperature, . Obviously, as discussed in section 2, there is significant contribution to the microwave emission from plasma below this temperature range, nevertheless the value computed from the DEM can be considered as a lower limit.
The microwave brightness temperature is given by
| (5) |
where is the electron temperature and the optical depth along the line of sight. The optical depth is determined by the electron temperature and the electron density, :
| (6) |
where is the observing frequency, is the distance along the line of sight and is a slowly varying function of temperature and density. We have taken , taking into account the effect of He and heavy elements (Chambe and Lantos, 1971).
Suppose now that the electron temperature varies monotonically along the line of sight, as, e.g., in the case of a stratified atmosphere; then the integration of Equations (6) and (5) can be done with as a variable rather than or . The optical depth can be expressed as a function of as follows:
| (7) |
where
| (8) |
is the DEM. This integrates to:
| (9) |
where is the electron temperature nearest the observer. Using as a variable, Equation (5) gives for the brightness temperature:
| (10) |
where is the electron temperature further away from the observer.
Note that expressions (7) to (9) are valid even if the temperature variation along the line of sight is not monotonic. This is not the case for (10), due to the factor; however, Equation (10) is still valid in the optically thin case, because then the exact location of each temperature layer is not important.
To calculate DEMs from the AIA observations we used the method described in Plowman et al. (2013), hereafter PKM13. The input to the PKM13 method is the observed AIA intensity in its 6 coronal channels centered around 94, 131, 171, 193, 211 and 335 Å, which cover the range 5.5-7.5 in logT. PKM13 is a very fast iterative method based on regularization. The temperature response functions of the AIA channels are used as basis functions in the inversion. For more details on the method and its performance we refer the reader to the PKM13 article. Other methods for DEM determinations from AIA data are described by Aschwanden et al. (2013) and in Hannah & Kontar (2012). Note, that it is well-known that the DEM inversion problem is an ill-posed one, i.e., there are more unknowns than knowns (e.g. Craig & Brown, 1976) and thus the solutions we (or anybody) calculate are not unique. Morever, the PKM13 method gives occasionally negative values for the DEM; these were ignored in our further analysis.
For the computation we used the AIA observations around 07:02 and 07:32 UT. The AIA level-1 images were first co-registered to a common center and binned to the same pixel size using the aia_prep.pro routine. In the DEM calculations we used the most recent available AIA temperature response functions (V4) which take into account an inter-calibration between AIA full disk intensities and SDO/EVE spectral irradiance data as well as a fix to the temperature response function of mainly the 94 Å channel for which the CHIANTI database used in the calculation of the AIA temperature functions lacks several spectral lines. Our calculations were carried out over a sub-field around the erupting filament.
One way to access the success of the performed DEM inversions is to compare the AIA intensities () predicted from the calculated DEMs with the observed intensities (). We thus defined the normalized intensity residual as
and calculated it for all 6 AIA channels used in the DEM determination. The above quantity for most channels exhibits a well-defined peak in the range of [-0.1, 0.1] with FWHM widths in the range of [0.05, 0.4]. for the 94 Å band shows a broader distribution of residuals, in the range [-0.4, 0.4]. From the above we conclude that the calculated DEMs do a rather good job in reproducing the observed intensities to within 5 to 40 which is deemed acceptable given all the uncertainties and assumptions entering into the DEM and temperature response function determinations.
As a further check of our computations, we used our results to calculate the total volume emission measure and compared it to the one deduced from the ratio of the two soft X-ray GOES channels. At 07:32 UT we got a value of 2.11 cm-3 from our measurements and 2.0 cm-3 from GOES, which also gave an average temperature of K; the proximity of the DEM values is striking so is the consistency of the temperature (see next paragraph).

Figure 9 shows examples of our computations using AIA images near 07:35 UT. The middle row shows the DEM as a function of position and , along the four cuts marked to in the images of the upper panel. Here the 304 Å image is given for reference, since it was not used in the DEM computation; the other images sample low and high temperature regions. The bottom plots show the optical depth and the brightness temperature at the SSRT frequency, computed as outlined above, under the optically thin approximation. Note that in the bright region above the limb most of the plasma is near K, which is consistent with the GOES results.
Let us first note that in all cases the optical depth is much less than unity, so that the optically thin approximation is valid. Cut represents a very quiet coronal region and the corresponding DEM shows a peak around , which corresponds to the coronal temperature in the quiet sun. The maximum brightness temperature is only 16 000 K, with the peak right after the limb, as expected. Cuts and , that cross regions near the limb which appear bright in both the 131 and the 94 Å bands (section 2), show a clear high temperature component near and the brightness temperature goes up to . The high temperature component has a slightly smaller value in cut , in which the 131 Å emission is weaker. In all cases there is a weak component at , apparently corresponding to the upper Transition Region.

We will now compare the computed brightness with the SSRT images. This is done in Figure 10, where we selected two instances: one at 07:02 UT, where the main filament is still in the AIA field of view and another at 07:32 UT, where the bright region next to the limb is well visible. There is no trace of the filament itself in the computed , which verifies that its temperature is much below the range of the DEM computed from the AIA images. What is clearly visible is the region of interaction of the two filaments and the bright region just above the limb. Note, however, that the observed spatial distribution of the latter is not the same as the computed; in particular, the SSRT shows two bright blobs, while the computed is more evenly distributed along the limb.
Comparing the computed brightness temperature with the observed, we note that the maximum computed at 07:32 UT is K and drops to K after the convolution with the SSRT beam; this is 65% of the observed value of K.

Let us now consider the origin of the bright region above the limb that developed at the late stage of the eruption. From its geometry it is obvious that it comes from behind the limb and one possible origin is the tops of hot flare loops. Figure 11 shows an SSRT image and the corresponding STRERO-A image at 195 Å. The comparison of the two shows that the northern bright blob is located between the flare ribbons in the E part of the flare, while the southern blob is between the ribbons in the W part of the flare; thus they might indeed be manifestations of hot flare loop tops.
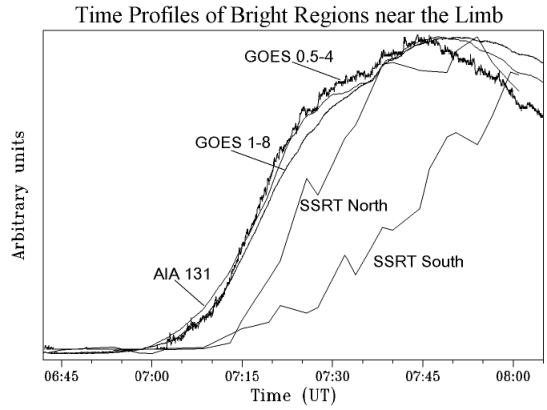
Further information about the origin of the emission can be obtained from its time profile (Figure 12). The form of the profiles in the two GOES channels is practically identical during the rise, which indicates that there is no hard x-ray component in the emission, apparently because any such component is occulted. Unfortunately, during the event there are no RHESSI data that would confirm the absence of hard X-ray emission. The time profile in the AIA 131 Å band follows closely the GOES profiles. The SSRT shows two distinct regions (cf Figure 11), with the one in the north brightening first.
Both bright regions show too slow a rise to be anything but of thermal origin, although the northern region rises faster than GOES. It is interesting, moreover, that the rise of the SSRT emission is delayed by 4 min with respect to GOES. One possible explanation is in terms of optically thin emission from a cooling hot plasma, since in this case. The maximum of the northern SSRT region occurs near the peak of the GOES profiles, while the southern region, which is originally weaker than the northern, attains its maximum about 10 minutes later. If we accept the interpretation given previously that the origin of the bright regions is the top of hot flare loops, the delay of the southern region could be explained in terms of geometric effects, since its origin is located further away from the solar limb as seen from the earth.

Another interesting result is that the SSRT emission is below the radio limb (Figure 13). As the AIA images certify that the source of the emission is behind the limb, this implies that the region between the optical and the radio limb is optically thin at 5.2 cm.
6 Summary and conclusions
The combination of the SSRT observations with data from SDO and STEREO give a more complete view of the filament eruption and the associated CME that was observed above the W limb on June 23, 2012. This is an important improvement compared to previous works that used EIT for comparison (Uralov et al. (2002), Grechnev et al. (2006)). The SSRT detected the filament up to a height of more than 1 R⊙ above the limb, at a time that the CME was visible in the LASCO C2 coronograph. This made possible to verify that the filament coincides with the core of the CME, as already pointed out by Grechnev et al. (2006). Thus the SSRT bridges the gap between the field of view of AIA/SDO and the occulting disk of C2.
The ascent of the filament could be followed up to R⊙ in the C3 coronograph. Its accelerating phase lasted for about 50 min and after that its projected velocity stabilized to km s-1, a phase that lasted as long as the filament was detectable in C3 ( min). Fitting the data to the smooth curve proposed by Sheeley et. al. (2007), we deduced a maximum accelaration of 0.74 km s-2, attained around 07:09:53 UT. During the rise of the acceleration the first flare kernel at 304 Å was recorded in STEREO-A images (at 07:47) and a prominent group of type III burst appeared in the dynamic spectrum of STEREO-A/WAVES (from 06:48 to 07:18 UT).
Later on, from 07:40 to 07:54 UT, a feature resembling a short type II burst was detected in the STEREO-A/WAVES dynamic spectrum; at 07:47 UT it was at 5.51 MHz and had a frequency drift s-1. At that time the projected height of the filament was 4.6 R⊙ and its projected velocity 1060 km s-1.
The emission frequency of the type II-like feature corresponds to an electron density of cm-3. According to the Newkirk (1961) model, this density occurs at a height of 4.5 R⊙ which is comparable to the observed, 4.6 R⊙; by contrast, the Saito (1970) model gives a height of only 3 R⊙, well below the observed. The observed frequency drift corresponds to a radial velocity of 1800 km s-1 in the Newkirk (1961) model and 600 km s-1 in the Saito (1970) model, compared to the observed speed on the plane of the sky of 1060 km s-1. If the proximity of the observed height to that deduced from the Newkirk model signifies that the prominence was practically on the plane of the sky, the difference between the model radial velocity and the measured projected velocity might be attributed to the inclination of the velocity vector with respect to the sky plane.
Both AIA/SDO and STEREO data showed the interaction of the main filament, initially located above the neutral line of AR 11506, with a smaller filament, located almost in the perpendicular direction. A similar two-filament interaction was reported by Uralov et. al. (2002), who considered it as the origin of the eruption. In our case the interaction, which led to intense emission in the high temperature AIA bands, as well as to strong twisting motions in the northern leg of the filament, occurred at a time when both filaments were already rising with increasing acceleration. It is thus rather unlikely that the filament interaction initiated the eruption, although it must have had a significant contribution to the acceleration, the maximum of which occurred after the interaction.
Morphologically the filament was very similar in the SSRT images, in H, and in the AIA 304 and 1600 Å bands. A closer examination and the comparison with the AIA images revealed three components in the microwave emission: a low temperature component, associated with the filament proper, a high temperature component associated with the filament interaction region and an even higher temperature component associated with the top of hot post-flare loops. Thus the SSRT images probe efficiently a very wide temperature range, from to K.
We found no evidence of microwave non-thermal emission, which is natural due to the fact that the flare footpoints were behind the limb. We thus computed the brightness temperature of the thermal emission from the differential emission measure in the range of between 5.5 and 7.5, deduced from the AIA high temperature bands. The DEM computed in this way was consistent within 5% with the volume emission measure computed from the GOES data. For the bright regions associated with the top of hot post-flare loops we found that the computed peak brightness temperature, after convolution with the SSRT beam, was 35% lower than the observed.
Several works in the past have shown inconsistencies between the radio emission computed from EUV data and the observations. In the quiet sun, for example, in order to match the computations with the observation one has to take models of the cell interior rather than of the average quiet sun (see, e.g., the review by Shibasaki et al., 2011). In another work Zhang et al. (2001), using a three temperature EUV model found that the computed was two times greater than the observed. Using simultaneous WRST and HXIS data, Alissandrakis et al. (1988) found very little contribution of thermal emission to the total radio emission in the post flare phase (which is considered to be of thermal origin) for most of the events they studied. However, Grechnev et. al. (2006) got a fairly good match between the flux observed by the SSRT and that computed on the basis of GOES data.
In our case the difference between the computed and observed can be attributed to several causes. One explanation is that the missing part of the observed emission comes from plasma at temperatures lower that K, which are below the range of the AIA-computed DEM. Another possibility is that the difference is due to calibration inaccuracies. A third possibility is the presence of a non-thermal component which, in the absence of hard X-ray data, cannot be excluded.
Finally, we noticed that the loop-top associated emission in the SSRT images came from a region located below the radio limb; this implies that the region between the optical and the radio limb is optically thin at 5.2 cm.
An extension of the present work will be a detailed study of the possible triggering and driving mechanism(s) of the filament eruption. For example, the study of the temporal associations between the flare emissions (AIA, GOES and EUVI light-curves) and the filament acceleration will possibly supply hints on whether the eruption was triggered by an ideal or non-ideal process (e.g., Bein et. al., 2012). Moreover, it will be interesting to study characteristics of the eruption such as the evolution of its rotation and twist, to see if they comply with predictions of CME models (e.g., Lynch et al. (2009), Kliem et al. (2012)).
This work benefited greatly from the data available in the AIA/SDO, SECCHI/STEREO, LASCO/SOHO, GOES, GONG, WIND/WAVES and STERO/WAVES data bases. The authors would like to thank all those who worked for the development of these instruments, for their operation and for making public the data. The AIA data used here are courtesy of SDO (NASA) and the AIA consortium. The SECCHI data are courtesy of STEREO and the SECCHI consortium. SOHO is an international collaboration between NASA and ESA. LASCO was constructed by a consortium of institutions: the Naval Research Laboratory (Washington, DC, USA), the Max-Planck-Institut fur Aeronomie (Katlenburg- Lindau, Germany), the Laboratoire d’Astronomie Spatiale (Marseille, France), and the University of Birmingham (Birmingham, UK). The Global Oscillation Network Group (GONG) project, is managed by the National Solar Observatory, which is operated by AURA, Inc. under a cooperative agreement with the National Science Foundation. The STEREO/WAVES and Wind/WAVES experiments are a collaboration of NASA Goddard Space Science Fight Center, the Observatory of Paris-Meudon, the University of Minnesota and the University of California, Berkley.
The work in the Institute of Solar Terrestrial Physics is supported by the Ministry of Education and Science of the Russian Federation (projects 8407 and 14.518.11.7047) and by the grants of RFBR (12-02-91161-GFEN-a, 12-02-00616, 12-02-00173-a, 12-02-33110-mol-a-ved, and 12-02-31746-mol-a) and by a Marie Curie International Research Staff Exchange Scheme Fellowship within the 7th European Community Framework Programme.
S. Patsourakos acknowledges support from an FP7 Marie Curie Re-integration Grant (FP7-PEOPLE-2010-RG/268288) and from European Union (European Social Fund-ESF) and Greek national funds through the Operational Program ”Education and Lifelong Learning” of the National Strategic Reference Framework (NSRF) - Research Funding Program: Thales. Investing in knowledge society through the European Social Fund.
C. Alissandrakis would like to thank the colleagues from ISTP for their warm hospitality during his stay there; he also thanks the Organizing Committee of the SPRO2012 conference held in Nagoya in November 2012 for funding his participation.
Finally the authors wish to thank H. Warren and P. Boerner for their help with the AIA temperature response functions.
References
Alissandrakis, C. E., Schadee, A., & Kundu, M. R. 1988, A&A, 195, 290
Aschwanden, M. J., Boerner, P., Schrijver, C. J., & Malanushenko, A. 2013, Sol. Phys., 283, 5
Bein, B. M., Berkebile-Stoiser, S., Veronig, A. M., Temmer, M., & Vršnak, B. 2012, ApJ, 755, 44
Chambe, G., & Lantos, P. 1971, Sol. Phys., 17, 97
Chiuderi Drago, F., Alissandrakis, C. E., Bastian, T., Bocchialini, K., & Harrison, R. A. 2001, Sol. Phys., 199, 115
Craig, I. J. D., & Brown, J. C. 1976, A&A, 49, 239
D’Azambuja, L. 1925, L’Astronomie, 39, 209
Forbes, T. G. 2000, J. Geophys. Res., 105, 23153
Gopalswamy, N. 1999, Proceedings of the Nobeyama Symposium, NRO Report 479, 141
Gopalswamy, N., Shimojo, M., Lu, W., et al. 2003, ApJ, 586, 562
Grechnev, V. V., Lesovoi, S. V., Smolkov, G. Y., et al. 2003, Sol. Phys., 216, 239
Grechnev, V. V., Uralov, A. M., Zandanov, V. G., Baranov, N. Y., & Shibasaki, K. 2006, PASJ, 58, 69
Hannah, I. G., & Kontar, E. P. 2012, A&A, 539, A146
Kliem, B., Török, T., & Thompson, W. T. 2012, Sol. Phys., 281, 137
Klimchuk, J. A. 2001, Washington DC American Geophysical Union Geophysical Monograph Series, 125, 143
Kundu, M. R. 1972, Sol. Phys., 25, 108
Landi, E., Raymond, J. C., Miralles, M. P., & Hara, H. 2010, ApJ, 711, 75
Lantos, P., Alissandrakis, C. E., Gergely, T., & Kundu, M. R. 1987, Sol. Phys., 112, 325
Lynch, B. J., Antiochos, S. K., Li, Y., Luhmann, J. G., & DeVore, C. R. 2009, ApJ, 697, 1918
Marqué, C. 2004, ApJ, 602, 1037
Newkirk, G., Jr. 1961, ApJ, 133, 983
Patsourakos, S., Vourlidas, A., & Stenborg, G. 2013, ApJ, 764, 125
Plowman, J., Kankelborg, C., & Martens, P. 2013, ApJ, 771, 2
Saito, K., 1970, Ann. Tokyo Astron. Obs., Ser 2, 12, 53
Sheeley, N. R., Jr., Warren, H. P., & Wang, Y.-M. 2007, ApJ, 671, 926
Shibasaki, K., Alissandrakis, C. E., & Pohjolainen, S. 2011, Sol. Phys., 273, 309
Subramanian, P., & Dere, K. P. 2001, ApJ, 561, 372
Uralov, A. M., Lesovoi, S. V., Zandanov, V. G., & Grechnev, V. V. 2002, Sol. Phys., 208, 69
Williams, D. R., Török, T., Démoulin, P., van Driel-Gesztelyi, L., & Kliem, B. 2005, ApJL, 628, L163
Zhang, J., Kundu, M. R., White, S. M., Dere, K. P., & Newmark, J. S. 2001, ApJ, 561, 396
Zhang, J., Cheng, X., & Ding, M.-D. 2012, Nature Communications, 3,