Improved 192,194,195,196Pt() and 192Ir() astrophysical reactions rates
Abstract
192Pt is produced solely by the slow neutron capture (s) nucleosynthesis process and hence an accurate (,) reaction rate for this nuclide would allow its use as an important calibration point near the termination of the s-process nucleosynthesis flow. For this reason, we have measured neutron capture and total cross sections for 192,194,195,196,natPt in the energy range from 10 eV to several hundred keV at the Oak Ridge Electron Linear Accelerator. Measurements on the other Pt isotopes were, in part, necessitated by the fact that only a relatively small 192Pt sample of modest enrichment was available. Astrophysical 192,194,195,196Pt() reaction rates, accurate to approximately 3%–5 %, were calculated from these data. No accurate reaction rates have been published previously for any of these isotopes. At s-process temperatures, previously recommended rates are larger (by as much as 35%) and have significantly different shapes as functions of temperature, than our new rates. We used our new Pt results, together with 191,193Ir(n,) data, to calibrate nuclear statistical model calculations and hence obtain an improved rate for the unmeasured s-process branching-point isotope 192Ir.
I Introduction
The 192Pt(,) cross section is particularly important to nuclear astrophysics studies for at least two reasons, as illustrated in Fig. 1. First, 192Pt is the heaviest nuclide produced solely by the s process (the so-called s-only isotopes) for which reliable neutron capture data do not exist across the range of temperatures ( 6–26 keV) needed by s-process models. Second, 192Pt is partially bypassed during the s process by a branching at 192Ir. Because this branching is expected to be practically independent of temperature and electron density, it is particularly sensitive to the neutron density during the s process. However, a meaningful analysis of this branching has not been possible because of the large uncertainty in the 192Pt(,) reaction rate.
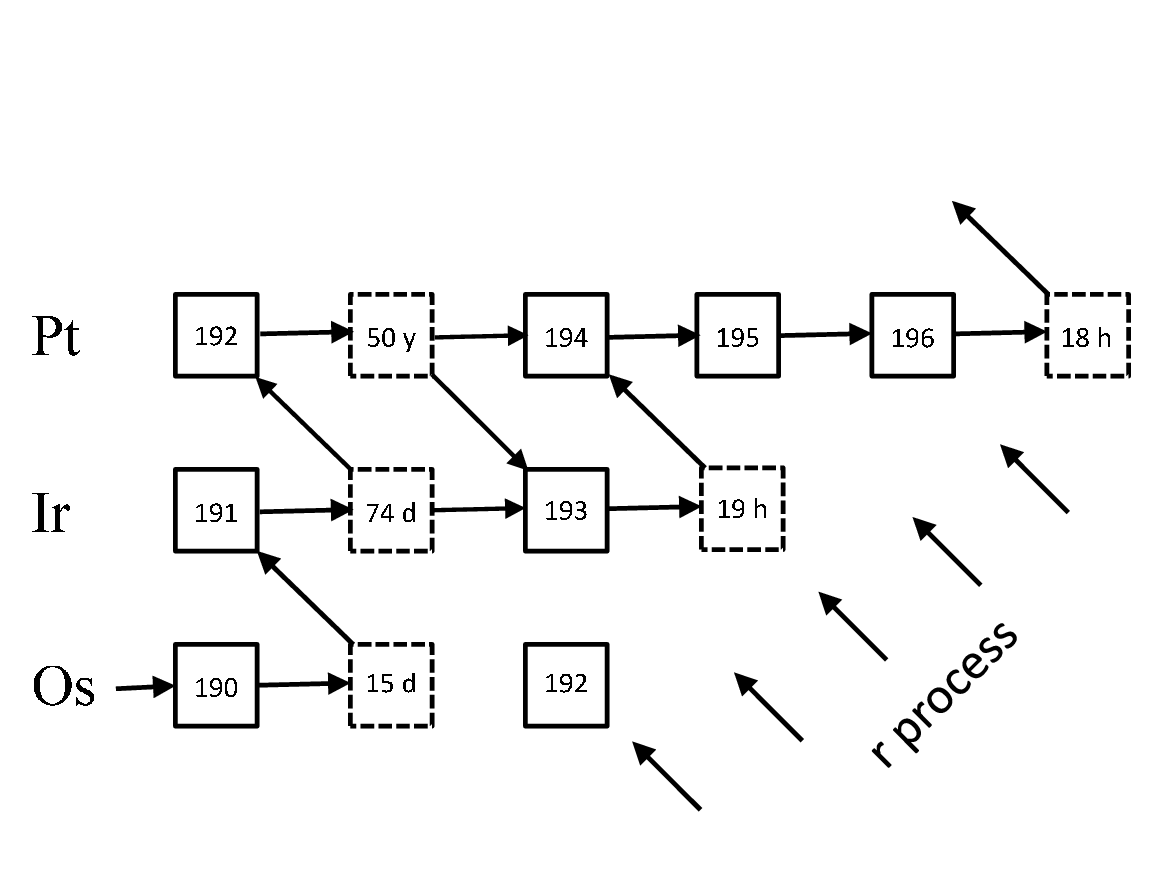
The only previously reported measurement [1] of the 192Pt(,) reaction rate employed an activation technique, so the reaction rate was obtained only at one temperature ( keV) and with a fairly large uncertainty (29%). Activation measurements are hampered by the comparatively long half-life of 193Pt, and by the facts that both the half life and decay intensities for this isotope are fairly uncertain. Theoretical estimates of reaction rates for the Pt isotopes [2, 3, 4, 5, 6], using statistical models, differ by up to a factor of 3. The currently recommended 192Pt(,) rate [7, 8, 9], which is based on a semi-empirical estimate, is a factor of 3 larger than that obtained in the activation measurement.
An experimental determination of the 192Pt(,) reaction rate using a time-of-flight technique has been stymied by the very small (0.79%) natural abundance of this nuclide. The necessary gram-size, high enrichment sample has not been available. However, given improvements made in the neutron capture apparatus at the Oak Ridge Electron Linear Accelerator (ORELA) (e.g. see Ref. [10]), measurements with the available, relatively small (700 mg of Pt), sample of modest enrichment (56.7%) seemed feasible. The small sample size required a fairly long measurement time and the use of the same material for both the neutron capture and transmission measurements (with the shape of the sample refabricated between measurements). The low enrichment required complementary measurements on 194,195,196Pt.
One benefit of having to make all of these measurements is that these data should be very useful for testing and improving the nuclear statistical model, which still must be relied upon to calculate reaction rates for nuclides such as 192Ir that are beyond the reach of current measurement techniques. Hence, we used our new data, together with exisiting 191,193Ir(n,) cross sections [11] to constrain statistical-model parameters and obtain an improved prediction for the 192Ir(n,) rate at s-process temperatures.
II Experiment and data reduction
The experimental apparatus has been described previously many times (e.g., see Ref [12] and references contained therein), so only the salient features will be mentioned herein. The ORELA [13, 14, 15] was operated at a pulse rate of 525 Hz, a pulse width of 8 ns, and a power of 7-8 kW. Neutron energy was determined by time of flight. The samples were isotopically enriched metallic platinum. The isotopic compositions and sample thicknesses are given in Table 1. With the exception of the 192Pt and natural samples, enrichments were greater than 96%.
| Sample | Atomic percent | Sample thickness (10-3 atom/b) | ||||||
|---|---|---|---|---|---|---|---|---|
| 190Pt | 192Pt | 194Pt | 195Pt | 196Pt | 198Pt | Capture | Transmission | |
| 192Pt | 0.5 | 56.97 | 26.16 | 11.23 | 4.70 | 0.90 | 0.463 | 4.53 |
| 194Pt | 0.01 | 0.026 | 96.46 | 2.44 | 0.90 | 0.16 | 1.68 | 23.6 |
| 195Pt | 0.04 | 0.01 | 1.21 | 97.29 | 1.40 | 0.10 | 0.607 | 23.8 |
| 196Pt | 0.01 | 0.04 | 0.67 | 1.69 | 97.25 | 0.28 | 1.71 | 14.4 |
| Natural | 0.01 | 0.79 | 32.9 | 33.8 | 25.3 | 7.20 | - | 7.57 |
Neutron capture measurements were made on flight path 7 at a source-to-sample distance of 40.12 m using a pair of C6D6 detectors, and employed the pulse-height-weighting technique. A 10B filter was used to remove overlap neutrons from preceding beam bursts, and a Pb filter was used to reduce -flash effects. These filters were placed in the beam at a distance of 5 m from the neutron source. Cross section normalization was made via the saturated resonance technique [16] using the 4.9-eV resonance in the 197Au(,) reaction.
A thin 6Li-loaded glass scintillator [17], located 43 cm ahead of the sample in the neutron beam, was used to measure the energy dependence of the neutron flux. Separate sample-out background measurements were made, and measurements with a carbon sample were used to subtract the very small, smoothly varying background caused by sample-scattered neutrons.
Total neutron cross sections were measured via transmission on flight path 1 using a 6Li-loaded glass scintillator at a source-to-detector distance of 79.827 m. The measurements were made at the same time, and hence under the same ORELA operating conditions, as the (n,) experiments. The samples were cylindrical in shape, being between 7.9 to 16.8 mm in diameter. A 10B filter was used to remove overlap neutrons from preceding beam bursts, and a Pb filter was used to reduce -flash effects. These filters were placed in the beam at a distance of 5 m from the neutron source. Separate runs for each sample were made at a pulse rate of 130 Hz to determine the residual background due to overlap neutrons from preceding beam bursts. These runs were made at the same time as the 197Au(,) calibration measurements on flight path 7. The Pt samples were exchanged periodically with an empty sample holder, and with polyethylene and bismuth absorbers, which were used for determination of backgrounds.
-matrix analysis of the resolved resonance region will be described in a forthcoming paper. In the unresolved resonance region, the capture data were averaged over coarse energy bins and the relatively small corrections for multiple scattering and resonance self-shielding were calculated using the code SESH [18]. These data also were corrected for isotopic impurities in the samples using the current measurements.
III Average cross sections and astrophysical reaction rates
Cross sections averaged over coarse energy bins typically used in the calculation of astrophysical reaction rates are shown in Table 2 and Fig. 2. The cross sections in this figure have been multiplied by the square root of the energy at the center of each bin, effectively removing the underlying component, so that data over a wide range of energies for all four isotopes can be shown in the same graph. Open symbols in this figure represent average cross sections calculated directly from numerical integration of the data. Corrections for multiple scattering, self shielding, and isotopic impurities were calculated as described above. Solid symbols in Fig. 2 represent average cross sections calculated from the resonance parameters. Of course, in this case, corrections to the data are calculated on a resonance-by-resonance basis. Uncertainties common to both methods of calculating average cross section (e.g., due to normalization) are not included in this table or figure, and therefore represent one-standard-deviation statistical uncertainties only. The good agreement between average cross sections obtained by the two techniques attests to the accuracy of the background subtraction and corrections we applied to our data. All four data sets show effects of neutron inelastic channels opening up, near 100 keV in 195Pt and 300 keV in 192,194,196Pt.
| Energy Range | Neutron Capture Cross Section (mb) | |||||||
|---|---|---|---|---|---|---|---|---|
| (keV) | 192Pt | 194Pt | 195Pt | 196Pt | ||||
| Numerical | Resonance | Numerical | Resonance | Numerical | Resonance | Numerical | Resonance | |
| Integration | Integration | Integration | Integration | |||||
| 3-5 | ||||||||
| 5-7.5 | ||||||||
| 7.5-10 | ||||||||
| 10-12.5 | ||||||||
| 12.5-15 | ||||||||
| 15-20 | ||||||||
| 20-25 | ||||||||
| 25-30 | ||||||||
| 30-40 | ||||||||
| 40-50 | ||||||||
| 50-60 | ||||||||
| 60-80 | ||||||||
| 80-100 | ||||||||
| 100-120 | ||||||||
| 120-150 | ||||||||
| 150-175 | ||||||||
| 175-200 | ||||||||
| 200-225 | ||||||||
| 225-250 | ||||||||
| 250-300 | ||||||||
| 300-350 | ||||||||
| 350-400 | ||||||||
| 400-450 | ||||||||
| 450-500 | ||||||||

SAMMY was used to calculate astrophysical reaction rates from the resonance parameters together with the averaged cross sections shown in Fig. 2. Resulting Maxwellian-averaged cross sections are given in Table 3. As a check on the SAMMY calculations, reaction rates also were calculated following the technique of Ref. [20]. The two methods agree to within 0.5%. Statistical uncertainties in the reaction rates are negligible when compared to the overall normalization uncertainty. From the uncertainties in the 197Au(n,) and 6Li(n,) cross sections, the statistical precision of the calibration measurements, the repeatability of the calibration runs, and uncertainties in the sample sizes and isotopics, we calculated normalization uncertainties of 3%–4 % in the reaction rates.
| Thermal energy | (mb) | |||
|---|---|---|---|---|
| (keV) | 192Pt | 194Pt | 195Pt | 196Pt |
| 5 | ||||
| 8 | ||||
| 10 | ||||
| 15 | ||||
| 20 | ||||
| 25 | ||||
| 30 | ||||
We know of no measured 192,194,195,196Pt() reaction rates published in peer-reviewed journals. Our preliminary reaction rates reported in Ref. [21] are in agreement with the present rates to within the uncertainties. Although there have been numerous semiempirical and theoretical estimates, we know of only three other actual measurements of reaction rates to which our results can be compared, and only at a single temperature.
A measurement of the 192Pt(n,) Maxwellian-averaged cross section (MACS) at keV, mb, 2.5 times smaller than our measured rate, was reported in Ref. [1]. This measurement was made using a pseudo-Maxwellian neutron source at keV, which was then extrapolated to 30 keV. Activation measurements of the 192Pt(n,) rate are hampered by the relatively long and somewhat uncertain half-life and the low energy of the decay of the product nuclide. Hence, it may not be too surprising that the most recent reaction-rate compilation [7] recommends a semi-empirical estimate ( mb [22]) for this rate over the measurement of Ref. [1]. Note that 192,194,195Pt() reaction rates in the more recent KADoNiS compilation [8, 9] are identical to those in Ref. [7].
There have been two previously reported [22, 23] measurements of the 196Pt() reaction rate, both using the same technique as mentioned in the previous paragraph. Uncertainties in these previous results are about four times larger than ours. The most recent previous result ( mb at keV) [23] agrees with ours to within the quoted uncertainties, whereas the older result ( mb keV) [22] is just outside the combined uncertainties. The currently recommended rate [9] is the weighted average of these two results together with the temperature dependence predicted by the statistical model calculation of Ref. [6].
Our new 192,194,195,196Pt(n,) reaction rates are compared to recommended rates from the most recent compilation [8, 9] in Fig. 3. At s-process temperatures, our rates are far more accurate (uncertainties reduced by factors of 4 to 8) than the previously recommended rates. In general, previously recommended rates are larger (by as much as 35% at s-process temperatures) and have significantly different shapes, as functions of temperature, than our new rates.

IV s-process neutron density and improved 192Ir(n,) reaction rate
Although 192Pt is an s-only isotope, it is partially bypassed during the s process by a branching at 192Ir. Because this branching is expected to be practically independent of temperature and electron density, it is particularly sensitive to the neutron density during the s process. A classical branching analysis [21] using our preliminary reaction rates resulted in a significantly lower neutron density [ cm-3], inconsistent with the density [ cm-3] resulting from analyses [24] of several other branchings. Because our new rates are consistent with our preliminary ones to within the uncertainties, we confirm this result. In contrast, just the opposite conclusion [ cm-3] was reached in Ref. [1], based on a classical branching analysis using the only previous measurement of the 192Pt() reaction rate. The large reduction in extracted neutron density and its uncertainty from our new analysis are directly attributable to the substantially larger 192Pt() reaction rate and substantially reduced uncertainty, respectively, from our new measurements.
The large uncertainty in the above estimate of the neutron density from the 192Ir branching is dominated by the assumed [21] factor of 2 uncertainty in the unmeasured 192Ir() reaction rate. Theoretical rates (which are based on nuclear statistical model calculations) for this reaction listed in the latest compilation [9] vary by a factor of 2.7. In an attempt to obtain an improved rate for this reaction, we have used our new Pt data to constrain parameters in the nuclear statistical model. The code TALYS [19] was used for these calculations.
As shown in Fig. 2, average cross sections predicted by TALYS [19] using default parameters require normalizations ranging from 0.72 to 1.5 to yield reasonable agreement with our data. Also, the predicted cross section is significantly flatter as a function of energy than the measured one for 195Pt(). As shown in Fig. 4, shapes of default TALYS cross sections also are significantly flatter than the 191,193Ir(n,) data of Ref. [11]. There are substantial disagreements among the various 191,193Ir(n,) measurements [25, 26, 11, 27, 28, 29]. We have chosen to use the data of Ref. [11] because they are the only sets to span the energy range needed to determine the reaction rate at s-process temperatures, and because other measurements by the same group with the same apparatus have shown, in general, to be reliable.

There are several model paramenters which can be constrained by measured average resonance parameters. To this end, we report in Table 4 , , and values resulting from -matrix analysis of the resolved resonance region. Because TALYS assumes that the Porter-Thomas distribution (PTD) [31] is valid (e.g., in calculating width fluctuation correction factors), and values in Table 4 were corrected for the effects of missed resonances using the technique of Ref. [32] and assuming the PTD. The values in Tabe 4 were determined from a maximum-likelihood analysis by assuming these widths were distributed. The corresponding uncertainties are one-standard-deviation estimates from the maximum-likelihood analysis. For 195Pt, separate values were determined for definite 0- and 1- resonance assignments.
| Nuclide | (eV) | (meV) | |
|---|---|---|---|
| 192Pt | 28.4 | 2.06 | 62.40 |
| 194Pt | 71.8 | 2.01 | 76.7 |
| 195Pt | 15.93 | 1.94 | 109.9 (0-), 127.3 (1-) |
| 196Pt | 192 | 1.95 | 85.9 |
To obtain an improved 192Ir() rate, first, we adjusted the level density (at the neutron separation energy) parameter () to obtain agreement with the measured values for 192,194,195,196Pt (Table 4) and 191,192,193Ir [30]. The resulting () and values are listed in Table 5, from which it can be seen that the latter agree with the measured values in Table 4 to within the uncertainties.
Next, we used the “gamgam” option in TALYS to input the measured values (Table 4 and Ref. [30]). These quantities, togeher with the values, are used to normalize the -ray transmission coefficients in TALYS.
Next, we adjusted parameters of the neutron optical model potential (NOMP) to obtain agreement with the measured values (Table 4 and Ref. [30]). The data for 192,194,195,196Pt and 191,193Ir indicate that to about 10% or better accuracy. Therefore, we used this value for 192Ir, which is consistent with the much less certain value given in Ref. [30] (). This step was particularly important for obtaining the correct energy dependence of the cross sections for 195Pt and 191,193Ir, but did not have much effect for 192,194,196Pt. In particular, a ratio was required for the former cases to obtain agreement with the cross-section shape versus energy. Sensitivity of the 195Pt and 191,193Ir() cross section shape to the neutron strength functions appears to be a consequence of the smaller average level spacings for these nuclides compared to 192,194,196Pt.
Default values in TALYS were about 70% of the measured ones. We could obtain both and by adjusting both the and parameters in TALYS. Default and adjusted values of varied TALYS parameters are given in Table 5.
| Nuclide | Default | Adjusted | ||||||||||||
| () (MeV-1)11 1 Default TALYS level-density is model 1, constant temperature plus Fermi gas [33]. | (eV) | () (MeV-1) | (eV) | 22 2 Numbers in these columns are factors by which default TALYS parameters were multiplied. | 22 2 Numbers in these columns are factors by which default TALYS parameters were multiplied. | |||||||||
| LD133 3 LD1 = TALYS level-density model 1, etc. | LD233 3 LD1 = TALYS level-density model 1, etc. | LD333 3 LD1 = TALYS level-density model 1, etc. | LD133 3 LD1 = TALYS level-density model 1, etc. | LD233 3 LD1 = TALYS level-density model 1, etc. | LD333 3 LD1 = TALYS level-density model 1, etc. | |||||||||
| 191Ir | 23.04 | 2.49 | 1.52 | 0.40 | 23.40 | 20.50 | 21.50 | 2.05 | 2.00 | 2.12 | 0.82 | 0.60 | 2.05 | 0.11 |
| 192Ir | 22.22 | 0.67 | 1.47 | 0.40 | 22.65 | 20.20 | 21.05 | 0.52 | 0.39 | 0.47 | 0.82 | 0.60 | 1.96 | 0.11 |
| 193Ir | 21.41 | 7.01 | 1.43 | 0.40 | 21.90 | 19.90 | 20.60 | 5.35 | 5.26 | 5.65 | 0.80 | 0.60 | 2.04 | 0.10 |
| 192Pt | 24.00 | 21.97 | 1.38 | 0.42 | 23.49 | 19.69 | 21.01 | 28.39 | 28.44 | 28.47 | 0.80 | 0.68 | 2.04 | 0.13 |
| 194Pt | 19.83 | 201.10 | 1.26 | 0.57 | 21.95 | 17.69 | 18.43 | 71.70 | 71.96 | 71.66 | 0.74 | 0.75 | 2.02 | 0.19 |
| 195Pt | 20.38 | 17.99 | 1.26 | 0.42 | 20.60 | 17.97 | 18.38 | 15.87 | 15.89 | 15.91 | 0.78 | 0.75 | 2.03 | 0.15 |
| 196Pt | 19.37 | 350.11 | 1.23 | 0.41 | 20.62 | 17.07 | 17.30 | 192.28 | 191.91 | 192.06 | 0.78 | 0.76 | 1.96 | 0.16 |
As shown in Figs. 2 and 4, adjusted TALYS cross sections are in good agreement with the 192,194,195,196Pt data, but they are about 15%–25 % larger than the 191,193Ir data, indicating that the average resonance parameters in Ref. [30] are inconsistent with the average cross section data of Ref. [11]. Therefore, it seems unlikely that the 192Ir() reaction rate calculated using average resonance parameters from Ref. [30] will be reliable.
Of the three needed paramenters (, , and ), is likely the most problematical, especially given that there are relatively few known resonances for the Ir isotopes and because the recommended values in Ref. [30] appear to have undergone significant corrections for missed resonances. In constrast, and typically are much less sensitve to such effects, and the recommended values for the Ir isotopes for these two parameters are in line with expectations based on our Pt data. Therefore, constraining for 192Ir seems to be key for obtaining more reliable predictions of the 192Ir() reaction rate.
As noted above, and are used to normalize -ray transmission coefficients in TALYS. The equation used is,
| (1) |
where the and sums are over compound nucleus states with spin and parity that can be formed by s-wave incident neutrons, and and denote the spin and parity of the final states that may be reached in the first step of the -ray cascade. The -ray transmission coefficient for type (electric or magnetic) and multipolarity for -ray energy is denoted by , the level density at excitation energy is denoted by , and denotes the usual multipole selection rules. It is understood that the integral over includes a summation over discrete states at lower excitation energies. The -ray transmission coefficient is related to the -ray strength function via
| (2) |
Finally, is a normalization factor that ensure the equality of Eq. 1, and hence in practice the -ray strength functions are muliplied by this factor before they enter the nuclear reaction calculation in TALYS. Hence, it is possible to fit TALYS to a measured () cross section by varying [by adjusting the level-density parameter ()]. Futhermore, the () values, adjusted to yield our values for Pt (Table 5), are reasonably well fitted by a straight line as a function of mass number. Therefore, it seems likely that a reasonably reliable for 192Ir could be obtained by using the average () value for 191,193Ir, after they had been adjusted to yield agreement with the capture cross sections.
For these reasons, we used TALYS to fit the measured 191,193Ir() cross sections by adjusting the appropriate () value and used the average of the two () values to predict the 192Ir() cross section and reaction rate. We did this for all three level-density models in TALYS which allow () to be adjusted, and the values are given in Table 5. The resulting values are about 2.0, 0.46, and 5.4 eV for 191,192,193Ir, respectively. These adjusted 191,193Ir values are intermediate to default TALYS values and those in the compilation of Ref. [30], whereas the adjusted values for 192Ir are all smaller than the default and compilation ones.
The three 192Ir() cross sections calculated as described above agree to within 10%. Due to the normaliztion through Eq. 1, all four -ray strength function models yielded very similar predictions for a given level-density model. To further assess the uncertainty due to the level density, we varied () for each model by the average amount that our Pt () values (as functions of mass number, for each level-density model) deviated from linearity. This increased the maximum deviation of the various predicted 192Ir() cross sections to 11.6%. Our recommended rate is the average of the largest and smallest rates predicted by TALYS following the above procedure, with base uncertainty calculated from the range of predictions. Additional uncertainties in this rate can arise from normalization [via Eq. 1] to the measured average radiation width for 192Ir [30], which can contribute a maximum uncertainty of 6%, and normalizations to the 191,193Ir() cross sections, which can add another 5% [7]. Therefore, we calculate that the overall uncertainty in the predicted 192Ir() reaction rate is about 22%. Our recommended MACS values for this reaction are given in Table 6.
| (keV) | MACS (mb) |
|---|---|
| 5 | |
| 10 | |
| 15 | |
| 20 | |
| 25 | |
| 30 | |
| 40 |
In stellar models of the main s-process, most of the neutron exposure occurs at temperatures near keV followed by a smaller exposure at about 23 keV. At these two temperatures, our recommended 192Ir() MACS values are 2.1 and 1.6, respectively, times larger than the rate [7] used in most previous s-process calculations. The larger 192Ir() MACS values we recommend would result in 192Pt being more strongly bypassed during the s process. On the other hand, our new 192Pt() MACS value is smaller than the previously recommended rate [7], and this should result in less destruction of 192Pt during the s process. New, realistic s-process calculations are needed to ascertain the net effect.
The previously recommended 192Ir() rate is based on calculations made with the statistical model code NON-SMOKER [34, 6], which had been normalized to data for nearby nuclides. The fact that the NON-SMOKER rate has a flatter temperature dependence suggests, based on our experience with TALYS as discussed above, that neutron strength functions (via the NOMP) in NON-SMOKER need to be adjusted. This surmise is strengthened by the facts that NON-SMOKER predictions for the 195Pt and 191,193Ir() cross sections also are flatter, as functions of energy, than the data, whereas predictions for 192,194,196Pt are in better agreement with the data in this respect. Current consesus seems to be that () cross sections are rather insensitive to the adopted NOMP (e.g., see Ref. [35] for a recent example). However, as we have demonstrated above, there are important exceptions. Therefore, it may be worthwhile to reexamine the sensitivity of theoretical rates to the NOMP, especially for nuclides predicted to have small average level spacings.
V Constraints on photon-strength-function models
Comparison of our 192,194,195,196Pt() data to TALYS calculations such as those described in the last section can help constrain -ray-strength-function models through the factor in Eq. 1; indicates that the -ray strength function (below ) is too small, and vice versa. However, the level-density model also enters this equation. Therefore, we calculated the average for 12 calculations, run for the four Pt isotopes with the three level-density models (which can be adjusted to measured values as described above), for each of the four -ray-strength-function models in TALYS. The resulting average values are 1.500.80, 0.390.20, 1.610.70, and 1.080.46 for models 1–4, respectively, where listed uncertainties are standard deviations of the distributions. These results indicate that model 4 (Hartree-Fock-Bogolyubov [36]) yields results closest to the data, with nearly equal distribution of values below (7/12) and above (5/12) 1.0. Model 2 (Brink-Axel Lorentzian [37, 38]) gave the worst results, with all 12 values substantially smaller than 1.0, indicating that this -ray-strength-function model is consistently too large. Models 1 (Kopecky-Uhl generalized Lorentzian [39]) and 3 (Hartree-Fock BCS [36]) gave intermediate results with both having values larger than 1.0 (-ray-strength function too small) for 3/4 of the cases. Level-density models 1 (constant temperature plus Fermi gas [33]) and 2 (back-shifted Fermi gas [40]) consistently gave the largest and smallest, respectively values.
VI Conclusions
Our new 192,194,195,196Pt() and total cross section data respresent very large improvements over previous work. Astrophysical () reaction rates calculated from our data are substantially different from, and much more accurate than, currently recommended rates. We recommend a substantially larger 192Ir() reaction rate with steeper energy dependence, based in large part on calibration to local systematics deduced from our new Pt data. In addition, statistical-model calculations undertaken to assist this effort indicate that neutron strength functions may be more important for accurately predicting reaction rates for unmeasured nuclides than is routinely assumed.
Acknowledgements.
This work was supported by the Research Council of Norway and by the Office of Nuclear Physics of the U.S. Department of Energy under Contract No. DE-AC05-00OR22725 with UT-Battelle, LLC.References
- [1] D. Neuberger, M. Tepe, and F. Käppeler, in Nuclear Data for Science and Technology, edited by S. M. Qaim (Springer-Verlag, Berlin, 1992), p. 641.
- [2] M. J. Harris, Astrophys. and Space Sci. 77, 357 (1981).
- [3] J. A. Holmes, S. E. Woosley, W. A. Fowler, and B. A. Zimmerman, At. Data Nucl. Data Tables 18, 305 (1976).
- [4] T. Rauscher, in Nuclear Astrophysics, edited by M. Buballa, W. Norenberg, and J. Wambach (Gesellschaft Schwerionenforschung, Darmstadt, 1998), p. 288.
- [5] S. Goriely, in Nuclei in the Cosmos, edited by N. Prantzos and S. Harissopulos (Editions Frontieres, Paris, 1998), p. 314.
- [6] T. Rauscher and F. K. Thielemann, Atomic Data Nucl. Data Tables 75, 1 (2000), http://nucastro.org/nonsmoker.html.
- [7] Z. Y. Bao, H. Beer, F. Käppeler, F. Voss, K. Wisshak, and T. Rauscher, Atomic Data and Nucl. Data Tables 75, 1 (2000).
- [8] I. Dillmann, M. Heil, F. Käppeler, R. Plag, T. Rauscher, and F.-K. Thielemann, in Capture Gamma-Ray Spectroscopy and Related Topics: 12th International Symposium, edited by A. Woehr and A. Aprahamian (American institute of Physics, Melville, NY, 2006), p. 123.
- [9] I. Dillmann, R. Plag, F. Käppeler, and T. Rauscher, in EFNUDAT Fast Neutrons - Scientific Workshop on Neutron Measurements, Theory, and Applications, edited by F.-J. Hambsch (European Union, Belgium, 2010), p. 55.
- [10] P. E. Koehler, R. R. Winters, K. H. Guber, T. Rauscher, J. A. Harvey, S. Raman, R. R. Spencer, J. C. Blackmon, D. C. Larson, D. W. Bardayan, and T. A. Lewis, Phys. Rev. C 62, 055803 (2000).
- [11] R. L. Macklin, D. M. Drake, and J. J. Malanify, Technical Report No. LA-7479-MS, Los Alamos Scientific Laboratory 1978 (unpublished).
- [12] P. E. Koehler, Y. M. Gledenov, J. Andrzejewski, K. H. Guber, S. Raman, and T. Rauscher, Nucl. Phys. A688, 86c (2001).
- [13] R. W. Peelle, J. A. Harvey, F. C. Maienschein, L. W. Weston, D. K. Olsen, D. C. Larson, and R. L. Macklin, Technical Report No. ORNL/TM-8225, Oak Ridge National Laboratory 1982 (unpublished).
- [14] K. H. Böckhoff, A. D. Carlson, O. A. Wasson, J. A. Harvey, and D. C. Larson, Nucl. Sci. and Eng. 106, 192 (1990).
- [15] K. H. Guber, D. C. Larson, P. E. Koehler, R. R. Spencer, S. Raman, J. A. Harvey, N. W. Hill, T. A. Lewis, and R. R. Winters, in International Conference on Nuclear Data for Science and Technology, edited by G. Reffo, A.Ventura, and C. Grandi (Societa Italiana di Fisica, Bologna, 1997), p. 559.
- [16] R. L. Macklin, J. Halperin, and R. R. Winters, Nucl. Instrum. and Meth. 164, 213 (1979).
- [17] R. L. Macklin, N. W. Hill, and B. J. Allen, Nucl. Instr. and Meth. 96, 509 (1971).
- [18] F. H. Fröhner, Technical Report No. GA-8380, Gulf General Atomic, Inc., 1968 (unpublished).
- [19] A. J. Koning, S. Hilaire, and M. C. Duijvestijn, in Proceedings of the International Conference on Nuclear Data for Science and Technology - ND2007, edited by O. Bersillon, F. Gunsing, E. Bauge, R. Jacqmin, and S. Leray (EDP Sciences, Les Ulis, France, 2008), p. 211.
- [20] H. Beer, F. Voss, and R. R. Winters, Astrophys. J. Suppl. 80, 403 (1992).
- [21] P. E. Koehler, J. A. Harvey, K. H. Guber, R. R. Winters, and S. Raman, Journal of Nuclear Science and Technology Supplement 2, 546 (2002).
- [22] H. Beer, P. Mohr, H. Oberhummer, P. Mutti, F. Corvi, P. V. Sedyshev, and Y. P. Popov, in Interaction of Neutrons with Nuclei, edited by W. Furman (Joint Institute for Nuclear Research, Moscow, 1997), p. 229.
- [23] J. Marganiec, Ph.D. thesis, University of Lodz, 2008.
- [24] K. A. Toukan, K. Debus, and F. Käppeler, Phys. Rev. C 51, 1540 (1995).
- [25] A. G. Dovbenko, V. E. Kolesov, V. P. Koroleva, and V. A. Tolstikov, Atomnaja Energija 23, 151 (1967), english translation in: Soviet Atomic Energy 27, 1185 (1969).
- [26] M. Lindner, R. J. Nagle, and J. H. Landrum, Nuclear Science and Engineering 59, 381 (1976).
- [27] P. E. Koehler and F. Käppeler, in International Conference on Nuclear Data for Science and Technology, edited by J. K. Dickens (American Nuclear Society, La Grange Park, Illinois, 1994), p. 179.
- [28] S. Jaag, Nucl. Phys. A 621, 251c (1997).
- [29] V. H. Tan, T. T. Anh, N. C. Hai, P. N. Son, and T. Fukahori, Conference Report 2008,006, (unpublished), jAEA Conference proceedings.
- [30] S. F. Mughabghab, Atlas of Neutron Resonances: Resonance Parameters and Thermal Cross Sections Z=1-100 (Elsevier, Amsterdam, The Netherlands, 2006).
- [31] C. E. Porter and R. G. Thomas, Phys. Rev. 104, 483 (1956).
- [32] T. Fuketa and J. A. Harvey, Nucl. Instrum. Methods 33, 107 (1965).
- [33] A. Gilbert and A. G. W. Cameron, Can. J. Phys. 43, 1446 (1965).
- [34] T. Rauscher and F.-K. Thielemann, in Stellar Evolution, Stellar Explosions, and Galactic Chemcal Evolution, edited by A. Mezzacappa (Institute of Physics, Bristol, 1998), p. 519.
- [35] H. Utsunomiya, S. Goriely, H. Akimune, H. Harad, F. Kitatani, S. Goko, H. Toyokawa, K. Yamada, T. Kondo, O. Itoh, M. Kamata, T. Yamagata, Y.-W. Lui, I. Daoutidis, D. P. Arteaga, S. Hilaire, and A. J. Koning, Phys. Rev. C 82, 064610 (2010).
- [36] E. Khan, S. Goriely, D. Allard, E. Parizot, T. Suomijarvi, A. J. Koning, S. Hilaire, and M. C. Duijvestijn, Astropharticle Physics 23, 191 (2005).
- [37] D. M. Brink, Nucl. Phys. 4, 215 (1957).
- [38] P. Axel, Phys. Rev. 126, 671 (1962).
- [39] J. Kopecky and M. Uhl, Phys. Rev. C 41, 1941 (1990).
- [40] W. Dilg, W. Schantl, H. Vonach, and M. Uhl, Nucl. Phys. A217, 269 (1973).