Inner Disc Obscuration in GRS 1915+105 Based on Relativistic Slim Disc Model
Abstract
We study the observational signatures of the relativistic slim disc of black hole, in a wide range of mass accretion rate, , dimensionless spin parameter, , and viewing angle, . In general, the innermost temperature, increases with the increase of for a fixed value of and , due to the Doppler effect. However, for and , starts to decrease with the increase of . This is a result of self-obscuration — the radiation from the innermost hot part of the disc is blocked by the surrounding cooler part. The value of and the corresponding luminosities depend on and . Such obscuration effects cause an interesting behavior on the disc luminosity () – plane for high inclinations. In addition to the standard-disc branch which appears below and which obeys -relation, another branch above , which is nearly horizontal, may be observed at luminosities close to the Eddington luminosity. We show that these features are likely observed in a Galactic X-ray source, GRS 1915+105. We support a high spin parameter () for GRS 1915+105 since otherwise the high value of and small size of the emitting region () cannot be explained.
Keywords:
accretion, accretion disc – black hole physics: stars: individual: GRS 1915+105 – X-rays: binaries.1 Introduction
Extensive studies of Galactic black hole binaries (BHBs) have shown that the spectral transitions can be related to the mass accretion rate (e.g. Done, Gierliński & Kubota 2007, Gilvanof 2010). When the thermal component (disc blackbody) dominates the spectrum and the luminosity is moderate the disc is optically thick and geometrically thin. In such a case, the accreting gas rotates with Keplerian velocity and eventually reaches the innermost stable circular orbit (ISCO) from where it rapidly falls towards the black hole. In this case, ISCO may be identified with the radiation inner edge (Abramowicz et al., 2010), since the radiation emitted from inside the ISCO is negligible (Kulkarni et al., 2011). Note, however, that Noble et al. (2011) found that by using general relativistic magnetohydrodynamic simulation of accretion on to black holes, significant emissivity can be expected inside ISCO radius. In terms of the Eddington luminosity, , such spectral state is commonly found within luminosity range of 0.1 – 0.3 11 1 See, however, Remillard & McClintock (2006) in which they do not associate the spectral states with luminosity.. In this thermal state (sometimes referred to as the high/soft state), the accretion flow can be described by the so-called standard disc model (Shakura & Sunyaev, 1973). The relativistic version of this model was derived by Novikov & Thorne (1973).
Using the standard disc model it is possible to derive the black hole spin, disc luminosity and inclination from X-ray continuum fitting. The black hole spin is generally estimated assuming that the disc inner edge is at ISCO (see Shafee et al. 2006, and references therein). Such an approach led to measurements of a wide range of black hole spins, – (McClintock et al., 2010), which urges the need for theoretical models in which the black hole spin is fully taken into account. However, caution should be taken when one considers black hole systems at the luminosity close to the Eddington since the accretion disc is no longer properly described by the standard disc theory.
As the mass accretion rate increases, the radiation pressure dominates over the gas pressure and the cooling is provided by both vertical radiative flux and horizontal advection (Abramowicz et al., 1988). As a result, disc cannot maintain its thin geometry (becomes thicker or slim) and the inner edge of the disc goes closer to the black hole. The disc becomes less radiatively efficient since the produced heat is not totally emitted locally but some fraction of it is advected inward and emitted at smaller radii or swallowed by the black hole. Therefore, radiation from inside the ISCO may be not negligible and ISCO is no longer the radiation inner edge (e.g. Watarai & Mineshige 2003). To study such a flow, Abramowicz et al. (1988) proposed ’Slim Disc’ model which contains solutions corresponding to near-Eddington and moderately super-Eddington accretion rates, , where is the Eddington mass accretion rate defined as
| (1) |
where
| (2) |
is the Eddington luminosity. That is,
| (3) |
For a non-rotating black hole, approximately corresponds to the Eddington luminosity. Hereafter, .
To date, slim disc model has been studied by many authors. Watarai et al. (2000) discuss the slim disc model and its application to Galactic BHBs. Flatter spectrum in the soft-X band as a result of flatter effective temperature profile, , becomes the main feature that distinguishes slim disc from that of the standard disc. Watarai, Mizuno & Mineshige (2001a) study the application of slim disc model for ultraluminous X-ray sources (ULXs). This is an interesting study since the application of slim disc model for ULXs challenges the idea of intermediate mass black hole (IMBH) for ULXs. Kawaguchi (2003) investigates the application of slim disc model for narrow-line Seyfert 1 galaxy (NLS1) PG 1448+273 (see also Szuszkiewicz, Malkan & Abramowicz 1996; Wang & Zhou 1999; Mineshige et al. 2000; Haba et al. 2008). These studies, however, do not adopt a full-relativistic formalism, but instead adopt the pseudo-Newtonian potential, (Paczyńsky & Wiita, 1980), where is the Schwarzschild radius. In addition, they only consider a non-rotating (Schwarzschild) black hole case. The relativistic effects are included in the spectrum calculation at best.
The observational evidence of the slim disc state elevates the recognition for the slim disc model. Kubota & Makishima (2004) show that the slim disc state was observed in XTE J1550–564 data during the high/soft state when the luminosity exceeds the critical luminosity. In present days, slim disc model has been widely used to fit the spectra of many luminous X-ray sources. The small inner radius ( ISCO) and the flat temperature profile obtained from the fitting are commonly claimed as the slim disc evidences (e.g. Tsunoda et al. 2006; Okajima, Ebisawa & Kawaguchi 2006). However, unlike the standard model, in which the radiation edge coincides with the ISCO, the black hole spin estimate from the spectral fitting is not straightforward.
Sa̧dowski (2011) revisited the study of slim disc around Kerr black holes. They focused on the parameters which are applicable to stellar mass BHBs. More importantly, fully relativistic slim disc model provides a tool to study the signatures of black hole spin in the spectra. In Sa̧dowski (2011), however, the effect of wind-mass loss is not taken into account. At high mass accretion rate, wind-mass loss becomes important, due to significant radiation pressure (Takeuchi, Mineshige & Ohsuga 2009). However, as Takeuchi et al. (2009) have shown, the temperature and scale height radial profiles of the slim disc are hardly affected by non-constant profile of mass accretion rate. In the present study, we try to bridge the gap between theory and observations by fitting the relativistic slim disc spectra with the extended disc blackbody (extended DBB) model (also known as -free model; Mineshige et al. 1994).
Unlike mass, black hole spin is much more difficult to measure since it only affects the region very close to the event horizon and thus much less observable from a large distance. Nevertheless, there have been several attempts to measure the black hole spin by using the X-ray spectral fitting (see McClintock et al. 2010, and references there in). The disc spectra in these studies, however, are assumed to be in the standard thermal state which can not be suitable for high mass accretion rate systems. For this reason, McClintock et al. (2006), carefully selected data with luminosity below 30% of the Eddington luminosity. To overcome this limitation, fitting with relativistic slim disc model will be important.
To understand the observed properties of black hole accretion flows shining at around the Eddington luminosity, we fit the synthetic spectra of high mass accretion rate discs based on the fully relativistic slim disc model with the extended DBB fitting model. Assuming that the relativistic slim disc model is a better representation of the realistic situations, we aim (1) to give a new methodology to evaluate black hole spins from the X-ray spectral fitting of the luminous objects whose luminosity exceed , and (2) to give reasonable interpretation to the peculiar behavior of GRS 1915+105 in the – diagram (Vierdayanti, Mineshige & Ueda 2010).
The plan of this paper is as follows: We will review the relativistic slim disc model (Sa̧dowski, 2011) and the spectrum calculations in section 2. In section 3, we investigate the effects of the mass accretion rate, black hole spin and viewing angle on the extended DBB model parameters. We present the comparison of our study with the observations of GRS 1915+105 in section 4. In section 5, we discuss some remaining issues from our study, such as the interpretation of , the disc geometry and the black hole spin. We conclude the paper in section 6.


2 The Relativistic Slim Disc Properties and the Spectral Features
Slim disc model was introduced in the late 1980s by the Warsaw and the Kyoto groups (Abramowicz et al. 1988; Abramowicz, Kato & Matsumoto 1989; see Kato, Fukue & Mineshige 2008 chapter 10 for a review). Slim discs are astrophysically important since they can be applied to accretion flows with (Abramowicz et al., 1989). This range of accretion rate has been observed in some Galactic and extra-Galactic X-ray sources.
In this work we use the slim disc solutions around Kerr black hole obtained by Sa̧dowski (2011), hereafter S11. We will only review the main results of this work while the details can be found in the paper.
2.1 Relativistic slim disc properties
When the luminosity approaches or moderately exceeds the Eddington luminosity (equation (1)), the generated energy can no longer be totally emitted locally due to photon trapping. Some fraction of the generated photons are trapped by the gas and advected inward due to high (scattering) optical depth. The slim disc solutions deviate from that of the standard disc when advection becomes important. Fig. 4.11 of S11 shows the increase of heat advected with the increase of mass accretion rate. Some part of the advected heat will go too close to the black hole and cannot escape. Some other part will be emitted in the smaller radii so that it will amplify the local emission by the viscous process. As shown in fig. 4.2 of S11, the peak in the radial profiles of the flux for the higher mass accretion rates is shifted to the smaller radii. In the case of highly spinning black hole, the shift is particularly less visible due to the common shift caused by the decreasing radius of the ISCO with the increasing spin parameter.
The ratio, where is the disc scale height and is the disc radii, and the central temperature profiles are consistent with previous studies (see fig. 4.5 of S11). As the mass accretion rate increases, the radiation pressure dominated region is formed in the inner region of the disc which results in an increase of the ratio. The increase of the ratio produces significant effects on the spectra which will be described in the next subsection. The temperature of the gas pressure dominated region increases more rapidly with decreasing radius than that in the radiation pressure dominated region. That is, the radial profiles of the temperature at the inner region become flatter as mass accretion rate increases.
For moderately high accretion rates, i.e. the case of optically thick and geometrically thin disc, the energy conversion efficiency is constant (does not depend on the accretion rate), since the luminosity increases proportionally with . When the accretion rate increases, the inner edge of the disc leaves the ISCO and moves inward. In addition, photon trapping effect becomes important that suppresses the photons from being emitted from the surface of the disc. Therefore, the luminosity is not proportional to . Instead, it grows slower than (S11 and references therein).
2.2 The observed spectra of relativistic slim disc model
In the previous studies (e.g. Watarai et al. 2000, 2001a, 2001b, hereafter W00–01), where the pseudo-Newtonian potential was adopted and the Schwarzschild (non-rotating) black hole was assumed, the slim disc model was found to exhibit several important signatures: the spectra are multicolor blackbody characterized by a high maximum temperature ( a few keV), a small emitting region (), and flatter spectra in the soft X-ray band due to a flatter effective temperature profile.
The slim disc model used in our study is constructed in the Kerr space-time metric and the spectra include all special and general relativistic effects (Bursa, 2006). The ray-tracing method is used to calculate the emission from the proper effective photosphere to an observer at infinity. The deviation of the observed spectra from a pure multi-color blackbody, due to the change in the disc opacity, is taken care by a spectral hardening factor, , which is the ratio between the color temperature and effective temperature.
Fig. 1 shows the temperature profile (left panel) and spectra (right panel) of relativistic slim disc in 5 different mass accretion rates, for the case of (dash-triple-dot lines) and (solid lines). Colors represent the mass accretion rate and will be used again in Fig. 5 & 7. Black, green, magenta, blue, and red denote , 32, 100, 320, and 1000, respectively. In agreement with previous studies, as mass accretion rate increases, temperature profile becomes flatter. Flatter temperature profile produces flatter spectrum in the soft energy band. The total flux increases as increases for both non-rotating and rapidly rotating black hole case. The spectra for differ significantly from those of at X-ray energy range, especially at keV, when . The difference becomes less noticeable as increases. In general, the spectrum becomes harder as the spin parameter increases.
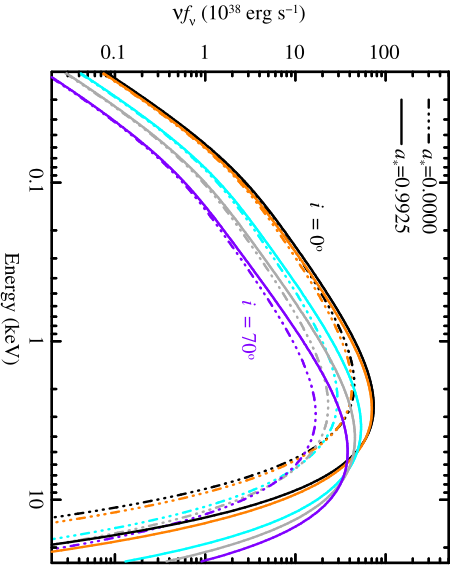
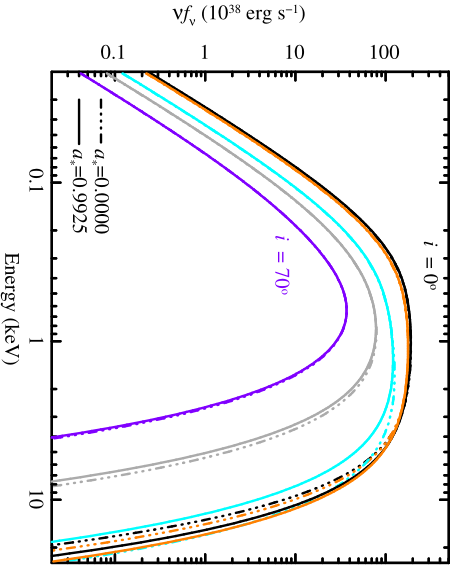
Fig. 2 shows the spectra of various viewing angles , 20, 50, 60 and for (left) and for (right). Similar to Fig. 1, the dash-triple-dot and solid lines correspond to and , respectively. Colors represent different and will also be used in Fig. 3, 4 & 6. Black, orange, cyan, light gray, and purple represent , 20, 50, 60, & , respectively.
As shown in Fig. 2, for (left panel), the spectrum becomes harder and the total flux decreases, as increases. In the case of (right panel), for , the spectrum becomes harder and the total flux decreases, similar to the case. However, at a certain point (), the spectrum becomes softer as increases further, in opposite to the face-on case. The total flux, on the other hand, decreases significantly.


3 Observable Signatures of the Relativistic Slim Disc
We fit the synthetic spectra of the relativistic slim disc model with the extended disc blackbody (extended DBB) fitting model, the so-called –free model (Mineshige et al., 1994), at 3 – 20 keV range. The parameters of the spectrum model used in our study are the black hole mass (), mass accretion rate (), dimensionless spin parameter (), and viewing angle ( – ). Hereafter, we will write instead of , for the case of non-rotating black hole, throughout the text (except in figures and tables) for the readers’ convenience.
The extended disc blackbody has three fitting parameters: , , and which are the maximum temperature of the disc, the radius where , and the temperature gradient, respectively. In our present study we put most interest in the radius which defines the size of the emitting region, denoted as , which is most useful for comparison with observations. We calculate using disc luminosity and disc effective temperature, . The disc luminosity is calculated from the theoretical spectrum within 3 – 20 keV energy range. The effective temperature is calculated from the maximum disc temperature, , with being a fixed spectral hardening factor. We use , as used in the model calculation. In addition to , relativistic correction factor is included when calculating , implying that the maximum temperature occurs at somewhat larger radius (Kubota et al., 1998). Thus, the formula to calculate can be written as
| (4) |
Note, however, that is derived from analytical Newtonian non-transonic solution. Lower value of is obtained from pseudo-Newtonian transonic solution (e.g. Vierdayanti, Watarai & Mineshige 2008). Therefore, in here should be regarded as an upper limit. We present our fitting results in Fig. 3 & 6 and Tables 1 – 4.
3.1 The dependence on mass accretion rate
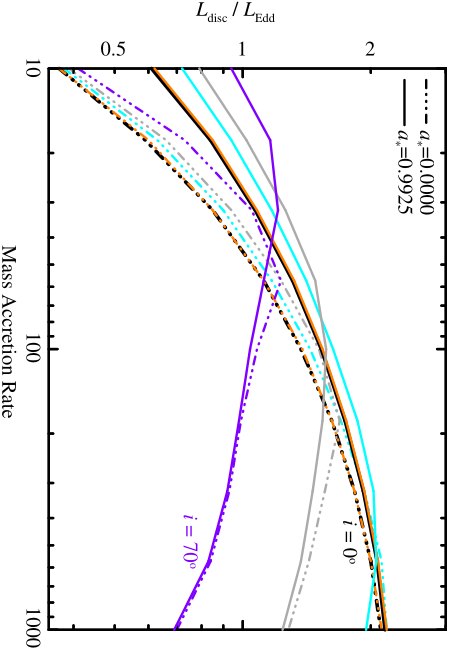
The dependence of the fitting results on mass accretion rate are shown in Tables 1 – 4 and Fig. 3, for two viewing angles, (upper) & (lower). For other viewing angles see Section 3.3. In Fig. 3, the vertical axes show , (keV), and (), in top, middle and bottom panels, respectively. The horizontal axis shows disc luminosity and mass accretion rate in left and right panels, respectively. Hereafter, the solid, dash-dot, dash, dash-triple-dot lines represent , respectively, unless stated otherwise. The stars, in the lower left figure, mark the values for the lowest mass accretion rate, .
3.1.1 Face-on case
We will first discuss the fitting results of face-on case. For a fixed value of , the effective temperature gradient, , decreases as the mass accretion rate increases. That is, the effective temperature profile becomes flatter as increases, as normally expected when the advective cooling becomes important.
As increases, for a fixed value of , the value of increases slowly and tend to saturate when is greater than 100. The saturation is caused by energy advection (photon trapping). Due to energy advection, emergent flux profile in the inner parts is no longer dependent on (see the upper right part of the spectra at high in the right panel of Fig. 1). In addition, the saturation can also be interpreted as an evidence that the disc has reached the smallest disc radius, , from which a maximum possible value of flux can be emitted. This smallest radius is not necessary the inner edge of the disc whose estimation is not trivial. Also, it may differ from , the size of the emitting region. The radii at which are presented in Table 1 – 4 (last columns) for different values of and .
We find that the size of the emitting region, , increases with . Both and increase as increases. However, increases much slower than which causes to increase (since ). As can be seen in Fig. 3 (upper right figure, middle panel), the temperature value starts to saturate at . However, Fig. 4 (black lines) shows that the values of continue to increase as increases. The increase of is not always proportional to that of . Instead, it grows slower than due to advective cooling.
| (keV) | () | () | ||||
|---|---|---|---|---|---|---|
| 0.0000 | 10 | 0.730 | 0.87 | 3.50 | 0.37 | 4.64 |
| 18 | 0.639 | 1.01 | 3.24 | 0.59 | 3.65 | |
| 32 | 0.599 | 1.10 | 3.30 | 0.85 | 3.31 | |
| 57 | 0.572 | 1.15 | 3.45 | 1.12 | 3.14 | |
| 100 | 0.554 | 1.18 | 3.64 | 1.37 | 3.05 | |
| 180 | 0.543 | 1.20 | 3.84 | 1.62 | 3.00 | |
| 320 | 0.537 | 1.20 | 4.01 | 1.83 | 2.94 | |
| 570 | 0.535 | 1.21 | 4.15 | 2.00 | 2.91 | |
| 1000 | 0.535 | 1.21 | 4.25 | 2.11 | 2.91 | |
| 0.3825 | 10 | 0.682 | 0.97 | 2.97 | 0.42 | 3.68 |
| 18 | 0.619 | 1.09 | 2.94 | 0.65 | 3.17 | |
| 32 | 0.583 | 1.16 | 3.06 | 0.90 | 2.97 | |
| 57 | 0.558 | 1.20 | 3.23 | 1.16 | 2.83 | |
| 100 | 0.541 | 1.22 | 3.41 | 1.41 | 2.75 | |
| 180 | 0.531 | 1.24 | 3.60 | 1.65 | 2.68 | |
| 320 | 0.526 | 1.25 | 3.76 | 1.85 | 2.65 | |
| 570 | 0.525 | 1.25 | 3.89 | 2.01 | 2.63 | |
| 1000 | 0.525 | 1.26 | 3.97 | 2.12 | 2.62 |
| (keV) | () | () | ||||
|---|---|---|---|---|---|---|
| 0.7200 | 10 | 0.655 | 1.08 | 2.58 | 0.49 | 3.05 |
| 18 | 0.603 | 1.17 | 2.66 | 0.71 | 2.77 | |
| 32 | 0.568 | 1.23 | 2.81 | 0.96 | 2.62 | |
| 57 | 0.544 | 1.26 | 2.98 | 1.21 | 2.50 | |
| 100 | 0.528 | 1.28 | 3.15 | 1.45 | 2.42 | |
| 180 | 0.519 | 1.30 | 3.31 | 1.68 | 2.35 | |
| 320 | 0.514 | 1.31 | 3.45 | 1.88 | 2.32 | |
| 570 | 0.513 | 1.31 | 3.56 | 2.03 | 2.29 | |
| 1000 | 0.514 | 1.32 | 3.64 | 2.13 | 2.29 | |
| 0.9925 | 10 | 0.628 | 1.25 | 2.17 | 0.61 | 2.43 |
| 18 | 0.580 | 1.31 | 2.29 | 0.84 | 2.25 | |
| 32 | 0.546 | 1.36 | 2.42 | 1.07 | 2.10 | |
| 57 | 0.522 | 1.39 | 2.56 | 1.31 | 1.98 | |
| 100 | 0.508 | 1.41 | 2.68 | 1.53 | 1.89 | |
| 180 | 0.499 | 1.42 | 2.80 | 1.74 | 1.83 | |
| 320 | 0.496 | 1.43 | 2.90 | 1.92 | 1.78 | |
| 570 | 0.495 | 1.44 | 2.98 | 2.07 | 1.76 | |
| 1000 | 0.496 | 1.44 | 3.03 | 2.16 | 1.75 |

| (keV) | () | () | ||||
|---|---|---|---|---|---|---|
| 0.0000 | 10 | 0.562 | 1.54 | 1.17 | 0.41 | 1.10 |
| 18 | 0.577 | 1.92 | 1.00 | 0.73 | 0.95 | |
| 32 | 0.571 | 2.07 | 1.03 | 1.05 | 0.95 | |
| 57 | 0.530 | 1.87 | 1.37 | 1.23 | 1.12 | |
| 100 | 0.495 | 1.16 | 3.33 | 1.08 | 2.60 | |
| 180 | 0.449 | 0.77 | 7.24 | 0.99 | 5.27 | |
| 320 | 0.452 | 0.54 | 14.2 | 0.93 | 11.1 | |
| 570 | 0.387 | 0.39 | 25.6 | 0.84 | 18.2 | |
| 1000 | 0.709 | 0.28 | 46.0 | 0.70 | 66.3 | |
| 0.3825 | 10 | 0.580 | 1.90 | 0.88 | 0.54 | 0.86 |
| 18 | 0.580 | 2.14 | 0.87 | 0.84 | 0.83 | |
| 32 | 0.560 | 2.23 | 0.93 | 1.14 | 0.84 | |
| 57 | 0.530 | 1.72 | 1.59 | 1.20 | 1.32 | |
| 100 | 0.500 | 1.11 | 3.62 | 1.07 | 2.87 | |
| 180 | 0.450 | 0.75 | 7.54 | 0.99 | 5.51 | |
| 320 | 0.450 | 0.53 | 14.6 | 0.92 | 11.5 | |
| 570 | 0.390 | 0.39 | 26.0 | 0.84 | 18.6 | |
| 1000 | 0.710 | 0.28 | 46.3 | 0.69 | 67.2 |
| (keV) | () | () | ||||
|---|---|---|---|---|---|---|
| 0.7200 | 10 | 0.590 | 2.23 | 0.72 | 0.69 | 0.72 |
| 18 | 0.580 | 2.36 | 0.77 | 0.98 | 0.74 | |
| 32 | 0.550 | 2.28 | 0.91 | 1.21 | 0.80 | |
| 57 | 0.530 | 1.57 | 1.89 | 1.16 | 1.60 | |
| 100 | 0.500 | 1.06 | 3.95 | 1.06 | 3.17 | |
| 180 | 0.450 | 0.74 | 7.88 | 0.99 | 5.85 | |
| 320 | 0.450 | 0.53 | 15.0 | 0.92 | 11.9 | |
| 570 | 0.390 | 0.39 | 26.5 | 0.84 | 19.0 | |
| 1000 | 0.710 | 0.28 | 46.8 | 0.70 | 67.7 | |
| 0.9925 | 10 | 0.610 | 2.56 | 0.64 | 0.94 | 0.67 |
| 18 | 0.580 | 2.50 | 0.74 | 1.16 | 0.72 | |
| 32 | 0.560 | 1.97 | 1.22 | 1.21 | 1.13 | |
| 57 | 0.540 | 1.39 | 2.37 | 1.12 | 2.09 | |
| 100 | 0.500 | 0.99 | 4.49 | 1.04 | 3.69 | |
| 180 | 0.440 | 0.71 | 8.51 | 0.98 | 6.34 | |
| 320 | 0.450 | 0.51 | 15.7 | 0.92 | 12.6 | |
| 570 | 0.380 | 0.38 | 27.3 | 0.83 | 19.3 | |
| 1000 | 0.720 | 0.27 | 47.6 | 0.69 | 70.1 |


3.1.2 High viewing angle case,
For and at the highest end of we need to set a shorter energy range and also shift the lower energy range to the softer band to obtain good fits. For , for example, the fitting was only successful for a very narrow energy range, 0.3 – 5 keV. This is caused by the change in the spectral shape as increases, i.e. becomes softer and the peak is shifted to softer energy band (see Fig. 2 for comparison between (left) and (right)). This, in turns, causes a sudden increase in for . Below , -value tends to decrease as increases.
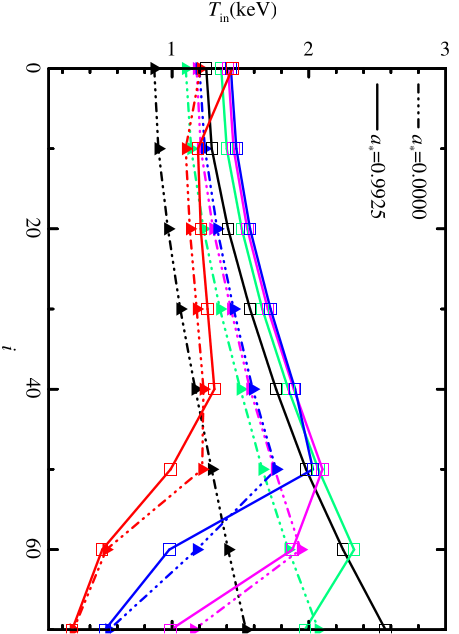
The interesting feature of is the existence of the turning point at a certain denoted as . The effect of the spin parameter and viewing angle on will be discussed in the next subsection. For a fixed value of , increases with up to , similarly to the case. As increases further (), decreases, in contrast to the face on case (Fig. 3, lower right figure, middle panel). In the slim disc model, the disc geometry changes, disc becomes thicker as increases as shown in Fig. 5 where we only plot the half thickness of the disc for the spin value of 0.9925 (solid lines). The dotted lines show the observer’s line of sight at the viewing angles of and . As the radiation from the innermost hot part of the disc is blocked by the puffed up radiation-pressure dominated region, decreases significantly. Similarly to , also decreases (see Fig. 3 (lower left figure) and Fig. 4 (purple lines)).
Significant increase in the size of the emitting region, , can be seen especially for high what can be explained by the obscuration effect. Due to obscuration, decreases much faster than , as shown in Fig. 3 lower (left panel) and Fig. 4 (purple), which results in the increase of . Note, however, that also increases when what shows that we can only observe the radiation-pressure dominated, cooler part of the disc, surrounding the innermost hot part.
3.2 The dependence on the spin parameter
3.2.1 Face-on case
For a fixed value of , value becomes smaller for increasing . When , the change in the value of due to the change in becomes less significant due to the decreasing value of ISCO radius as increases.
The larger is, the higher becomes . This fact demonstrates that there is significant radiation from smaller radii. In fact, as shown in Table 1 & 2, decreases as increases (for a fixed value of ). Note, however, that the relativistic effects play a significant role as increases. That is, may not be the real maximum temperature of the disc (see Discussion).
The maximum values of in the non-rotating case are around keV, lower than those of W00–01, even when (see Table 1 & 2). Therefore, in order to explain high disc temperature, keV or higher, as observed in GRS 1915+105, we will need a rotating black hole and a high viewing angle (see Table 3 & 4). In the present study, we only consider near-Eddington case that can be regarded as an extension of McClintock et al. (2006) in which only cases are considered. The size of the emitting region is smaller as increases which shows the significant but subtle effect of the light bending. For a fixed value of , the disc luminosity increases but only slightly, as increases. The observer will receive fewer number of photons when the light bending effect becomes more important as the inner edge of the disc gets closer to the black hole. The innermost disc temperature, , also increases with . The combined dependence of and () on spin result in the decrease of as increases.
3.2.2 High viewing angle case,
At high viewing angle, the observational features of the relativistic slim disc spectra become more complicated. The relativistic effects together with the geometry of the disc play an important role in determining the observable parameters. As shown in Fig. 3 (lower left figure), we can see some turning points, which occur due to the obscuration of the inner, brighter and higher- temperature part of the disc by radiation-pressure dominated, cooler part. It turns out that the turning points appear at different values of , , whose value depends on the spin parameter. The higher the spin value is, the lower is (see Table 5). The stars, in the left panel, mark the values at the lowest mass accretion rate, .
The value of is more or less constant, around – 0.6, below the turning point. After the turning points, decreases, except for (see 3.1.2). The trend in the value may be used to indicate a significant change in the spectral shape. However, seems less sensitive to the spin parameter.
Unlike , is rather sensitive to the spin parameter before the turning points, in which is higher for greater spin parameter. In general, increases until it reaches , after which it starts to decrease significantly. At , shows no dependence on .
3.3 The dependence on the viewing angle
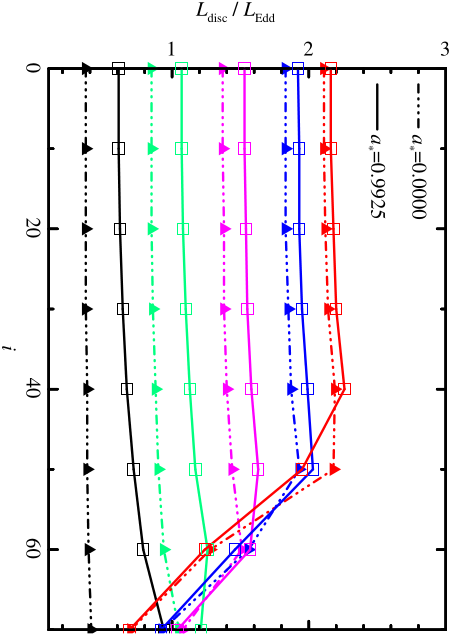
Fig. 6 shows the dependence of the fitting results on the viewing angle for two spin parameters, & 0.9925, in the left and right panels, respectively.
Let us first consider the case when . The fitting results for small viewing angles are very similar. Also, the values only differ slightly in all range. A deviation in the trend starts to appear when but only when is very high . In fact, the deviation becomes more significant at . For & case, the trends are very similar and they look very different from those of the smaller even when is not very high, .
Fig. 7 shows the dependence of (left panel) and (right panel) on . The colors represent different values of . For and for a fixed , the value of at is greater than that of the smaller , due mostly to the Doppler effect.
For small viewing angles, , the turning point never appears. We only start to see the turning point at , at which obscuration starts to become important. For , the turning point only appears when and .
For , the situation is quite similar to that of the non-rotating black hole case. However, a significant difference appears in the value of . As mentioned earlier, the value of depends on the spin parameter as can be seen in Fig. 3 & 6. In fact, does not only depend on but also on . The higher the is, the lower is the value of . The values of for , 60, and are presented in Table 5. The dependence of on is related to the geometry of the disc. In other words, we can test the relativistic slim disc theory by – diagram obtained from observation. Dependency of on results from the fact that the geometry of the inner part of the disc differs significantly between and 0.9925, for a fixed value of .
The increase of with for can be explained, again, by the relativistic effects. The Doppler effect increases the average energy of the photons emitted from the part of the disc which due to the disc rotation moves toward the observer. The inner part of the disc across the black hole within the observer’s line of sight can still be seen due to the light bending effect. The Doppler shift causes a spectral hardening effect in the observed spectrum due to the increase of the photon energy which in turns increases of the disc. The light bending effect, on the other hand, affects the observed spectrum by the increase of the photon flux but without the shift in photon energy.
| 320 | 1.93 | ||
| 100 | 1.51 | ||
| 57 | 1.23 | ||
| 100 | 1.63 | ||
| 32 | 1.26 | ||
| 18 | 1.16 |
4 Comparison with the Observations of GRS 1915+105
The observational signatures of the relativistic slim disc presented in our study should be observed in some sources at high luminosities, , and when the spectrum is dominated by the disc emission. GRS 1915+105 is, so far, the best target of our study, because it maintains its high luminosity, (Done, Wardziński & Gierliński 2004), since its discovery in 1992 (Castro-Tirado et al. 1994), and also because it has a large viewing angle (Mirabel & Rodríguez, 1994). The black hole mass in GRS 1915+105 and the distance are estimated to be (Steeghs et al., 2013) and kpc (Mirabel & Rodríguez, 1994). Similar to other known BHBs, however, the spectra are not always dominated by disc emission. Below, we compare our present results with the observations of GRS 1915+105, focusing on the data with disc-component dominated spectra.
4.1 GRS 1915+105 at near-Eddington luminosity
GRS 1915+105 has three unique spectral states, whose transitions may explain the unique 12 classes of X-ray variability in its light curves as shown by Belloni et al. (2000) (see also Klein-Wolt et al. 2002; Hannikainen et al. 2003, 2005). Amongst these classes, there are three quasi-steady classes whose variability is rather similar to other BHBs, i.e. class , and .
Vierdayanti, Mineshige & Ueda (2010), hereafter VMU2010, studied the behavior of GRS 1915+105 at near-Eddington luminosity. They chose data from RXTE observations taken in 1999 – 2000. In order to keep the results applicable for other BHB systems, they only focused on the data that show little variability. There were two groups of data in their final sample: those whose spectrum is dominated by the disc component and those dominated by the component other than the disc.
They fitted both groups using a disc+corona model. They chose the disc blackbody (DBB) model and, in addition, they also tried the extended DBB model for the disc- dominated data. As for the coronal component, they chose the thermal Comptonization model in which the reflection of the up-scattered photons by the disc, a 7.0 keV (K) absorption line of iron and its corresponding edge are taken into account as done in Ueda, Yamaoka & Remillard (2009).
VMU2010 found a new branch in the – plane (X-ray HR diagram, hereafter) as shown in fig. 11 of VMU2010. For disc-dominated spectra, they found that there seems to be two branches of in the X-ray HR diagram when the disc blackbody model is applied. The upper branch has never been observed in other BHBs. Normally, when the spectra are dominated by the disc component, they follow the relation that implies a constant . In the standard disc model scenario, it means that the disc inner edge has reached the ISCO.
When the extended DBB model is applied, however, they found that these spectra show deviation from that of the standard accretion disc, despite being disc-dominated. The values were closer to the value of the slim disc model, i.e., instead of that of the standard disc (). Moreover, the higher luminosity branch in their X-ray HR diagram does not follow . Instead, it resembled the relativistic slim disc branch at moderately high and high as we find in our present study.
4.2 Interpretation based on relativistic slim disc model
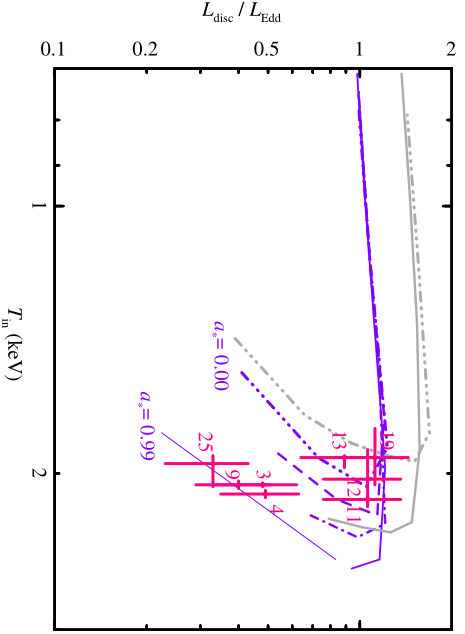
We plot VMU2010 data together with the results of this work for (light gray) & (purple) in Fig. 8. Regarding the VMU2010 data, we took all the disc-dominated datasets which satisfy when fitted with the extended DBB model, where is the luminosity of the Comptonization component. These are dataset 3, 4, 9, 11, 12, 13, 19 and 25. The thin purple line marks the extension of for assuming . The most significant result is that we can now explain the origin of the two groups of data on the – diagram which were discovered by VMU2010. The lower branch is an extension of the standard disc branch in the high luminosity regime, while the upper branch is produced by the inner disc obscuration.
Based on the lower luminosity data points (dataset 3, 4, 9, and 25), high spin parameter is strongly favored. As a reminder, solid lines in Fig. 8 represent . Assuming that GRS 1915+105 has a rapidly spinning black hole, , the turning point due to obscuration occurs at (see Table 5). Therefore, the mass accretion rate, , for the lower luminosity data points should be lower than 18. For the upper luminosity data points, should be higher than 18 but lower than 100, since otherwise high value of cannot be explained (see in Table 4 for and ).
From our present analysis for and we obtain for and becomes smaller as increases ( for ). Note that for lower , value is already below 0.6 even for despite the fact that the range is within the error estimated from observations. VMU2010 estimated the values of the data in which the disc fraction is significantly high () to be . That is, values obtained by VMU2010 are consistent with the case of – 32 in our present study.
The high maximum disc temperature commonly found in GRS 1915+105 is also an important signature of slim disc at high viewing angle. As discussed in Section 3, the observer at higher viewing angle will have more chance to observe both the higher energy photons as well as the emission from the smaller radii, when . In the case when , the maximum disc temperature can reach 2 keV or even slightly higher. We suggest that the disc-dominated data of GRS 1915+105 used in VMU2010 are the first evidence of relativistic slim disc theory and its obscuration at high spin parameter and viewing angle.
5 Discussion
5.1 Interpretation of
The relativistic effects should play a significant role as the inner edge of the disc gets closer to the black hole. The estimate of the inner edge radius would require a full knowledge of the gravitational redshift and the light bending. It is very likely that this inner edge is a region that is visually hidden to the observer, from which the emission cannot escape along his line of sight. It implies that the observed innermost disc temperature, , may not be the real maximum temperature of the disc when relativistic effects become important.
As shown in Table 1 & 2, values saturate at around and , for and 0.9925, respectively, for the face-on case even when . From the numerical simulation we know that the inner edge of the disc can reach for and for at . Thus, the saturation of shows that the emission from the innermost part at is not captured by the extended DBB model even when . Since the innermost part of the disc is invisible, we automatically lose the information of the real maximum temperature of the disc. In the case of high-, the situation becomes even more complicated especially at high due to the obscuration effect. Unless we know , and of the observed systems, it is difficult to estimate the real maximum temperature of the disc from observation. Ironically, we usually estimate and from observable parameters such as and .
5.2 Disc Geometry
So far the comparison between the theory and observations based on spectral fitting has been made mainly to check the surface temperature profile of the disc. The present study provides another way of comparison, since it can test not only the surface temperature profile but also the disc geometry (i.e., the disc height distribution, ). The observed behavior of the disc on the – diagram can provide an independent support to the relativistic slim disc model.
In the standard picture of accretion disc, the disc is assumed to be geometrically thin. That is, the disc obscuration becomes less important except when the viewing angle is . In the slim disc model, however, the disc geometry becomes thicker from that of the standard case when the radiation pressure becomes important. On the other hand, the photon trapping due to advective motion will reduce the disc geometrical thickness. Therefore, as the photon trapping becomes effective, we expect the decrease of the disc geometrical thickness, as can be seen in Fig. 5.
In Fig. 5, we can also see that the photon trapping starts to become effective at larger radii as increases. However, we can also see that the scale height of the disc greatly increases with . It explains why at moderately high viewing angle, we could never see the inner part of the disc when mass accretion rate is extremely high, .
5.3 Black Hole Spin Estimate
Estimating the spin parameter is not an easy task especially if we only have a short range of luminosity data. In the case of low viewing angle, the value of the maximum temperature and disc luminosity may help in distinguishing non-rotating black holes from the rapidly rotating ones. In the case of high viewing angle, in addition to and , is useful in estimating as depends on and . Estimating itself, although possible, is not trivial. By comparison with the observations, we suggest a spin parameter value, for GRS 1915+105. Focusing on low luminosity data, , McClintock et al. (2006) also found for GRS 1915+105. It is interesting to note in this respect that Middleton et al. (2006), due to their selection criteria, mainly used high luminosity data of GRS 1915+105 and derived lower spin parameter value, . We can now understand the reason for this; if we fit the upper branch data (at high luminosities) by the standard disc theory, we will get lower spin parameters (see Fig. 8).
We also need to address the absorption (both continuum and line) model issue. Accurate estimation of the column densities of major elements in the interstellar matter between the source and the observer becomes very crucial, especially for GRS 1915+105. It will significantly affect the energy range of the X-ray emission from BHBs. VMU2010 followed Ueda et al. (2009) in modeling the absorption by the interstellar and circumstellar gas. Ueda et al. (2009) in their study used the data from simultaneous Chandra HETGS and RXTE observations which give better statistics than some previous studies (e.g. Lee et al. 2002). The fitting results, however, seem to have a strong dependence on the absorption model. The results may change when different treatment for the absorption, i.e. different absorption model, is applied which remains an open question.
6 Conclusions
We have studied the observational signatures of the relativistic slim disc (S11) by fitting the synthetic spectra with the extended DBB model. The dependence of these signatures on the accretion rate (), black hole spin (), and inclination angle () have been investigated. We have shown that it is possible to estimate those physical parameters from observations. We found a new parameter, , which depends on the spin parameter for high viewing angles. We also found that the two branches found by VMU2010 on – plane can be explained by the relativistic slim disc model. We suggest that the disc-dominated data of GRS 1915+105 used in VMU2010 is the first evidence of the relativistic slim disc and its obscuration at high spin parameter and viewing angle.
Acknowledgments
We gratefully thanks the referees for their comments that help improved this work. This work is supported in part by research grant ‘Program Hibah Bersaing’ (DIPA ITB 2011 No.003/TL-J/DIPA/SPK/2011, KV), the Grant-in-Aid of Ministry of Education, Culture, Sports, Science, and Technology (MEXT) (22340045, SM) and by the Grant-in-Aid for the global COE programs on The Next Generation of Physics, Spun from Diversity and Emergence from MEXT (KV, SM). AS was supported in part by NASA grant NNX11AE16G. MB was supported in part by RVO:67985815. KV thanks Jun Toshikawa and Mahasena Putra for fruitful discussion.
References
- Abramowicz et al. (1988) Abramowicz M. A., Czerny B., Lasota J. P., Szuszkiewicz, E., 1988, ApJ, 332, 646
- Abramowicz et al. (1989) Abramowicz M. A., Kato S., Matsumoto R., 1989, PASJ, 41, 1215
- Abramowicz et al. (2010) Abramowicz M. A., Jaroszyński M., Kato S., Lasota J. P., Róańska A., Sa̧dowski A., 2010, A&A, 521, 15
- Belloni et al. (2000) Belloni T., Klein-Wolt M., Méndez M., van der Klis M., van Paradijs J., 2000, A&A, 355, 271
- Bursa (2006) Bursa A. M., 2006, PhD thesis, Astronomical Institute of the Academy of Sciences, Praha, Czech Republic
- Castro-Tirado et al. (1994) Castro-Tirado A. J., Brandt S., Lund N., Lapshov I., Sunyaev R. A., Shlyapnikov A. A., Guziy S., Pavlenko E. P., 1994, ApJS, 92, 469
- Done et al. (2004) Done C., Wardziński G., Gierliński M., 2004, MNRAS, 349, 393
- Done et al. (2007) Done C., Gierliński M., Kubota A., 2007, A&ARv, 15, 1
- Gilvanof (2010) Gilvanof M., 2010, in Belloni T., eds, Lecture Notes in Physics. Berlin Springer Verlag Vol. 7, p.17
- Haba et al. (2008) Haba Y., Terashima Y., Kunieda H., Ohsuga K., 2008, PASJ, 60, 487
- Hannikainen et al. (2003) Hannikainen D. C. et al., 2003, A&A, 411, L415
- Hannikainen et al. (2005) Hannikainen D. C. et al., 2005, A&A, 435, 995
- Kato et al. (2008) Kato S., Fukue J., Mineshige S., 2008, Black-Hole Accretion Disks. Kyoto University Press, Kyoto
- Kawaguchi (2003) Kawaguchi T., 2003, ApJ, 593, 69
- Klein-Wolt et al. (2002) Klein-Wolt M., Fender R. P., Pooley G. G., Belloni T., Migliari S., Morgan E. H., van der Klis M., 2002, MNRAS, 331, 745
- Kubota & Makishima (2004) Kubota A., Makishima K., 2004, ApJ, 601, 428
- Kubota et al. (1998) Kubota A., Tanaka Y., Makishima K., Ueda Y., Dotani T., Inoue H., Yamaoka K., 1998, PASJ, 50, 667
- Kulkarni et al. (2011) Kulkarni A. K. et al., 2011, MNRAS, 414, 1183
- Lee et al. (2002) Lee J. C., Reynolds C. S., Remillard R., Schulz N. S., Blackman E. G., Fabian A. C., 2002, ApJ, 567, 1102
- McClintock et al. (2006) McClintock J. E., Shafee R., Narayan R., Remillard R. A., Davis, S. W., Li L., 2006, ApJ, 652, 518
- McClintock et al. (2010) McClintock J. E., Narayan R., Gou L., Liu J., Penna R. F., Steiner J. F., 2010, in Comastri A., Angelini L., Cappi M., eds, X-Ray Astronomy 2009: Present Status, Multi-Wavelength Approach and Future Perspectives. AIP, Melville, NY, p.101
- Middleton et al. (2006) Middleton M., Done C., Gierliński M., Davis S. W., 2006, MNRAS, 373, 1004
- Mineshige et al. (1994) Mineshige S., Hirano A., Kitamoto S., Yamada T. T., Fukue J., 1994, ApJ, 426, 308
- Mineshige et al. (2000) Mineshige S., Kawaguchi T., Takeuchi M., Hayashida K., 2000, PASJ, 52, 499
- Mirabel & Rodríguez (1994) Mirabel I. F., Rodríguez L. F., 1994, Nature, 371, 46
- Noble et al. (2011) Noble S. C., Krolik J. H., Schnittman J. D., Hawley J. F., 2011, ApJ, 743, 115
- Novikov & Thorne (1973) Novikov I. D., Thorne K. S., 1973, in Dewitt C., Dewitt B. S., eds, Black Holes (Les Astres Occlus). Gordon and Breach, Paris, p.343
- Okajima et al. (2006) Okajima T., Ebisawa K., Kawaguchi T., 2006, ApJL, 652, L105
- Paczyńsky & Wiita (1980) Paczyńsky B., Wiita P. J., 1980, A&A, 88, 23
- Remillard & McClintock (2006) Remillard R. A., McClintock J. E., 2006, ARA&A, 44, 49
- Sa̧dowski (2011) Sa̧dowski A., 2011, Ph.D. thesis, Polish Academy of Sciences, arXiv:1108.0396
- Shafee et al. (2006) Shafee R., McClintock J. E., Narayan R., Davis S. W., Li L., Remillard R. A., 2006, ApJ, 636, L113
- Shakura & Sunyaev (1973) Shakura N. I., Sunyaev R. A., 1973, A&A, 24, 337
- Steeghs et al. (2013) Steeghs D., McClintock J. E., Parsons S. G., Reid M. J., Littlefair S., Dhillon V. S., 2013, ApJ, 768, 185
- Szuszkiewicz et al. (1996) Szuszkiewicz E., Malkan M. A., Abramowicz M. A., 1996, ApJ, 458, 474
- Takeuchi et al. (2009) Takeuchi S., Mineshige S., Ohsuga K., 2009, PASJ, 61, 783
- Tsunoda et al. (2006) Tsunoda N., Kubota A., Namiki M., Sugiho M., Kawabata K., Makishima K., 2006, PASJ, 58, 1081
- Ueda et al. (2009) Ueda Y., Yamaoka K., Remillard R., 2009, ApJ, 695, 888
- Vierdayanti et al. (2008) Vierdayanti K., Watarai K., Mineshige S., 2008, PASJ, 60, 653
- Vierdayanti et al. (2010) Vierdayanti K., Mineshige S., Ueda Y., 2010, PASJ, 62, 239
- Wang & Zhou (1999) Wang J. M., Zhou Y. Y., 1999, ApJ, 516, 420
- Watarai et al. (2000) Watarai K., Fukue J., Takeuchi M., Mineshige S., 2000, PASJ, 52, 133
- Watarai et al. (2001a) Watarai K., Mizuno T., Mineshige S., 2001a, ApJ, 549, L77
- Watarai & Mineshige (2001b) Watarai K., Mineshige S., 2001b, PASJ, 53, 915
- Watarai & Mineshige (2003) Watarai K., Mineshige S., 2003, PASJ, 55, 959