A glance at the host galaxy of high-redshift quasars using strong damped Lyman-alpha systems as coronagraphs
Abstract
We searched quasar spectra from the SDSS-III Baryon Oscillation Spectroscopic Survey (BOSS) for the rare occurrences where a strong damped Lyman-alpha absorber (DLA) blocks the Broad Line Region emission from the quasar and acts as a natural coronagraph to reveal narrow Ly emission from the host galaxy. We define a statistical sample of 31 DLAs in Data Release 9 (DR9) with log located at less than 1 500 km from the quasar redshift. In 25% (8) of these DLAs, a strong narrow Ly emission line is observed with flux 25 on average. For DLAs without this feature in their troughs, the average 3- upper limit is . Our statistical sample is nearly times larger than the anticipated number of intervening DLAs in DR9 within of the quasar redshift. We also define a sample of 26 DLAs from DR9 and DR10 with narrow Ly emission detected and no limit on the H I column density to better characterize properties of the host galaxy emission. Analyzing the statistical sample, we do not find substantial differences in the kinematics, metals, or reddening for the two populations with and without emission detected. The highly symmetric narrow Ly emission line profile centered in the HI trough indicates that the emitting region is separate from the absorber. The luminosity of the narrow Ly emission peaks is intermediate between that of Lyman-alpha emitters and radio galaxies, implying that the Ly emission is predominantly due to ionizing radiation from the AGN. Galaxies neighboring the quasar host are likely responsible for the majority (%) of these DLAs, with only a minority (%) arising from H I clouds located in the AGN host galaxy.
Key Words.
quasars: absorption lines – quasars: emission lines1 Introduction
Quasar host galaxy properties may provide important constraints on active galactic nucleus (AGN) feedback mechanisms (Cattaneo et al. 2009; Fabian 2012) and information to better understand the relationship between the growth of the central black hole and the growth of the galaxy (Ferrarese & Merritt 2000, e.g.). The black hole mass, , scales with the stellar mass in the host bulge, , and the stellar velocity dispersion, , linking galaxies’ star formation history to the evolution of their supermassive black holes (Gebhardt et al. 2000). The bulk of star formation in the bulge may occur simultaneously with the maximum black hole growth (Lutz et al. 2008), since both processes rely on reservoirs of gas brought to the center by gas-rich mergers and disk instabilities. The growth phase ends when no gas remains, if, for example, star formation consumes all the gas. Alternatively, the AGN may blow the gas outside its host galaxy (Fabian et al. 2006), curtailing star formation. In this case, the AGN must have sufficient luminosity for the radiation-pressure force outwards to exceed the gravitational force inwards. Untangling the black hole growth and star formation processes is crucial for explaining how galaxies arrive at their present-epoch characteristics.
For nearby quasar host galaxies, it is possible to obtain detailed observations. Using an integral-field spectrograph, Davis et al. (2012) traced the kinematics of ionized gas and identified an AGN-driven outflow disrupting the star-forming gas in NGC 1266 (D = 30 Mpc). Similar studies of nearby quasars are abundant enough to permit a statistical analysis of the – , – , and – scaling relations in samples compiled from the literature (Gültekin et al. 2009; Graham et al. 2011; McConnell & Ma 2013). The challenge of resolving quasar host galaxies can be overcome at with deep ground-based imaging (Kotilainen et al. 2013; see also Márquez et al. 2001), at and with Hubble Space Telescope imaging (Floyd et al. 2013), and at with adaptive optics (Falomo et al. 2008; Wang, Y. P. et al. 2013). Targeting gravitationally lensed quasars is a particularly effective method for obtaining host galaxy properties at high redshift, up to Peng et al. (2006a); Peng et al. (2006b). These observations at different epochs provide essential constraints on the evolution of quasar host galaxies.
Millimeter astronomy has been essential for probing quasar host galaxies at higher redshifts. The detection of CO emission in the z = 4.7 quasar BR120-0725 (Omont et al. 1996), along with continuum emission due to dust, confirmed that high-redshift quasars are associated with galaxies. This same quasar host galaxy also shows strong Ly emission (Petitjean et al. 1996), indicating enhanced star formation or elevated ionization from the quasar flux. Recent observations with the Atacama Large Millimeter/submillimeter Array (Wootten & Thompson 2009, ALMA;) of [C II] line emission in the BR120-0725 host galaxy suggest an outflow of gas ionized by the quasar (Wagg et al. 2012). At this early epoch, quasar hosts have both vigorous star formation and central black holes that accrete at the Eddington limit (Wang, R. et al. 2013). Comparing the star formation rate to the black hole accretion rate indicates which process is dominant. For example, Willott et al. (2013) found that the quasar host galaxy J2329-0301 has an uncharacteristically low ratio of star formation to black hole accretion, implying that the quasar has shut off star formation in the galaxy, potentially by photo-ionizing the diffuse gas. Indeed, this quasar has extended Ly emission across at least 15 kpc (Goto et al. 2009; Willott et al. 2011).
At the epoch, when the quasar luminosity function peaks (Richards et al. 2006, e.g.,), spectroscopy remains the best tool for investigating host galaxies. An ultra-deep, blind, spectroscopic long-slit survey revealed a young stellar population in the host galaxy of a quasar, the formation of which coincides with the quasar activity (Rauch et al. 2013). With spectroscopy, it is also possible to study absorption systems, such as associated narrow absorption lines (NALs), that probe the gaseous environments close to quasars. Associated NAL systems at tend to have solar or super-solar metallicities and potentially arise from AGN-driven outflows of gas from the interstellar medium (Petitjean et al. 1994; D’Odorico et al. 2004, ISM;). However, it is difficult to differentiate between gas associated with the AGN, gas from the ISM of the host galaxy, and gas located in galaxies clustered around the AGN host galaxy that is revealed by proximate damped Lyman-alpha absorption systems (DLAs). Sixteen such systems at similarly high redshifts and within of their background quasar have sub-solar metallicities (Ellison et al. 2010).
In a newly exploited technique for accessing the quasar host galaxy, DLAs at the redshift of the quasar, hereafter called associated DLAs, can act as natural coronagraphs, completely absorbing the broad Ly emission from the central AGN. In the absence of broad Ly emission, it is possible to observe a narrow Ly emission line from a source at approximately the same redshift as the quasar in the DLA trough. For this situation to occur, the absorber must cover the 1 pc Broad Line Region (BLR) without also obscuring extended Ly emission, which can be a result of both UV flux from the AGN that ionizes surrounding gas in the Narrow Line Region (NLR) and star formation activity within the host galaxy. A striking individual detection of this phenomenon is presented in Hennawi et al. (2009); the four other previous detections of narrow Ly emission in the trough of a DLA near the quasar redshift all have lower Ly luminosities (Møller & Warren 1993; Møller et al. 1998; Pettini et al. 1995; Ellison et al. 2002).
The serendipitous alignment of a DLA absorber along the quasar line-of-sight near enough to the host galaxy to reveal narrow Ly emission in the DLA trough is a rare occurrence. Ellison et al. (2011) exploited the statistical power of the Sloan Digital Sky Survey (York et al. 2000, SDSS;) to investigate the characteristics of proximate DLA absorbers in a sample compiled from Data Release 5 (Adelman-McCarthy et al. 2007). Only one DLA in the sample revealed narrow Ly emission (Hennawi et al. 2009, reported in), and no emission signal was seen in the stacked spectrum of 29 DLAs.
Thanks to the increased sample size of quasar spectra in the SDSS-III (Eisenstein et al. 2011) Baryon Oscillation Spectroscopic Survey (BOSS, Dawson et al. 2013), several associated DLAs with unprecedentedly strong narrow Ly emission superimposed on their troughs were discovered. In this article, we construct a statistical sample of associated DLAs from the SDSS Data Release 9 (Ahn et al. 2012, DR9; ). We study the emission and absorption properties of systems in our sample with the goal of characterizing any differences between the populations with and without emission detected in the BOSS spectra. We also characterize the emission properties of a sample of associated DLAs that reveal narrow Ly emission identified thus far in the survey by visual inspection.
Section 2 describes the definition of a complete statistical sample. We then calculate how many intervening DLAs we expect to find at the quasar redshift and consider the possibility of an overdensity (Section 3). Sections 4 and 5 respectively characterize the two DLA populations and the emission properties. In Section 6, we present several associated DLAs with a covering factor unequal to one and consider the implications. We discuss the results in the context of our two-population scenario in Section 7.
We use a CDM cosmology with , , and (Komatsu et al. 2011).
2 Sample Definition
2.1 Strong associated DLAs
The quasar lines-of-sight were observed as part of SDSS-III BOSS. From 2009 – 2014, this survey will take spectra of over 150 000 quasars at and 1.5 million galaxies at with the primary goal of detecting baryon acoustic oscillations at different cosmological times. A dedicated 2.5 m telescope (Gunn et al. 2006) conducts the imaging and spectroscopy. SDSS-III uses the same camera (Gunn et al. 1998) as its predecessor surveys (York et al. 2000) to obtain images in five broad bands, (Fukugita et al. 1996). Twin multi-object fiber spectrographs designed for BOSS collectively span 3 600 – 10 000 Å with cameras individually optimized for observing at blue and red wavelengths (Smee et al. 2012). Their resolving power varies from 1500 – 3000 across the wavelength range, such that the instrument velocity dispersion is consistently 150 . Bolton et al. (2012) describe the spectroscopic data reduction pipeline.
The Data Release 9 Quasar (DR9Q) catalog (Pâris et al. 2012) includes 87 822 quasars detected over 3 275 , 61 931 of which are at . A combination of target selection methods (Ross et al. 2012) achieved this high surface density of high-redshift quasars. The spectra are publicly available as part of DR9. Noterdaeme et al. (2012b, hereafter N12) provide a catalog of DLAs and sub-DLAs with log detected from an automatic search along the DR9Q lines-of-sight. We use an extended version of the N12 catalog that includes automatic detections up to beyond the quasar redshift.
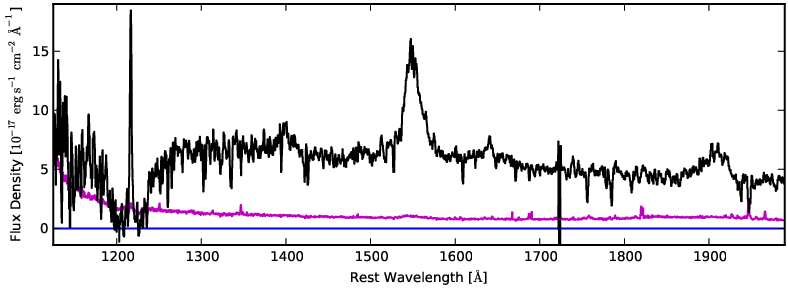
We select strong associated DLAs so that the Ly trough is large enough to completely mask the broad Ly emission line from the quasar (Figure 1). To gather candidates for a statistical sample of these strong associated DLAs, we search the extended N12 catalog for DLAs that are within of the quasar, have log, and arise in lines-of-sight with balnicity index zero and BAL_FLAG_VI0 (see Weymann et al. (1991) for a discussion of the balnicity index). We exclude quasar spectra with Broad Absorption Lines (BALs), since they could blend with the DLA and contaminate our H I column density measurements. N12 uses quasar redshifts assigned during the visual inspection, which have an uncertainty of about (Pâris et al. 2012). Due to this uncertainty on the quasar redshift, we allow the velocity difference limit to extend redward of the quasar, so as not to miss any associated DLAs by stopping the automatic search at the quasar redshift. The column density lower limit was chosen because the zero-level in the trough of the Voigt profile fit spans for log. Extending to lower column densities would obscure our ability to clearly detect Ly emission from the host galaxy in the trough. Applying these criteria returns 41 DLAs.
When an associated DLA reveals strong narrow Ly emission, the N12 automatic search may wrongly identify two consecutive DLAs. To recover these split DLAs, the extended N12 catalog is searched for lines-of-sight that have more than one DLA detected within of the quasar, balnicity index zero and BAL_FLAG_VI0. No limit is placed on the column density. Potential split DLAs must be confirmed by visually examining the associated metal absorption lines. Genuine split DLAs have one set of absorption lines that approximately align with the narrow Ly emission peak, whereas two sets of metal lines are present for consecutive DLAs. This procedure finds 9 associated DLAs split by narrow Ly emission, bringing the total number of log DLAs within of the quasar to 50.
2.2 Measuring DLA column densities and emissions


The zero-level in BOSS spectra tends to be slightly higher than the true zero (Pâris et al. 2012); this can impact the column density measurement for DLAs (Figure 2). Using the Voigt profile fit to the DLA, we identify the zero-flux density region in the DLA trough and calculate the average spectral flux density across these pixels to determine the zero-level offset for each spectrum. We correct the observed spectral flux density with this offset, ensuring that the spectral flux density is truly at zero in the DLA trough.
Column densities were re-measured for all DLAs according to the following process. Associated low-ionization transitions redwards of Ly are identified and fitted as an absorption system to obtain the DLA redshift. For all absorption line fits we use the VPFIT package11 1 Carswell http://www.ast.cam.ac.uk/~rfc/vpfit.html. If narrow Ly emission is present in the DLA, the peak is fitted with a Gaussian profile and removed (Figure 3, top). A template spectrum from the mean principal component analysis (PCA) quasar continuum (Pâris et al. 2011) is adjusted with a power-law fit to each spectrum and scaled to provide the quasar continuum near the Ly emission line (Figure 3, center). The column density is measured from the normalized spectrum by fitting the DLA with the redshift fixed to the value measured from the metals (Figure 3, bottom). Column density errors are on the order of 0.1 dex. Figure 4 shows the resultant column density distribution in our sample. The absorption system redshift and the H I column density are listed in Table 1.
The noise level in the spectrum is the 1- error on the spectral flux density. We have checked that the noise level is consistent with the scatter in the bottom of the DLA troughs by examining five DLAs with noise levels where narrow Ly emission is not detected (Figure 5). The average noise level for 217 pixels from the five DLAs is with standard deviation. The BOSS pixel size increases logarithmically from 0.82 to 2.39 Å over the wavelength range 3610 – 10 140 Å (Pâris et al. 2012), such that the pixel size is 1 Å at the typical observed wavelength for our DLAs, 4000 Å. The value from the Gaussian fit to the spectral flux density distribution, , is in excellent agreement with the average observed noise level.
We define the n- detection level for the narrow Ly emission (prior to its removal) as:
| (1) |
where is the number of pixels within 3- (1.27 FWHM) of the Gaussian fit. The average spectral flux density, , and average error, , are calculated for the pixels within this range. While we can determine Gaussian fits for narrow Ly emission down to the 2- level, we are confident about emission features detected at and above 4-. The DLAs that have - narrow Ly emission detections are shaded in cyan in Figure 4.

2.3 The Statistical Sample
The typical 1- column density error in the N12 catalog is 0.20 dex. Since our more precise column density estimates do not differ from the automatic detections by more than this error, we consider that our associated DLA sample is complete for systems with log. The shape of the column density distribution (Figure 4) further justifies this cut-off. We impose a velocity difference limit of (stricter than the initial search criteria), which excludes one DLA with log that is 2 530 below the PCA quasar redshift. (See section 4.2 for a discussion of kinematics.) The statistical sample includes 31 DLAs that are within 1 500 of the quasar and have log.
The properties of these DLAs can be used to statistically look for differences between the systems that reveal narrow Ly emission (detected at the 4- level, 8 DLAs) and those that do not.
2.4 The Emission Properties Sample
To characterize the properties of the narrow Ly emission features, we examine all lines-of-sight for which the emission is detected at 4-, regardless of the DLA column density. We supplement the DR9 sample with additional cases of DLAs revealing narrow Ly emission identified during the visual inspection of quasars for DR10 (Ahn et al. 2013). Twenty-six DLAs are included in the emission sample. Although this dataset is not complete, it is currently the best possible sample for studying the narrow Ly emission properties.
2.5 The Redshift Distribution
Figure 6 compares the redshift distributions for quasars in the statistical sample and DR9. The most noticeable difference is a possible excess of quasars at in the statistical sample. The peak in probability density is also flatter for the statistical sample than for the DR9 quasars. Otherwise, the redshift distribution for quasars in the statistical sample generally follows that of the DR9 quasars. Based on a Kolmogorov-Smirnov test, it is 68% likely that the two distributions are the same. A K-S test comparing the eight quasars in the statistical sample that have detected narrow Ly emission with the DR9 quasars indicates that it is 26% likely the two populations come from the same distribution. The quasar redshift distribution also shows that there is no preferred redshift for DLAs that reveal narrow Ly emission.

3 Anticipated Number of Intervening DLA Systems within of zQSO
We explore the possibility of an overdensity of DLAs at the quasar redshift by calculating the anticipated number of intervening DLAs with in DR9 and comparing this result to the number observed in our statistical sample of associated DLAs.
3.1 Anticipated Number in DR9
The absorption path is given by:
| (2) |
(Bahcall & Peebles 1969) where . We evaluate this expression with and the PCA redshift for each non-BAL quasar in DR9 with , the redshift range covered in the statistical sample. Summing the absorption path for each of the 55 679 quasar lines-of-sight gives the total absorption path, .
We use the distribution function, , given in N12 to integrate
| (3) |
for , since our statistical sample is complete above this column density. The expected number of DLAs is then , which predicts 12.93 associated DLAs in DR9.
3.2 The Effect of Clustering near Quasars
If the number density of associated DLAs is the same as that of intervening DLAs, then we anticipate finding 13 associated DLAs with log in DR9. Our statistical sample contains 31 such DLAs, more than twice as many as expected. This observed overdensity can be attributed to the clustering properties of DLAs around quasars. It is well known that quasars occur in overdense regions. Measurements of quasar clustering, which is more pronounced at higher redshifts (Croom et al. 2005), indicate that a quasar is likely to be part of a group of galaxies. It has also been shown that an overdensity of neutral gas is present within 10 Mpc of the quasar (Guimarães et al. 2007; Font-Ribera et al. 2013). Not surprisingly, the incidence of DLAs within 3 000 of the quasar is 2–4 times higher than that of intervening DLAs (Ellison et al. 2010). The number of associated DLAs that we observe is therefore consistent with what we expect due to clustering around the quasar host galaxy.
4 Characterizing the Statistical Sample
4.1 Scenario
The statistical sample breaks into two populations: associated DLAs that reveal narrow Ly emission at more than the 4- level (8) and those with no emission detected at this level (23). The first category is such an unusual occurrence that we investigate whether these DLAs have specific properties.
We would like to test the hypothesis that the absorbers giving rise to associated DLAs with narrow Ly emission superimposed on their troughs are intrinsically different than the absorbers responsible for the associated DLAs where no emission is detected. Narrow Ly emission appears in the DLA trough only if the absorber blocks the 1 pc BLR without also covering more extended sources of Ly emission, such as the NLR or star-forming regions. When no Ly emission is observed, a galaxy near to the quasar host is likely acting as a screen, blocking the BLR, NLR, and any extended emission regions.
The impact parameters for ten confirmed galaxy counterparts to intervening DLAs are all on the order of ten kiloparsecs (Krogager et al. 2012). For very high column densities, such as those observed in our sample, impact parameters could be even smaller (Noterdaeme et al. 2012a, e.g.). A neighboring galaxy would be sufficiently extended to obscure Ly emission from the quasar host, but the absorber that allows narrow Ly emission to pass unobscured must have a more compact size. Hennawi et al. (2009) suggest that the associated DLA towards SDSS J1240+1455 with a narrow Ly emission peak could arise from small (10 pc), dense ( 100 ) clouds of neutral hydrogen in the quasar host galaxy. Further supporting the idea that not all associated absorptions are due to galaxies clustered near the quasar host, Wild et al. (2008) found that upwards of 40% of 1.6 < z < 4 3 000 km C IV absorbers are directly related to the quasar. We likewise propose that the DLAs revealing narrow Ly emission are due to dense clouds of neutral hydrogen in the quasar host galaxy.
4.2 Kinematics

The velocity difference of the DLA redshift, measured from the metals, with respect to the quasar redshift, determined from a PCA, is not distinct for systems with and without superimposed narrow Ly emission (Figure 7). For both populations, nearly all DLAs fall within 1 200 of the quasar.
The main uncertainty when studying the kinematics is that the quasar redshift is not well known. More than half of the DLAs appear to be at higher redshifts than the quasars (systems with positive velocity difference in Figure 7), which could indicate infalling absorbers. However, positive velocity differences are consistent with a known tendency for the PCA redshifts to be slightly bluer than the true quasar redshift (Pâris et al. 2012).
4.3 Metals


The rest equivalent width, , of various metal transitions, C II - 1334 Å, Si II - 1526 Å, Al II - 1670 Å, and Fe II - 2344 Å, are measured for each DLA in the sample. These absorption features were chosen because they are typically not blended or redshifted out of the spectrum. The signal-to-noise ratio (S/N) is also best at wavelengths redward of Ly. However, sky subtraction problems start to become noticeable after 7500 Å, and in some spectra the Fe II lines are subject to additional noise.
Table 2 gives values measured from a fixed-redshift Voigt profile fit to the absorption system (referred to as "Fit" in the Table). A second estimate of is directly measured from the normalized flux by integrating over the line profile (referred to as "" in the Table). We include both estimates of because of local problems in the spectra and/or complex blends that are difficult to disentangle at the spectral resolution and S/N typical of BOSS data. The error on is calculated using the error on the normalized flux across the six innermost pixels.
We performed a two-distribution K-S test with for the populations where emission is and is not detected (Figure 8). In general, the largest values are observed in systems where no emission is detected. However, the C II - 1334 Å and Fe II - 2344 Å distributions each have a strong absorption in a DLA system with emission detected. Overall, the values are less than 67% likely to come from the same population. The maximum distance parameter is largest for Fe II - 2344 Å, and for this absorption feature the probability that the populations are the same is only 33%.
Since most of these absorption features are saturated, it is reasonable to assume that is related to the width of the lines and not to column densities. Keeping this in mind, we nonetheless plot versus (Figure 9) to investigate any indication of species depleting onto dust grains. While some depletion is expected for C II, Fe II is expected to be 50 times more depleted (Welty et al. 1999). The equivalent width ratios appear to decrease with increasing . A linear fit indicates a slope of and a y-intercept of . The systems where narrow Ly emission is detected consistently have lower than the systems without a detection at the same . We should be careful when interpreting this, but if the is related to depletion then this would indicate that dust content is stronger in DLAs showing emission. Although somewhat surprising, this would at least support the idea that the gas in the DLA is not directly related to the Ly emitting gas. Any correlations may become clearer with column densities, rather than , but the BOSS spectral resolution and S/N are too low to permit this measurement.
4.4 Reddening
We explore reddening of the quasar spectra due to dust absorption from the associated DLAs by comparing their colors to the general population of quasars. All but one of the associated DLAs fall in the or band, so we are limited to the - and - colors. The left panel of Figure 10 shows the - color as a function of and the right panel gives the distribution for color bins. Quasar spectra with an associated DLA and narrow Ly emission are nearly all redder than the average - color for DR9 quasars with no DLA along their line-of-sight, while the - colors for associated DLAs without a narrow Ly detection are more dispersed. The distribution reveals that the associated DLAs, both with and without an emission detection, have redder average - colors than the DR9 comparison quasars. A K-S test indicates that the associated DLAs with (without) narrow Ly emission detected have a 3% (36%) probability of arising from the same - color distribution as the DR9 comparison quasars, and the associated DLAs with an emission detection have a 21% probability of arising from the same distribution as the associated DLAs without a detection. A larger sample size would be needed to confirm that these are truly distinct populations.
We fit the quasar spectra with a Small Magellanic Cloud (SMC) reddening law template (Gordon et al. 2003) to further investigate potential differences between the associated DLAs that reveal narrow Ly emission and those that do not. The SMC extinction curve is the best fit for the majority of the spectra, because they lack the 2175 Å bump characteristic of Large Magellanic Cloud or Milky Way extinction curves. In the E(B-V) reddening distribution (Figure 11), the most reddened systems (E(B-V) ) do not have a narrow Ly emission detection. Otherwise, the distributions are similar for the two populations, and they are both consistent with no reddening on average.
5 Characterizing the Narrow Ly Emission
In order to explore the properties of the narrow Ly emission detected in the troughs of associated DLAs, we analyze the sample described in Section 2.4.
We fit a Gaussian profile to each narrow Ly emission peak and derive , the integrated flux (IF), and the luminosity from the fit parameters. The integrated flux is calculated by summing the spectral flux density in the region within 3- of the Gaussian fit center (1.27 FWHM). The emission peaks all have IF values less than , except for two extremely strong emission peaks with IF 200 . Since no IF values are in the range , we use these limits to distinguish strong and moderate narrow Ly emission peaks.
We estimate the luminosity using the integrated flux and the luminosity distance calculated for . In Figure 12, we examine properties of the DLA, quasar, and emission peak as a function of the integrated flux and the luminosity.
5.1 Correlation with other properties
The H I column density increases mildly with integrated flux (Figure 12, left).
An outlier with log has moderate Ly emission, and none of the log DLAs show strong Ly emission.
The quasar absolute luminosity, indicated by , is calculated using the -correction process outlined in Richards et al. (2006), with and H0 . No trend is apparent for the quasar absolute luminosity versus Ly emission luminosity (Figure 12, center).
The FWHM from the Gaussian fit to the narrow Ly emission peak is deconvolved from the BOSS spectrograph velocity resolution, 150 km , and the error depends on the error for the fit to the Gaussian parameter. Two narrow Ly emission peaks have FWHM . Only one point at FWHM with a large uncertainty falls between and .
Figure 13 shows the quasar absolute luminosity as a function of the FWHM. Narrow Ly emission peaks with FWHM are uniformly distributed across the luminosity range, while those with FWHM are concentrated at . The average FWHM for the narrower and wider Ly emission peaks are 485 and 1 000 respectively. For the wider Ly emission peaks, luminosity increases with increasing FWHM. Ly emission peaks with large FWHM values are preferentially observed in high luminosity quasars.


5.2 Position and profile of the emission line
The center of the Gaussian fit to the narrow Ly emission provides the Ly emission redshift, . The velocity difference distribution for with respect to reveals that the narrow Ly emission is within of the DLA for the majority of systems (Figure 14). The narrow Ly emission peaks are blueshifted and redshifted in nearly equal numbers, and the mean velocity difference is .
Figures 15 and 16 show the combined spectra for the associated DLAs with strong and moderate narrow Ly emission, respectively. The emission is symmetric, in contrast to the asymmetric line profile characteristic of Lyman Break Galaxies (Tapken et al. 2007, LBGs;). This indicates that there is no H I gas in front of the emitting region to absorb the emitted Ly photons. Small H I clouds in the host galaxy can explain the presence of the associated DLAs and also the symmetric narrow Ly emission. Neutral hydrogen is located in front of the quasar line-of-sight, but does not fully cover the NLR or extended emission regions.
Figure 17 presents the combined spectrum for the associated DLAs where the 4- upper limit on the integrated flux is . At the 3- level, no Ly emission is detected in the combined spectrum down to , which is surprising for such bright quasars. This implies that the entire host galaxy must be covered by a screen of gas unrelated to its own composition. We speculate that an independent nearby galaxy acts as a screen and blocks the Ly emission from the quasar host galaxy.


5.3 Comparison with Lyman Break Galaxies
The narrow Ly emission peaks superimposed on the troughs of associated DLAs can be compared with LBGs, which typically have redshifted emission and blueshifted absorption features at the Ly transition. In LBGs, star-forming regions that emit Ly photons are surrounded by H I gas. The Ly photons are most likely to escape the galaxy when they scatter off of gas that is redshifted with respect to the emitting region.
Shapley et al. (2003) analyzed spectra from 811 LBGs at , and found that the average velocity difference between Ly emission and low ionization interstellar absorption is . The deconvolved Ly emission FWHM measured from a composite spectrum of the LBG sample, , is in the range of deconvolved FWHM values measured for the narrow Ly emission peaks observed in the associated DLAs. However, the FWHM values for this later category indicate two populations of Ly emission peaks, one of which is comparable to and another that is more than twice as wide as the average FWHM observed in LBGs. The Ly emission in LBGs also varies with UV luminosity: fainter galaxies have larger Ly emission equivalent widths than brighter galaxies. No such trend is identified for the associated DLAs.
The narrow Ly emission peaks revealed by associated DLAs are not systematically redshifted like those in LBGs. This, along with the symmetric emission peak profiles, is clear evidence that the emission is not significantly scattered and therefore that the emitting region is relatively void of H I gas. Ly emission features in LBGs and associated DLAs appear to have different properties. The absorbing gas that gives rise to an associated DLA is separate from the emission region.
5.4 Comparison with Lyman-Alpha Emitters

Lyman-alpha emitters (LAEs) are objects detected on the basis of their Ly emission. Their emission is primarily due to star formation, since these galaxies typically have negligible AGN activity except at the highest luminosities (Ouchi et al. 2008; Overzier et al. 2013, log erg , see). We therefore expect the luminosities for our sample of narrow Ly emission peaks detected by using DLAs as coronagraphs to be consistently higher than what is observed in LAEs, due to the AGN ionizing gas in its host galaxy. Figure 18 compares the luminosities of our narrow Ly emission peaks and a complete sample of 41 LAEs from Ouchi et al. (2008), three of which have an AGN contribution. The majority of the LAEs have a luminosity less than . Although the luminosity distributions overlap, the two populations are only 0.85% likely to come from the same distribution, based on a K-S test (Figure 18, inset). Ionizing radiation from the AGN increases the average luminosity of Ly emission in our sample beyond what is typically observed in LAEs. However, the luminosity distribution overlap indicates that the covering factor is significant for the NLR in approximately half of the quasar host galaxies in our sample with narrow Ly emission detected. This favors the idea that the majority of associated DLAs () are extended and probably due to galaxies neighboring the quasar host. Only the most luminous Ly emission peaks, where the high luminosity implies a low covering factor for the NLR, support the idea of compact associated DLAs.
5.5 Comparison with Radio Galaxies
Radio galaxies are known to be surrounded by extended Ly nebulosities (van Breugel et al. 2006). The AGN is hidden, and consequently most of the emission is from surrounding gas ionized by the central AGN. Some radio galaxies also exhibit Ly absorption but with H I column densities lower than those in our sample (Rottgering et al. 1995). We therefore compare the Ly emission detected in our sample to that of 61 radio galaxies from the De Breuck et al. (2000) sample. The luminosities from our sample coincide in part with the luminosity distribution for radio galaxies, overlapping at moderate luminosities. However, the radio galaxy luminosities extend well beyond even the highest luminosity Ly emission peak detected in our sample (Figure 18). It is not surprising that the radio galaxies have Ly luminosities that surpass the luminosities we measure from narrow Ly emission in quasar host galaxies, since the radio jet sends a huge amount of energy across several tens of kiloparsecs and provokes far-ranging Ly emission. In quasar host galaxies, the AGN influence is predominantly at the heart of the galaxy in the NLR.
6 DLAs with partial coverage


If the DLA does not cover the whole BLR entirely, then some residual flux (apart from the narrow Ly emission) could be seen in the bottom of the Ly trough. Estimating the exact value of the spectral flux density in the DLA trough is difficult, since the zero-level is not well-defined in SDSS spectra (Pâris et al. 2011; Pâris et al. 2012).
In a few specific cases, however, we are able to demonstrate that some residual flux is indeed present and not due to data calibration errors. The covering factor appears to be less than one for several associated DLAs. The troughs of three DLAs with detected narrow Ly emission are well-above zero at their bottoms, while their associated Ly absorptions are consistent with zero within errors (Figure 19). The bottoms of the DLA troughs are flat, even though they are not at zero. Some BLR flux is probably transmitted, raising the spectral flux density level in the DLA and Ly absorptions. However, since the BLR Ly flux is more than five times weaker than the Ly flux (Vanden Berk et al. 2001), this effect on the Ly absorption is lost in the noise. If the non-zero DLA trough were due to quasar continuum emission, which follows a power law, we would expect the Ly absorption to also be clearly above zero. The observations indicate that the covering factor is less than one for these DLAs.
Alternatively, if the BLR is fully covered, the residual flux could be continuum emission from the quasar host galaxy. Indeed, Zafar et al. (2011) suggest that this possibility could account for the trough of the associated DLA towards Q0151+048A not going to zero.
In the most striking example towards SDSS J0148+1412, an intervening DLA with a trough at zero occurs along the same line-of-sight as an associated DLA with a trough distinctly above zero (Figure 20). Remarkably, both the intervening and the associated DLA show narrow Ly emission. The line-of-sight towards SDSS J1635+1634 (Figure 21) also has an associated and an intervening DLA, separated by only 5 025 . However, no narrow Ly emission is detected in either DLA trough. Again, the bottom of the intervening DLA trough is at zero, while the associated DLA trough is slightly above the zero-level. If this offset in the associated DLA flux is due to partial coverage, we would expect to also detect narrow Ly emission. Potentially, the covering factor is one and the flux from the lower-redshift galaxy creates the small zero-level offset in the associated DLA. Another explanation could be that the quasar has no detectable Ly emission.
Partial coverage of absorption systems is an interesting phenomenon that can constrain the relative sizes of the foreground and background objects (Balashev et al. 2011, see e.g.,). The absorber radius, , along with the column density, can then be used to estimate the H I number density, , assuming a spherical absorber: . The average H I column density for the associated DLAs with detected narrow Ly emission is . If the DLA absorber is on the order of 10 - 100 pc, then . For smaller-sized absorbers, we could expect to find gas, since it occurs in systems with (Srianand et al. 2005). However, due to the low resolution and S/N in SDSS spectra, only rare systems with column density log N can be detected (Balashev et al., in prep).


7 Discussion and Conclusions
Thanks to the large number of z > 2 quasar lines-of-sight surveyed with SDSS-III BOSS, we have uncovered an unprecedented sample of strong associated DLAs that reveal narrow Ly emission superimposed in their troughs. The number of associated DLAs in our statistical sample exceeds the anticipated number calculated from the distribution function by . This overdensity of DLAs is consistent with expectations based on what we know about galaxy clustering.
We propose that when no narrow Ly emission is detected in the trough of an associated DLA the absorber is a galaxy near to the quasar host, and when the absorber blocks the 1 pc BLR without also obscuring the extended Ly emission the associated DLA arises from dense clouds of H I gas in the quasar host galaxy. However, efforts to distinguish two populations of DLA sources from the statistical sample are inconclusive. DLAs with the largest and have no Ly emission, but this trend does not hold for and . The low resolution and S/N of BOSS spectra limits our ability to investigate this issue. With higher resolution and higher S/N spectra, we would be able to measure the column densities and study properties, such as the depletion, in greater detail.
Geometrical effects between the quasar host and a nearby galaxy could produce a configuration that transmits the narrow Ly emission. Potentially, the weakest narrow Ly emission occurs when the absorber is a nearby galaxy and the strongest narrow Ly emission occurs when the absorber is an H I cloud associated with the galactic environment. A continuum of such configurations would explain the lack of distinct characteristics for the two absorber populations.
Additionally, the NLR may be significantly extended in quasar host galaxies, beyond 10 kpc (Netzer et al. 2004; Hainline et al. 2013). Zafar et al. (2011) determined that a Ly blob located more than kpc from Q0151+048A is both the source of Ly emission in the DLA trough and associated with the quasar host galaxy. With long slit spectroscopy, we could pinpoint the location of the narrow Ly emission relative to the quasar and investigate the extent of emission regions in quasar host galaxies.
The symmetrical profile of the narrow Ly emission peaks, which is strikingly different from what is seen in LBGs, supports the idea that the gas in the DLA is not directly associated with the emission region and that the H I content of this emission region is low. The line profile symmetry and lack of velocity offset for the Ly emission peak with respect to the DLA center indicate that there is not a continuous distribution of H I gas in the emission region to scatter the Ly photons.
We have compared the Ly luminosities in our sample to those of LAEs and radio galaxies. Roughly half of the narrow Ly emission peaks detected by using DLAs as coronagraphs have luminosities consistent with standard LAEs. We argue that for these quasar host galaxies the DLA is extended enough to cover most of the NLR around the AGN and reduce the luminosity to a value more typical of a star-forming galaxy. The luminosities for the other half of our narrow Ly emission peaks (25% of the total sample) are higher than what is typical for LAEs. They are comparable to, but smaller than, those of radio galaxies. This is consistent with the fact that the AGN ionizes the surrounding gas, which in turn emits Ly photons. In these cases, the DLA probably occurs in a small cloud in the host galaxy. Radio galaxies have higher luminosities, since their jets inject energy further from the center.
Partial coverage in an associated DLA with no detected narrow Ly emission raises the question of whether all quasars have a NLR, since a DLA absorber cannot leave the 1 pc BLR partially covered while simultaneously blocking emission across the entire NLR. We can potentially use BALs to investigate the possibility of quasars without emission from the NLR. Like associated DLAs, the gas clouds that create strong BALs in quasar spectra can serve as coronagraphs to obscure emission from the BLR and reveal NLR emission. The BAL clouds are located close to the central engine, so they cannot extend more than marginally into the NLR.
The difficulty with using BALs as coronagraphs, however, is that the spectral flux density in their H I troughs seldom goes to zero, either because the optical depth is not high enough or because the cloud does not cover the BLR completely. We have searched for the very rare ideal occurrences where it is possible to measure Ly flux from the NLR in a BAL trough. Figure 22 gives an example of a BAL quasar (SDSS J111629.37+320511.5) where no emission is detected. We identify the minimum possible quasar redshift from the C III] emission peak and limit the maximum to five times the typical blueshift for quasar C III] emission peaks, 300 (Pâris et al. 2012). The small rise in flux density at 4480 Å corresponds to the transition between the N V and Ly BAL troughs (Figure 23) and is unlikely to be narrow Ly emission. This BAL quasar provides definite evidence that no Ly emission is detected from the NLR of some quasars.
Before further speculating about this intriguing fact, we must check if [O III] emission is present in the BAL quasar spectra that lack narrow Ly emission. X-shooter (Vernet et al. 2011) on the VLT would be the ideal instrument for obtaining additional spectroscopic data, since its wavelength coverage extends from the ultraviolet to the near-infrared.
Definitively interpreting why some associated DLAs reveal narrow Ly emission while others do not is not possible with low-resolution spectra. Future observations with an Integral Field Unit (IFU) or higher resolution spectra taken with multiple position angles for each quasar are essential to make progress in this domain. Associated DLAs with narrow Ly emission potentially offer a unique probe of the quasar host galaxy. The DLA provides a measure of the gas composition in the galactic environment, while emission from the NLR can be linked to ionization. Such systems could provide important insight into the effect of AGN feedback on their host galaxies.

Acknowledgements.
We thank the anonymous referee for comments that helped to improve the article. The SDSS-III French Participation Group was supported by the Agence Nationale de la Recherche under grants ANR-08-BLAN-0222 and ANR-12-BS05-0015. Funding for SDSS-III has been provided by the Alfred P. Sloan Foundation, the Participating Institutions, the National Science Foundation, and the U.S. Department of Energy Office of Science. The SDSS-III web site is http://www.sdss3.org/. SDSS-III is managed by the Astrophysical Research Consortium for the Participating Institutions of the SDSS-III Collaboration including the University of Arizona, the Brazilian Participation Group, Brookhaven National Laboratory, University of Cambridge, Carnegie Mellon University, University of Florida, the French Participation Group, the German Participation Group, Harvard University, the Instituto de Astrofisica de Canarias, the Michigan State/Notre Dame/JINA Participation Group, Johns Hopkins University, Lawrence Berkeley National Laboratory, Max Planck Institute for Astrophysics, Max Planck Institute for Extraterrestrial Physics, New Mexico State University, New York University, Ohio State University, Pennsylvania State University, University of Portsmouth, Princeton University, the Spanish Participation Group, University of Tokyo, University of Utah, Vanderbilt University, University of Virginia, University of Washington, and Yale University.| SDSS Name a aa a aa J2000 coordinates | E(B-V) | log | Integ. Flux b bb b bb 4- upper limit on the integrated flux when no Ly emission is detected. | ||||
|---|---|---|---|---|---|---|---|
| () | |||||||
| DR9 Associated DLAs | |||||||
| Statistical Sample | |||||||
| 013654.00-005317.5 | 2.491 | -26.43 | -0.076 | 21.30 | 2.493 | … | 4.6 |
| 014858.31+141235.4 c cc c cc Additional intervening DLA along the line-of-sight | 3.172 | -27.06 | -0.022 | 21.56 | 3.181 | 3.182 | 45.2 |
| 073446.02+322205.3 | 2.314 | -26.51 | 0.029 | 21.35 | 2.308 | … | 6.5 |
| 080523.32+214921.1 | 3.487 | -28.08 | 0.032 | 21.55 | 3.477 | … | 4.3 |
| 081626.02+351055.2 | 3.073 | -26.68 | 0.033 | 21.31 | 3.071 | … | 3.4 |
| 083716.51+195025.9 | 2.262 | -24.70 | -0.036 | 21.31 | 2.271 | … | 5.2 |
| 084448.59+043504.7 | 2.367 | -26.31 | -0.058 | 21.33 | 2.379 | … | 7.5 |
| 093859.15+405257.8 | 2.172 | -25.88 | -0.015 | 21.43 | 2.176 | 2.170 | 41.1 |
| 093924.71+430246.8 | 2.722 | -25.71 | 0.014 | 21.45 | 2.717 | 2.722 | 14.5 |
| 095307.13+034933.8 | 2.599 | -26.00 | 0.025 | 22.10 | 2.592 | 2.594 | 14.1 |
| 104939.76+433533.6 | 2.505 | -25.01 | -0.022 | 21.40 | 2.514 | … | 5.1 |
| 105138.65+433921.5 | 2.670 | -26.10 | 0.002 | 22.07 | 2.665 | … | 5.3 |
| 115605.93+354538.5 | 2.125 | -24.61 | -0.042 | 21.40 | 2.126 | 2.128 | 17.5 |
| 121902.52+382822.1 | 3.012 | -26.65 | 0.083 | 21.34 | 3.012 | … | 4.4 |
| 125635.73+350604.8 | 2.237 | -25.47 | 0.008 | 22.09 | 2.238 | 2.239 | 51.0 |
| 131309.25+392456.9 | 2.446 | -25.96 | 0.043 | 21.42 | 2.447 | … | 5.5 |
| 132922.21+052014.3 | 2.999 | -26.36 | -0.006 | 21.57 | 2.994 | … | 4.2 |
| 133430.83+383819.1 | 2.176 | -25.80 | -0.028 | 21.62 | 2.181 | 2.180 | 11.6 |
| 141745.90+362127.4 | 3.338 | -25.66 | 0.056 | 22.34 | 3.338 | … | 3.0 |
| 142542.06+025701.4 | 2.199 | -25.55 | -0.046 | 21.35 | 2.205 | … | 6.0 |
| 143253.28-005837.6 | 2.530 | -26.50 | -0.042 | 21.36 | 2.537 | … | 5.5 |
| 143634.65+350553.8 | 2.212 | -25.56 | -0.032 | 21.42 | 2.220 | … | 7.1 |
| 150016.39+070609.1 | 2.367 | -26.08 | 0.024 | 21.33 | 2.379 | … | 6.9 |
| 150049.63+053320.0 | 2.392 | -26.76 | 0.085 | 21.36 | 2.398 | … | 7.3 |
| 150227.84+054853.8 | 2.753 | -26.69 | 0.037 | 21.40 | 2.738 | … | 4.6 |
| 150812.79+363530.3 | 2.097 | -25.50 | -0.046 | 21.33 | 2.106 | … | 16.1 |
| 151129.27+181138.7 | 3.120 | -25.81 | -0.020 | 21.39 | 3.134 | … | 3.9 |
| 151843.30+050808.3 | 2.436 | -26.79 | -0.025 | 21.38 | 2.441 | … | 6.5 |
| 154621.59+020102.9 | 2.821 | -28.60 | 0.002 | 21.34 | 2.810 | … | 3.3 |
| 163217.98+115524.3 | 3.101 | -26.25 | -0.049 | 21.51 | 3.092 | … | 3.3 |
| 223037.78-000531.5 | 2.407 | -26.25 | 0.039 | 21.45 | 2.412 | 2.406 | 8.1 |
| 020555.00+061849.3 | 2.223 | -25.09 | -0.084 | 20.91 | 2.223 | … | 7.5 |
| 075556.95+365658.3 | 2.935 | -25.65 | -0.081 | 21.25 | 2.973 d dd d dd fitted with , not from metals | … | 2.5 |
| 080045.73+341128.9 | 2.334 | -26.13 | -0.001 | 21.24 | 2.329 | 2.328 | 16.5 |
| 083523.26+141930.8 | 3.139 | -28.01 | -0.017 | 21.27 | 3.142 | … | 3.8 |
| 083954.59+270913.1 | 2.959 | -26.72 | -0.064 | 21.10 | 2.961 | 2.961 | 8.5 |
| 085600.89+030218.7 | 3.039 | -25.55 | -0.011 | 21.23 | 3.056 | … | 2.9 |
| 100112.40-014737.9 | 2.188 | -25.32 | -0.038 | 21.21 | 2.199 | … | 7.0 |
| 114639.00-010703.2 | 3.072 | -25.23 | -0.084 | 21.28 | 3.063 | … | 2.9 |
| 115656.97+024619.8 | 2.377 | -25.11 | -0.017 | 21.28 | 2.383 | … | 8.3 |
| 121716.25+012139.1 | 3.388 | -26.34 | -0.033 | 21.13 | 3.370 | … | 4.0 |
| 135138.57+352338.8 | 2.078 | -25.97 | 0.035 e ee e ee An LMC, rather than SMC, reddening law may be preferred in this case. | 21.26 | 2.074 | … | 10.4 |
| 145155.59+295311.7 | 2.185 | -25.50 | 0.013 | 21.18 | 2.169 | … | 9.0 |
| 150806.90+283835.4 | 2.341 | -25.39 | -0.023 | 21.15 | 2.341 | … | 7.1 |
| 152243.24+065138.2 | 2.146 | -26.46 | 0.018 | 21.25 | 2.148 | … | 11.3 |
| 155310.67+233013.3 | 3.022 | -27.39 | -0.001 | 21.29 | 3.023 | 3.025 | 10.7 |
| 221811.59+155420.1 | 2.294 | -25.59 | -0.023 | 20.79 | 2.302 | 2.304 | 25.4 |
| 222007.76+002331.8 | 2.432 | -25.74 | 0.108 | 20.97 | 2.434 | … | 4.8 |
| 225307.84+030843.1 | 2.327 | -25.51 | 0.005 | 21.01 | 2.320 | … | 3.9 |
| 234757.96+034910.7 | 2.182 | -26.38 | -0.072 | 21.52 | 2.155 | … | 9.0 |
| Additional Associated DLAs with Ly Emission Detected | |||||||
| 005917.64+112407.7 | 3.030 | -26.66 | 0.015 | 21.65 | 3.034 | 3.039 | 10.4 |
| 011226.76-004855.8 | 2.137 | -25.25 | -0.016 | 21.82 | 2.150 | 2.148 | 64.7 |
| 082303.22+052907.6 | 3.188 | -25.97 | 0.090 | 21.61 | 3.191 | 3.193 | 66.4 |
| 083300.07+233538.5 | 2.459 | -26.17 | 0.116 | 21.95 | 2.460 | 2.450 | 50.7 |
| 091137.46+225821.4 | 2.185 | -25.82 | 0.000 | 21.51 | 2.188 | 2.190 | 9.0 |
| 103124.70+154118.1 | 2.151 | -25.77 | 0.038 | 21.44 | 2.155 | 2.156 | 141.7 |
| 105823.73+031524.4 | 2.301 | -25.00 | -0.068 | 21.79 | 2.293 | 2.305 | 27.1 |
| 112829.38+151826.5 | 2.246 | -26.43 | 0.076 | 21.59 | 2.251 | 2.245 | 56.9 |
| 115432.67-021538.0 | 2.187 | -24.94 | -0.078 | 21.79 | 2.186 | 2.184 | 46.2 |
| 125302.00+100742.3 | 3.023 | -27.04 | -0.000 | 21.24 | 3.032 | 3.031 | 23.5 |
| 132303.48+273301.9 | 2.625 | -27.46 | -0.003 | 21.36 | 2.631 | 2.630 | 49.4 |
| 150217.33+084715.4 | 2.264 | -25.40 | 0.084 | 21.21 | 2.264 | 2.267 | 9.3 |
| 225918.46-014534.8 | 2.508 | -26.10 | -0.030 | 21.62 | 2.502 | 2.509 | 215.9 |
| 230709.81+020843.0 | 2.157 | -25.00 | 0.000 | 21.80 | 2.165 | 2.164 | 11.9 |
| Additional Associated DLA with No Detected Ly Emission (Figure 21) | |||||||
| 163538.57+163436.9 c cc c cc Additional intervening DLA along the line-of-sight | 3.019 | -28.63 | -0.005 | 20.91 | 3.024 | … | 3.4 |
landscape
| SDSS Name | b bb b bb For systems with multiple components, is the weighted average of the absorption redshifts. | C II – 1334 | Si II – 1526 | Al II – 1670 | Fe II – 2344 | ||||||||
|---|---|---|---|---|---|---|---|---|---|---|---|---|---|
| Fit () | () | Err () | Fit () | () | Err () | Fit () | () | Err () | Fit () | () | Err () | ||
| DR9 Associated DLAs | |||||||||||||
| Statistical Sample | |||||||||||||
| 013654.00-005317.5 | 2.493 | 2.198 | 2.252 | 0.103 | 1.882 | 1.992 | 0.084 | 2.040 | 2.051 | 0.161 | 2.625 | 2.600 | 0.258 |
| 014858.31+141235.4 | 3.181 | … | … | … | 1.384 | 1.224 | 0.089 | 1.379 | 1.318 | 0.107 | 2.323 | 3.020 | 0.246 |
| 073446.02+322205.3 | 2.308 | 2.292 | 2.106 | 0.099 | 1.759 | 1.473 | 0.080 | 2.194 | 2.665 | 0.094 | 2.229 | 2.014 | 0.190 |
| 080523.32+214921.1 | 3.477 | 1.511 | 1.560 | 0.081 | 1.163 | 0.984 | 0.069 | 0.906 | 1.037 | 0.091 | … | … | … |
| 081626.02+351055.2 | 3.071 | 0.494 | 0.760 | 0.114 | 0.534 | 0.565 | 0.112 | 0.262 | 0.324 | 0.118 | 0.192 | 0.365 | 0.452 |
| 083716.51+195025.9 | 2.271 | 0.997 | 1.044 | 0.327 | 0.799 | 0.902 | 0.195 | 0.854 | 1.241 | 0.549 | 2.477 | 1.916 | 1.115 |
| 084448.59+043504.7 | 2.379 | 0.249 | 0.161 | 0.099 | 0.378 | 0.436 | 0.087 | 0.380 | 0.337 | 0.122 | 0.881 | 1.368 | 0.251 |
| 093859.15+405257.8 | 2.176 | 0.546 | 0.576 | 0.109 | 0.437 | 0.452 | 0.084 | 0.563 | 0.542 | 0.111 | 0.641 | 0.676 | 0.180 |
| 093924.71+430246.8 | 2.717 | 0.713 | 0.777 | 0.240 | 0.765 | 0.826 | 0.215 | 0.132 | 0.208 | 0.316 | 0.242 | 0.605 | 0.688 |
| 095307.13+034933.8 | 2.592 | 1.254 | 1.520 | 0.157 | 1.457 | 1.419 | 0.124 | 1.387 | 1.478 | 0.223 | 1.359 | 0.726 | 0.340 |
| 104939.76+433533.6 | 2.514 | 0.556 | 0.878 | 0.272 | 0.407 | 0.288 | 0.169 | 0.412 | 0.710 | 0.496 | 0.786 | 2.066 | 0.612 |
| 105138.65+433921.5 | 2.665 | 0.586 | 0.903 | 0.134 | 0.736 | 1.115 | 0.109 | 0.480 | 0.828 | 0.225 | 1.453 | 1.433 | 0.272 |
| 115605.93+354538.5 | 2.126 | 2.530 | 2.561 | 0.118 | 1.274 | 1.269 | 0.089 | 1.537 | 1.626 | 0.127 | 1.215 | 1.865 | 0.232 |
| 121902.52+382822.1 | 3.012 | … | 2.783 | 0.111 | 1.930 | 2.018 | 0.143 | 1.927 | 1.843 | 0.150 | 2.279 | 1.977 | 0.694 |
| 125635.73+350604.8 | 2.238 | … | 1.181 | 0.119 | 0.774 | 0.737 | 0.096 | 0.741 | 0.472 | 0.120 | 1.175 | 1.174 | 0.226 |
| 131309.25+392456.9 | 2.447 | 1.896 | 1.944 | 0.190 | 2.663 | 2.727 | 0.116 | 1.551 | 1.580 | 0.191 | 1.411 | 1.233 | 0.376 |
| 132922.21+052014.3 | 2.994 | 2.184 | 2.048 | 0.132 | 1.881 | 1.930 | 0.130 | 1.824 | 1.797 | 0.137 | 2.385 | 3.842 | 1.271 |
| 133430.83+383819.1 | 2.181 | 0.392 | 0.454 | 0.077 | 0.271 | 0.329 | 0.067 | 0.184 | 0.267 | 0.084 | 0.300 | 0.321 | 0.138 |
| 141745.90+362127.4 | 3.338 | 1.413 | 1.478 | 0.287 | 1.289 | 1.334 | 0.185 | 1.592 | 1.803 | 0.484 | … | … | … |
| 142542.06+025701.4 | 2.205 | 0.908 | 0.954 | 0.147 | 1.141 | 1.233 | 0.096 | 0.687 | 0.701 | 0.171 | 1.711 | 1.932 | 0.468 |
| 143253.28-005837.6 | 2.537 | 1.098 | 1.244 | 0.078 | 0.884 | 0.726 | 0.064 | 0.701 | 0.652 | 0.113 | 1.351 | 1.139 | 0.179 |
| 143634.65+350553.8 | 2.220 | 0.459 | 0.594 | 0.130 | 0.599 | 0.724 | 0.086 | 0.539 | 0.508 | 0.116 | 0.557 | 0.568 | 0.245 |
| 150016.39+070609.1 | 2.379 | 2.572 | 2.429 | 0.169 | 1.774 | 1.702 | 0.121 | 1.951 | 2.077 | 0.184 | 1.285 | 3.312 | 0.541 |
| 150049.63+053320.0 | 2.398 | 2.192 | 2.635 | 0.114 | 1.864 | 1.912 | 0.062 | 1.990 | 2.080 | 0.093 | 2.273 | 2.801 | 0.166 |
| 150227.84+054853.8 | 2.738 | 0.693 | 0.705 | 0.111 | 0.786 | 0.860 | 0.101 | 0.616 | 0.533 | 0.141 | 1.046 | -0.150 | 0.168 |
| 150812.79+363530.3 | 2.106 | 0.357 | 0.460 | 0.120 | 0.243 | 0.181 | 0.087 | 0.168 | 0.155 | 0.097 | 0.537 | 0.300 | 0.191 |
| 151129.27+181138.7 | 3.134 | 0.643 | 0.649 | 0.229 | 0.495 | 0.288 | 0.193 | 0.669 | 0.621 | 0.285 | 0.156 | 1.131 | 0.631 |
| 151843.30+050808.3 | 2.441 | 0.903 | 1.009 | 0.062 | 0.958 | 1.014 | 0.087 | 0.855 | 0.895 | 0.065 | 1.371 | 1.473 | 0.138 |
| 154621.59+020102.9 | 2.810 | 0.648 | 0.720 | 0.035 | 0.654 | 0.644 | 0.038 | 0.743 | 0.809 | 0.050 | 1.077 | 0.977 | 0.085 |
| 163217.98+115524.3 | 3.092 | 1.319 | 2.150 | 0.249 | 1.219 | 1.969 | 0.168 | 0.398 | 2.005 | 0.268 | 1.286 | -0.153 | 1.541 |
| 223037.78-000531.5 | 2.412 | 0.896 | 1.117 | 0.141 | 0.680 | 0.589 | 0.105 | 0.772 | 0.558 | 0.160 | 0.747 | 0.479 | 0.367 |
| 221811.59+155420.1 | 2.302 | … | 0.937 | 0.160 | 0.632 | 0.644 | 0.098 | 0.283 | 0.027 | 0.165 | 0.559 | 0.502 | 0.364 |
| 020555.00+061849.3 | 2.223 | 0.241 | 0.505 | 0.188 | 0.413 | 0.593 | 0.166 | 0.219 | 0.414 | 0.291 | 1.385 | 1.534 | 1.019 |
| 222007.76+002331.8 | 2.434 | 2.719 | 3.338 | 0.180 | 1.804 | 2.068 | 0.111 | 1.953 | 2.030 | 0.183 | 1.968 | 2.753 | 0.205 |
| 225307.84+030843.1 | 2.320 | 1.069 | 0.987 | 0.195 | 1.205 | 1.233 | 0.116 | 1.477 | 1.310 | 0.212 | 1.906 | 3.069 | 0.483 |
| 083954.59+270913.1 | 2.961 | 0.455 | 0.618 | 0.119 | … | … | … | 0.242 | 0.373 | 0.162 | 0.848 | 0.710 | 0.375 |
| 121716.25+012139.1 | 3.370 | 1.694 | 1.651 | 0.254 | 1.794 | 1.926 | 0.204 | 1.552 | 1.387 | 0.324 | … | … | … |
| 150806.90+283835.4 | 2.341 | 0.410 | 0.382 | 0.101 | 0.373 | 0.371 | 0.074 | 0.449 | 0.286 | 0.424 | 0.417 | 0.408 | 0.208 |
| 145155.59+295311.7 | 2.169 | 0.391 | 0.677 | 0.193 | 0.286 | 0.327 | 0.133 | 0.250 | 0.263 | 0.173 | 0.219 | 0.427 | 0.385 |
| 100112.40-014737.9 | 2.199 | 0.943 | 1.224 | 0.145 | 1.071 | 1.149 | 0.097 | 1.313 | 1.235 | 0.139 | 1.267 | 1.358 | 0.269 |
| 085600.89+030218.7 | 3.056 | 3.607 | 3.857 | 0.212 | 3.038 | 4.849 | 0.211 | 2.981 | 2.668 | 0.276 | … | … | … |
| 080045.73+341128.9 | 2.329 | 0.945 | 1.096 | 0.110 | 0.781 | 0.719 | 0.074 | 0.827 | 0.900 | 0.121 | 0.808 | 0.528 | 0.199 |
| 075556.95+365658.3 c cc c cc Spectrum too noisy to identify metal absorption lines. | … | … | … | … | … | … | … | … | … | … | … | … | … |
| 152243.24+065138.2 | 2.148 | 2.031 | 2.748 | 0.103 | 1.211 | 1.071 | 0.061 | 1.159 | 1.210 | 0.082 | 1.412 | 1.397 | 0.114 |
| 135138.57+352338.8 | 2.074 | 1.517 | 1.567 | 0.114 | 1.368 | 1.428 | 0.068 | 1.514 | 1.479 | 0.081 | 2.150 | 2.190 | 0.135 |
| 083523.26+141930.8 | 3.142 | 0.725 | 0.778 | 0.045 | 0.701 | 0.685 | 0.041 | 0.710 | 0.675 | 0.054 | 1.050 | 0.565 | 0.197 |
| 114639.00-010703.2 | 3.063 | 0.893 | 1.108 | 0.283 | 0.467 | 1.328 | 0.379 | 0.414 | 0.805 | 0.420 | … | … | … |
| 115656.97+024619.8 | 2.383 | 1.303 | 1.551 | 0.180 | 1.052 | 0.983 | 0.111 | 1.357 | 1.401 | 0.197 | 0.513 | 1.172 | 0.346 |
| 155310.67+233013.3 | 3.023 | 0.205 | 0.191 | 0.084 | 0.188 | 0.239 | 0.079 | 0.287 | 0.286 | 0.080 | 0.331 | 0.378 | 0.212 |
| 234757.96+034910.7 | 2.155 | 1.583 | 1.813 | 0.082 | 1.395 | 1.336 | 0.072 | 1.307 | 1.305 | 0.076 | 2.042 | 1.825 | 0.238 |
| Additional Associated DLAs with Ly Emission Detected | |||||||||||||
| 005917.64+112407.7 | 3.034 | 1.014 | 1.375 | 0.129 | 0.803 | 0.656 | 0.158 | 0.820 | 0.786 | 0.127 | 1.381 | 1.490 | 0.554 |
| 011226.76-004855.8 | 2.150 | 0.626 | 1.116 | 0.294 | 0.714 | 0.906 | 0.180 | 0.667 | 0.820 | 0.289 | 0.415 | -0.096 | 0.614 |
| 082303.22+052907.6 | 3.191 | 2.666 | 2.809 | 0.328 | 1.569 | 1.683 | 0.197 | 2.479 | 2.108 | 0.281 | … | … | … |
| 083300.07+233538.5 | 2.460 | 1.066 | 1.350 | 0.206 | … | … | … | 1.239 | 1.251 | 0.201 | 1.501 | 1.349 | 0.199 |
| 091137.46+225821.4 | 2.188 | 1.853 | 1.806 | 0.119 | 1.307 | 1.367 | 0.081 | 1.007 | 0.918 | 0.133 | 0.791 | 1.057 | 0.315 |
| 103124.70+154118.1 | 2.155 | 1.342 | 2.089 | 0.158 | 1.022 | 0.922 | 0.104 | 1.115 | 1.189 | 0.120 | 1.124 | 1.388 | 0.247 |
| 105823.73+031524.4 | 2.293 | 0.580 | 1.138 | 0.279 | 0.420 | 0.771 | 0.245 | … | … | … | 0.887 | 3.283 | 0.776 |
| 112829.38+151826.5 | 2.251 | 3.052 | 3.148 | 0.096 | 2.547 | 2.382 | 0.067 | 2.353 | 2.379 | 0.087 | 2.631 | 2.325 | 0.288 |
| 115432.67-021538.0 | 2.186 | … | 2.186 | 0.248 | 0.200 | 0.672 | 0.309 | 0.563 | 0.661 | 0.350 | 0.074 | -0.163 | 1.063 |
| 125302.00+100742.3 | 3.032 | 0.992 | 1.376 | 0.124 | 0.723 | 0.587 | 0.105 | 0.741 | 0.718 | 0.122 | 0.804 | 0.905 | 0.283 |
| 132303.48+273301.9 | 2.631 | 0.284 | 0.462 | 0.044 | 0.310 | 0.364 | 0.040 | 0.381 | 0.312 | 0.061 | 0.494 | 0.377 | 0.081 |
| 150217.33+084715.4 | 2.264 | 0.822 | 1.475 | 0.238 | 0.943 | 0.933 | 0.161 | 0.867 | 0.969 | 0.188 | 1.400 | 0.696 | 0.397 |
| 225918.46-014534.8 | 2.502 | … | 2.388 | 0.106 | 1.959 | 1.788 | 0.089 | 1.996 | 1.872 | 0.134 | 2.421 | 1.963 | 0.465 |
| 230709.81+020843.0 | 2.165 | 1.340 | 2.085 | 0.358 | 0.980 | 1.437 | 0.423 | 4.088 | 4.363 | 0.310 | 1.623 | 1.612 | 0.967 |
| Additional Associated DLA with No Detected Ly Emission (Figure 21) | |||||||||||||
| 163538.57+163436.9 | 3.024 | 0.270 | 0.255 | 0.030 | 0.215 | 0.182 | 0.029 | 0.225 | 0.200 | 0.031 | 0.424 | 0.781 | 0.082 |
References
- Adelman-McCarthy et al. (2007) Adelman-McCarthy, J. K., Agüeros, M. A., Allam, S. S., et al. 2007, ApJS, 172, 634
- Ahn et al. (2013) Ahn, C. P., Alexandroff, R., Allende Prieto, C., et al. 2013, ArXiv e-prints
- Ahn et al. (2012) Ahn, C. P., Alexandroff, R., Allende Prieto, C., et al. 2012, ApJS, 203, 21
- Bahcall & Peebles (1969) Bahcall, J. N. & Peebles, P. J. E. 1969, ApJ, 156, L7
- Balashev et al. (2011) Balashev, S. A., Petitjean, P., Ivanchik, A. V., et al. 2011, MNRAS, 418, 357
- Bolton et al. (2012) Bolton, A. S., Schlegel, D. J., Aubourg, É., et al. 2012, AJ, 144, 144
- Cattaneo et al. (2009) Cattaneo, A., Faber, S. M., Binney, J., et al. 2009, Nature, 460, 213
- Croom et al. (2005) Croom, S. M., Boyle, B. J., Shanks, T., et al. 2005, MNRAS, 356, 415
- Davis et al. (2012) Davis, T. A., Krajnović, D., McDermid, R. M., et al. 2012, MNRAS, 426, 1574
- Dawson et al. (2013) Dawson, K. S., Schlegel, D. J., Ahn, C. P., et al. 2013, AJ, 145, 10
- De Breuck et al. (2000) De Breuck, C., Röttgering, H., Miley, G., van Breugel, W., & Best, P. 2000, A&A, 362, 519
- D’Odorico et al. (2004) D’Odorico, V., Cristiani, S., Romano, D., Granato, G. L., & Danese, L. 2004, MNRAS, 351, 976
- Eisenstein et al. (2011) Eisenstein, D. J., Weinberg, D. H., Agol, E., et al. 2011, AJ, 142, 72
- Ellison et al. (2010) Ellison, S. L., Prochaska, J. X., Hennawi, J., et al. 2010, MNRAS, 406, 1435
- Ellison et al. (2011) Ellison, S. L., Prochaska, J. X., & Mendel, J. T. 2011, MNRAS, 412, 448
- Ellison et al. (2002) Ellison, S. L., Yan, L., Hook, I. M., et al. 2002, A&A, 383, 91
- Fabian (2012) Fabian, A. C. 2012, ARA&A, 50, 455
- Fabian et al. (2006) Fabian, A. C., Celotti, A., & Erlund, M. C. 2006, MNRAS, 373, L16
- Falomo et al. (2008) Falomo, R., Treves, A., Kotilainen, J. K., Scarpa, R., & Uslenghi, M. 2008, ApJ, 673, 694
- Ferrarese & Merritt (2000) Ferrarese, L. & Merritt, D. 2000, ApJ, 539, L9
- Floyd et al. (2013) Floyd, D. J. E., Dunlop, J. S., Kukula, M. J., et al. 2013, MNRAS, 429, 2
- Font-Ribera et al. (2013) Font-Ribera, A., Arnau, E., Miralda-Escudé, J., et al. 2013, ArXiv e-prints
- Fukugita et al. (1996) Fukugita, M., Ichikawa, T., Gunn, J. E., et al. 1996, AJ, 111, 1748
- Gebhardt et al. (2000) Gebhardt, K., Bender, R., Bower, G., et al. 2000, ApJ, 539, L13
- Gordon et al. (2003) Gordon, K. D., Clayton, G. C., Misselt, K. A., Landolt, A. U., & Wolff, M. J. 2003, ApJ, 594, 279
- Goto et al. (2009) Goto, T., Utsumi, Y., Furusawa, H., Miyazaki, S., & Komiyama, Y. 2009, MNRAS, 400, 843
- Graham et al. (2011) Graham, A. W., Onken, C. A., Athanassoula, E., & Combes, F. 2011, MNRAS, 412, 2211
- Guimarães et al. (2007) Guimarães, R., Petitjean, P., Rollinde, E., et al. 2007, MNRAS, 377, 657
- Gültekin et al. (2009) Gültekin, K., Richstone, D. O., Gebhardt, K., et al. 2009, ApJ, 698, 198
- Gunn et al. (1998) Gunn, J. E., Carr, M., Rockosi, C., et al. 1998, AJ, 116, 3040
- Gunn et al. (2006) Gunn, J. E., Siegmund, W. A., Mannery, E. J., et al. 2006, AJ, 131, 2332
- Hainline et al. (2013) Hainline, K. N., Hickox, R. C., Greene, J. E., Myers, A. D., & Zakamska, N. L. 2013, ArXiv e-prints
- Hennawi et al. (2009) Hennawi, J. F., Prochaska, J. X., Kollmeier, J., & Zheng, Z. 2009, ApJ, 693, L49
- Komatsu et al. (2011) Komatsu, E., Smith, K. M., Dunkley, J., et al. 2011, ApJS, 192, 18
- Kotilainen et al. (2013) Kotilainen, J., Falomo, R., Bettoni, D., Karhunen, K., & Uslenghi, M. 2013, ArXiv e-prints
- Krogager et al. (2012) Krogager, J.-K., Fynbo, J. P. U., Møller, P., et al. 2012, MNRAS, 424, L1
- Lutz et al. (2008) Lutz, D., Sturm, E., Tacconi, L. J., et al. 2008, ApJ, 684, 853
- Márquez et al. (2001) Márquez, I., Petitjean, P., Théodore, B., et al. 2001, A&A, 371, 97
- McConnell & Ma (2013) McConnell, N. J. & Ma, C.-P. 2013, ApJ, 764, 184
- Møller & Warren (1993) Møller, P. & Warren, S. J. 1993, A&A, 270, 43
- Møller et al. (1998) Møller, P., Warren, S. J., & Fynbo, J. U. 1998, A&A, 330, 19
- Netzer et al. (2004) Netzer, H., Shemmer, O., Maiolino, R., et al. 2004, ApJ, 614, 558
- Noterdaeme et al. (2012a) Noterdaeme, P., Laursen, P., Petitjean, P., et al. 2012a, A&A, 540, A63
- Noterdaeme et al. (2012b) Noterdaeme, P., Petitjean, P., Carithers, W. C., et al. 2012b, A&A, 547, L1
- Omont et al. (1996) Omont, A., Petitjean, P., Guilloteau, S., et al. 1996, Nature, 382, 428
- Ouchi et al. (2008) Ouchi, M., Shimasaku, K., Akiyama, M., et al. 2008, ApJS, 176, 301
- Overzier et al. (2013) Overzier, R. A., Nesvadba, N. P. H., Dijkstra, M., et al. 2013, ApJ, 771, 89
- Pâris et al. (2012) Pâris, I., Petitjean, P., Aubourg, É., et al. 2012, A&A, 548, A66
- Pâris et al. (2011) Pâris, I., Petitjean, P., Rollinde, E., et al. 2011, A&A, 530, A50
- Peng et al. (2006a) Peng, C. Y., Impey, C. D., Ho, L. C., Barton, E. J., & Rix, H.-W. 2006a, ApJ, 640, 114
- Peng et al. (2006b) Peng, C. Y., Impey, C. D., Rix, H.-W., et al. 2006b, ApJ, 649, 616
- Petitjean et al. (1996) Petitjean, P., Pécontal, E., Valls-Gabaud, D., & Chariot, S. 1996, Nature, 380, 411
- Petitjean et al. (1994) Petitjean, P., Rauch, M., & Carswell, R. F. 1994, A&A, 291, 29
- Pettini et al. (1995) Pettini, M., Hunstead, R. W., King, D. L., & Smith, L. J. 1995, in QSO Absorption Lines, ed. G. Meylan, 55
- Rauch et al. (2013) Rauch, M., Becker, G. D., Haehnelt, M. G., Carswell, R. F., & Gauthier, J.-R. 2013, ArXiv e-prints
- Richards et al. (2006) Richards, G. T., Strauss, M. A., Fan, X., et al. 2006, AJ, 131, 2766
- Ross et al. (2012) Ross, N. P., Myers, A. D., Sheldon, E. S., et al. 2012, ApJS, 199, 3
- Rottgering et al. (1995) Rottgering, H. J. A., Hunstead, R. W., Miley, G. K., van Ojik, R., & Wieringa, M. H. 1995, MNRAS, 277, 389
- Shapley et al. (2003) Shapley, A. E., Steidel, C. C., Pettini, M., & Adelberger, K. L. 2003, ApJ, 588, 65
- Smee et al. (2012) Smee, S., Gunn, J. E., Uomoto, A., et al. 2012, ArXiv e-prints
- Srianand et al. (2005) Srianand, R., Petitjean, P., Ledoux, C., Ferland, G., & Shaw, G. 2005, MNRAS, 362, 549
- Tapken et al. (2007) Tapken, C., Appenzeller, I., Noll, S., et al. 2007, A&A, 467, 63
- van Breugel et al. (2006) van Breugel, W., de Vries, W., Croft, S., et al. 2006, Astronomische Nachrichten, 327, 175
- Vanden Berk et al. (2001) Vanden Berk, D. E., Richards, G. T., Bauer, A., et al. 2001, AJ, 122, 549
- Vernet et al. (2011) Vernet, J., Dekker, H., D’Odorico, S., et al. 2011, A&A, 536, A105
- Wagg et al. (2012) Wagg, J., Wiklind, T., Carilli, C. L., et al. 2012, ApJ, 752, L30
- Wang, R. et al. (2013) Wang, R., Wagg, J., Carilli, C. L., et al. 2013, ArXiv e-prints
- Wang, Y. P. et al. (2013) Wang, Y. P., Yamada, T., Tanaka, I., Iye, M., & Ji, T. 2013, ArXiv e-prints
- Welty et al. (1999) Welty, D. E., Hobbs, L. M., Lauroesch, J. T., et al. 1999, ApJS, 124, 465
- Weymann et al. (1991) Weymann, R. J., Morris, S. L., Foltz, C. B., & Hewett, P. C. 1991, ApJ, 373, 23
- Wild et al. (2008) Wild, V., Kauffmann, G., White, S., et al. 2008, MNRAS, 388, 227
- Willott et al. (2011) Willott, C. J., Chet, S., Bergeron, J., & Hutchings, J. B. 2011, AJ, 142, 186
- Willott et al. (2013) Willott, C. J., Omont, A., & Bergeron, J. 2013, ArXiv e-prints
- Wootten & Thompson (2009) Wootten, A. & Thompson, A. R. 2009, IEEE Proceedings, 97, 1463
- York et al. (2000) York, D. G., Adelman, J., Anderson, Jr., J. E., et al. 2000, AJ, 120, 1579
- Zafar et al. (2011) Zafar, T., Møller, P., Ledoux, C., et al. 2011, A&A, 532, A51