75282
S. A. Levshakov
Limits on the space-time variations of fundamental constants
Abstract
We report on new tests that improve our previous (2009-2010) estimates of the electron-to-proton mass ratio variation, . Subsequent observations (2011-2013) at the Effelsberg 100-m telescope of a sample of eight molecular cores from the Milky Way disk reveal systematic errors in the measured radial velocities varying with an amplitude during the exposure time. The averaged offset between the radial velocities of the rotational transitions of HC3N(2-1), HC5N(9-8), HC7N(16-15), HC7N(21-20), and HC7N(23-22), and the inversion transition of NH3(1,1) gives [ confidence level (C.L.)]. This value, when interpreted in terms of , constraints the -variation at the level of ( C.L.), which is the most stringent limit on the fractional changes in based on radio astronomical observations.
keywords
Line: profiles – ISM: molecules – Radio lines: ISM – Techniques: radial velocities – elementary particles1 Introduction
This study is aimed to test whether dimensionless physical constants are really constants, or whether they vary with space and time. The latter would imply, at some level, a violation of the Einstein equivalence principle (EEP), i.e., local position invariance (LPI) and local Lorentz invariance (LLI), as suggested in a number of unification theories (for reviews, see Uzan 2011; Liberati 2013). In particular, LPI postulates that the outcome of any local nongravitational experiment is independent of where and when it is performed, i.e., that the fundamental physical laws are space-time invariant. Experimental validation of EEP is one of the most important topics of modern physics allowing us to probe the applicability limits of the Standard Model (SM) of particle physics. At the same time, precision limits delivered from such experiments serve as restrictions for the numerous new theories beyond the SM and can help to distinguish between them.
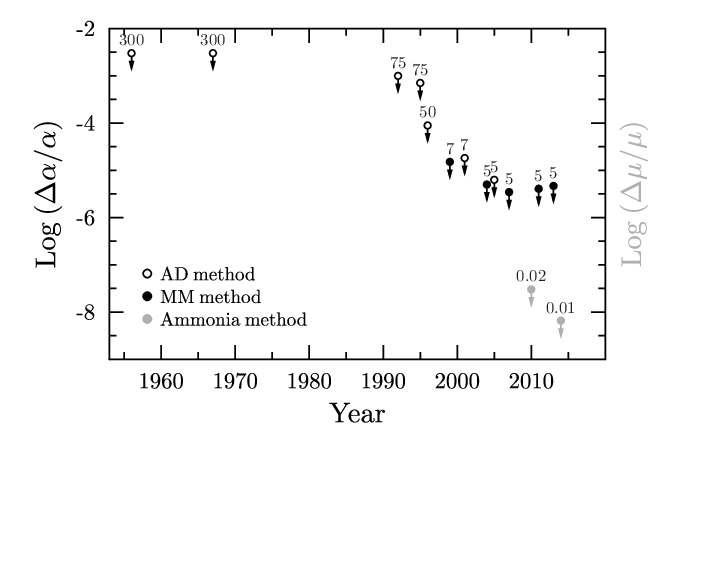
Figure 1 demonstrates how upper limits on variations of physical constants obtained from astronomical spectra just followed the available spectral resolution. Up to now, no signals have yet been detected in the range of fractional changes from to . Thus, any progress in improving the existing limits can be achieved from observations of narrow spectral lines involving higher spectral resolutions to resolve completely their profiles. At the moment, the resolution of radio telescopes exceeds that of optical facilities by order(s) of magnitude; an additional and very attractive property of microwave radio observations is that some molecular transitions from this frequency range are extremely sensitive to the putative variations of the fundamental physical constants (see a review by Kozlov & Levshakov 2013).
Flambaum & Kozlov proposed in 2007 the so-called ammonia method to test the variability of the electron-to-proton mass ratio, . Using this method for a sample of cold molecular cores from the Milky Way disk we obtained the following estimate on the spacial -variations (Levshakov et al. 2010a, 2010b): = ( C.L.). However, further studies revealed significant instrumental instabilities in the measurements of line radial velocities which were not accounted for in the above value. Thus, we performed a new set of observations of the same targets and with the same instrument (100-m Effelsberg radio telescope) in order to get an insight into this previously unknown systematics. Here we present the recent results.
2 Observations
Observations in 2011-2013 targeted a sample of nine cold (K) and dense ( cm-3) starless molecular cores located in the Milky Way disk. The selected clouds are known to have narrow molecular emission lines (full width at half maximum, FWHM ) what makes them the most suitable targets to precise measurements of relative radial velocities (RV). The following molecular transitions were observed: NH3(1,1) 23.7 GH, HC3N(2-1) 18.2 GHz, HC5N(9-8) 23.9 GHz, HC7N(16-15) 18.0 GHz, HC7N(21-20) 23.7 GHz, and HC7N(23-22) 25.9 GHz.
The source coordinates are taken from Levshakov et al. (2010b, 2013b). Observations used the Effelsberg 100-m radio telescope as described in Levshakov et al. (2010a, 2013b).
In 2011, the measurements were obtained in frequency switching (FSW) mode using a frequency throw of MHz. The backend was a fast Fourier transform spectrometer (FFTS), operated with a bandwidth of 20 MHz, which simultaneously provided 16 384 channels for each polarization. The resulting channel width was 0.015 . However, the true velocity resolution is about 1.6 times coarser.
In 2012-2013, we performed the measurements in the position switching (PSW) mode with the backend XFFTS (eXtended bandwidth FFTS) operating with 100 MHz bandwidth and providing 32 768 channels for each polarization. The resulting channel width was 0.039 , but the true velocity resolution is 1.16 times coarser (Klein et al. 2012).
3 Results
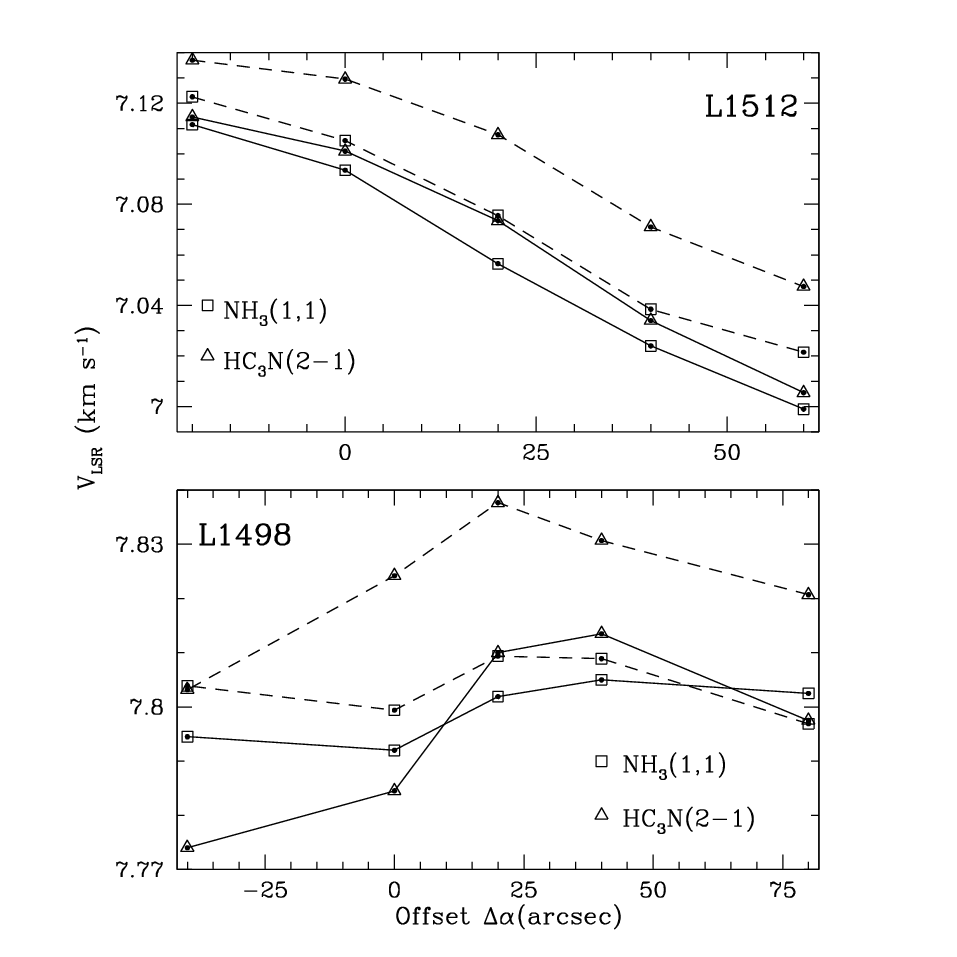
To check the reproducibility of the relative RVs of the NH3(1,1) and HC3N(2-1) lines we re-observed two molecular cores L1512 and L1498 in 2011. The procedure was the same as in 2010 observations: cores were mapped at the same offsets and in the same lines. Namely in the (1,1) inversion transition of NH3 complemented by rotational lines of other molecular species. The comparison of radial velocities of NH3 inversion lines, , with radial velocities of rotational transitions, , provides a sensitive limit to the variation of (Flambaum & Kozlov 2007):
where is the speed of light.
The measured RVs (Levshakov et al. 2010a) at different radial distances along the main diagonal cuts towards L1512 and L1498 are shown in Fig. 2. It is seen that the velocity offsets exhibit quite different behavior between 2010 and 2011, what is probably an effect of unknown systematic errors.
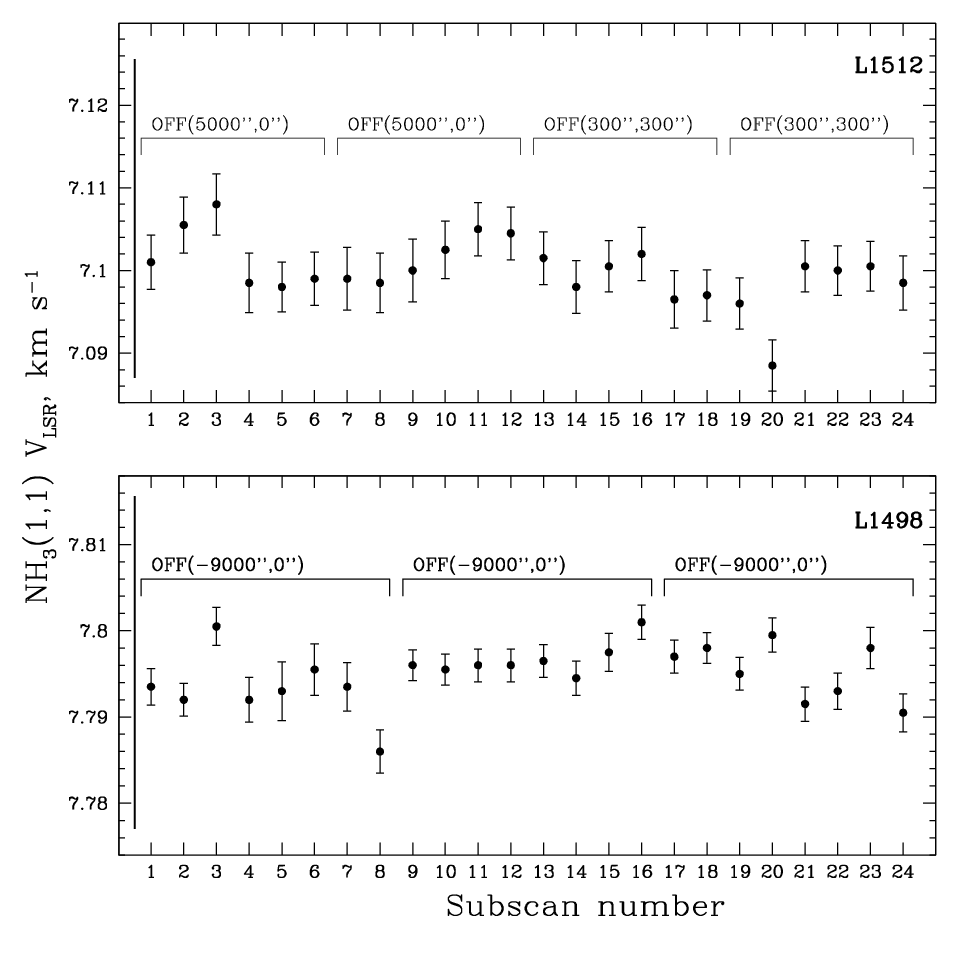
To figure out the source of these errors, we performed in 2012 a set of continuous observations of L1512 and L1498 targeting their ammonia peaks. Observing in PSW mode, we also used different OFF positions to check possible contamination from an extended background ammonia emission (which was not detected). The resulting time series are shown in Fig. 3. The RV values fluctuate with an amplitude of , i.e., of the channel width.
To check whether the sky frequency is identical with the frequency coming out of the backend we carried out a test with an artificial signal at 22000.78125 MHz. The synthesizer frequency was accurate to about 1 Hz, and the frequency scale was found to be accurate to about 32 Hz ( ).
In our observations, the sky frequencies were reset at the onset of each subscan. Therefore, the longer a subscan the higher the error caused by Doppler shifts during the exposure time (e.g., for a 5 min scan, it is about 0.004 at Effelsberg latitude). We corrected some of our observations to account for residual Doppler shifts. This didn’t show a significant change in the results, however.
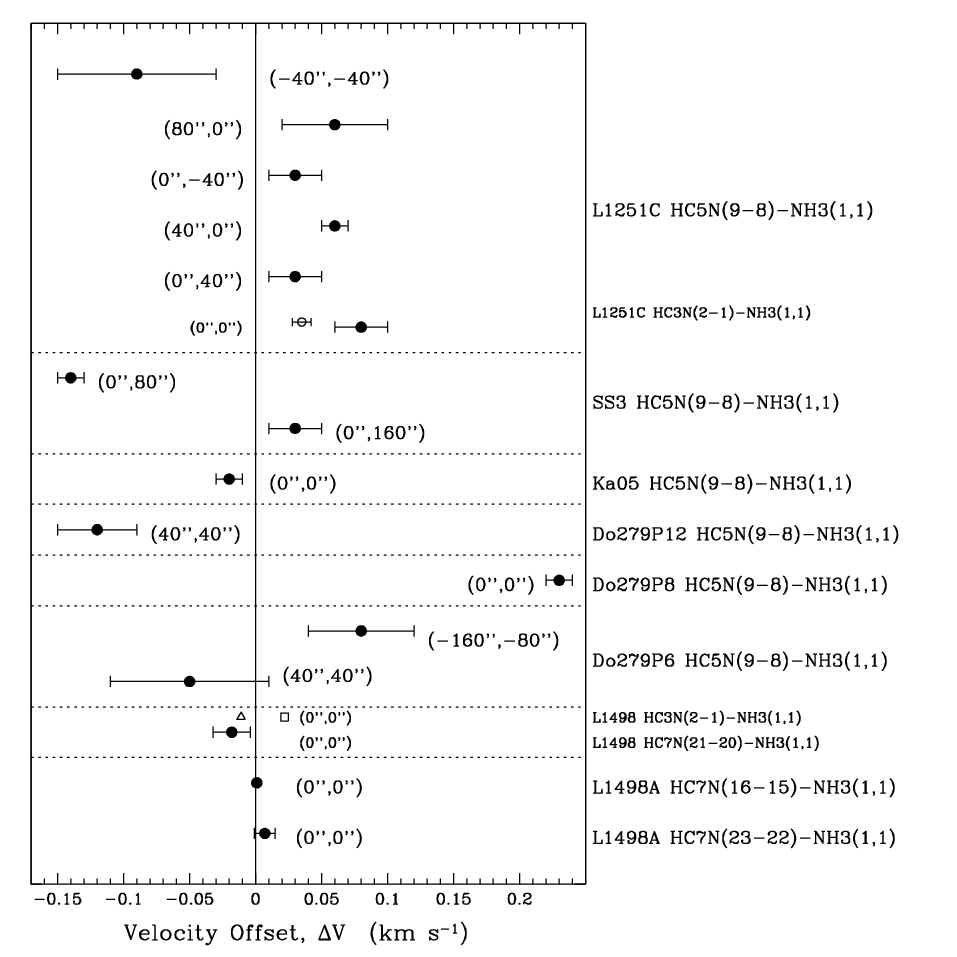
Another source of errors which can affect the estimates with the ammonia method is the possible segregation of molecules in molecular cores. Figure 4 shows our measurements in 2013 (filled circles) of the relative RVs between NH3(1,1) and other molecules towards eight molecular cores (L1498A is a gas condensation in L1498, see Fig. 3 in Kuiper et al. 1996) at different offsets. Previous values, obtained in 2009-2011, are marked by open symbols. A spread of the velocity offsets is clearly seen.
Thus, we conclude that noise in the values consists of at least two components: one is due to chemical differentiation and velocity gradients within the molecular cores, possibly being amplified by small variations in the telescope pointing. Additionally, some scatter in the RVs may be caused by the different optical depths of the hyperfine structure transitions. However, all these effects may be random from one observation to another, and, being averaged over a sample of targets, should be reduced to some extent. Applied to our sample of independent offsets shown in Fig. 4, this gives the weighted mean ( C.L.). Being interpreted in terms of , this value of constraints the -variation at the level of ( C.L.), which is the most stringent limit on the spatial variation of based on radio astronomical observations. The same order of magnitude upper limit on was obtained from independent observations of L1512 and L1498 at the Medicina 30-m telescope (Levshakov et al. 2013a).
We note in passing that mapping of the dense molecular cores in different molecular lines shows that there is, in general, a good correlation between NH3, N2H+, and HC3N distributions (Fuller & Myers 1993; Hotzel et al. 2004; Tafalla et al. 2004; Pagani et al. 2009). However, in some clouds NH3 is not traced by HC3N, as, e.g., in the dark cloud TMC-1, where peaks of line emission are offset by (Olano et al. 1988). In our case, we observe systematic velocity shifts between NH3 and other species. This can be expected since C-bearing molecules are usually distributed in the outer parts of the cores, whereas N-bearing molecules trace the inner parts.
4 Discussion
The obtained local constraint on the spatial -variation, ( C.L.), can be used to set limits on changes in . This, however, is strongly model dependent. For example, within the grand unification model (GUT) a variation of would imply considerably larger fractional changes in the mass scale of the strong force in QCD, , and in quark and electron masses leading to
where (e.g., Langacker et al. 2002; Flambaum et al. 2004). This gives a limit on ( C.L.). The value of is, however, poorly constrained. Depending on the theory, it varies from to +46 (examples are given in Section 5.3.1 in Uzan 2011). The only way to distinguish between theories is to measure and independently.
At higher redshifts, the most stringent limit on cosmological -variation was set at , (Bagdonaite et al. 2013). This would imply that ( C.L.) at epoch yr, which means in turn that yr-1. At very high redshift, (epoch 12.9 Gyr), the current limit is ( C.L.) corresponding to yr-1 (Levshakov et al. 2012). We note that most stringent limits set by the Oklo fossil reactor and by terrestrial atomic clock experiments are, respectively, yr-1 (Uzan 2011), and yr-1 (Rosenband et al. 2008). Thus, despite many efforts, the space-time variations in and have never been detected either in laboratory or astronomical experiments.
It only remains to hope that significant improvements in radio astronomical observations will allow us to probe variations of at levels of , leading to even more stringent results and eventually to the detection of a real variation.
5 Conclusions
We have used the Effelsberg 100-m telescope to observe the NH3(1,1) 23.7 GHz, HC3N(2-1) 18.2 GHz, HC5N(9-8) 23.9 GHz, HC7N(16-15) 18.0 GHz, HC7N(21-20) 23.7 GHz, and HC7N(23-22) 25.9 GHz spectral lines in high-density molecular cores devoid of associated IR sources. The results obtained are as follow.
- 1.
In order to test the reproducibility of the measurements of the relative radial velocities between the NH3(1,1) and HC3N(2-1) transitions observed towards dark molecular cores in 2009-2010 at the Effelsberg 100-m telescope, we re-observed two clouds L1512 and L1498 and revealed discrepancy between the values which is as high as the channel width, .
- 2.
Continuous observations of L1512 and L1498 in 2012 at a fixed position towards the ammonia peaks showed that the measured radial velocity fluctuates during the exposure time of 2 hours with an amplitude , i.e., with approximately of the channel width.
- 3.
Tests with the synthesizer frequency at 2000.78125 MHz showed that the sky frequency is accurate to about 32 Hz, i.e., .
- 4.
Taking into account the revealed errors and averaging relative velocities over a sample of eight molecular cores ( independent values) observed in 2013, we find a null offset ( C.L.) between the rotational and inversion transitions of the above mentioned molecules.
- 5.
If this offset is interpreted in terms of , then the spatial -variation is constrained at the level of ( C.L.), that is the strictest limit for the validity of the LPI principle based on radio astronomical observations.
Acknowledgements.
We thank the staff of the Effelsberg 100-m telescope for the assistance in observations and acknowledge the help of Benjamin Winkel in preliminary data reduction. SAL’s work is supported by the grant DFG Sonderforschungsbereich SFB 676 Teilprojekt C4, and in part by Research Program OFN-17 of the Division of Physics, Russian Academy of Sciences.References
- Agafonova et al. (2011) Agafonova, I. I., Molaro, P., Levshakov, S. A., & Hou, J. L. 2011, A&A, 529, A28
- Bagdonaite et al. (2013) Bagdonaite, J., Jansen, P., Henkel, C., Bethlem, H. L., Menten, K. M., & Ubachs, W. 2013, Science, 339, 46
- Bahcall et al. (1967) Bahcall, J. N., Sargent, W. L. W., & Schmidt, M. 1967, ApJ, 149, L11
- Chand et al. (2005) Chand, H., Petitjean, P., Srianand, R., & Aracil, B. 2005, A&A, 430, 47
- Flambaum & Kozlov (2007) Flambaum, V. V. & Kozlov, M. G. 2007, PhRvL, 98, 240801
- Flambaum et al. (2004) Flambaum, V. V., Leinweber, D. B., Thomas, A. W., & Young, R. D. 2004, PhRvD, 69, 115006
- Fuller & Myers (1993) Fuller, G. A., & Myers, P. C. 1993, ApJ, 418, 273
- Hotzel et al. (20040) Hotzel, S., Harju, J., & Walmsley, C. M. 2004, A&A, 415, 1065
- Klein et al. (2012) Klein, B., Hochgürtel, S., Krämer, I., Bell, A., Meyer, K., & Güsten, R. 2012, A&A, 542, L3
- Kozlov & Levshakov (2013) Kozlov, M. G., & Levshakov, S. A. 2013, Ann. Phys., 525, 452
- (11) Kuiper, T. B. H., Langer, W. D., & Velusamy, T. 1996, 468, 761
- Langacker et al. (2002) Langacker, P., Segré, G., & Strassler, M. J. 2002, Phys. Lett. B, 528, 121
- Levshakov (1992) Levshakov, S. A. 1992, in High Resolution Spectroscopy with the VLT, ed. M.-H. Ulrich (ESO: Garching/Munchen), p.139
- Levshakov et al. (2010a) Levshakov, S. A., Lapinov, A. V., Henkel, C., Molaro, P., Reimers, D., Kozlov, M. G., Agafonova, I. I. 2010a, A&A, 524, A32
- Levshakov et al. (2010b) Levshakov, S. A., Molaro, P., Lapinov, A. V., Reimers, D., Henkel, C., & Sakai, T. 2010b, A&A, 512, A44
- (16) Levshakov, S. A., Combes, F., Boone, F., Agafonova, I. I., Reimers, D., & Kozlov, M. G. 2012, A&A, 540, L9
- Levshakov et al. (2013a) Levshakov, S. A., Reimers, D., Henkel, C., Winkel, B., Mignano, A., Centurión, M., & Molaro, P. 2013a, A&A, submitted
- Levshakov et al. (2013b) Levshakov, S. A., Henkel, C., Reimers, D., Wang, M., Mao, R., Wang, H., & Xu, Y. et al. 2013b, A&A, 553, A58
- Liberati (2013) Liberati, S. 2013, CQGra, 30, 133001
- Molaro et al. (2013) Molaro, P., Centurión, M., Whitmore, J. B., et al. 2013, A&A, 555, A68
- Murphy et al. (2001) Murphy, M. T., Webb, J. K., Flambaum, V. V., Prochaska, J. X., & Wolfe, A. M. 2001, MNRAS, 327, 1237
- Olano et al. (1988) Olano, C. A., Walmsley, C. M., & Wilson, T. L. 1988, A&A, 196, 194
- Pagani et al. (2009) Pagani, L., Daniel, F., & Dubernet, M.-L. 2009, A&A, 494, 719
- Quast et al. (2004) Quast, R., Reimers, D., & Levshakov, S. A. 2004, A&A, 415, L7
- Rosenband et al. (2008) Rosenband, T., Hume, D. B., Schmidt, P. O., et al. 2008, Science, 319, 1808
- Savedoff (1956) Savedoff, M. P. 1956, Nature, 178, 688
- Srianand et al. (2007) Srianand, R., Chand, H., Petitjean, P., & Aracil, B. 2007, PhRvL, 99, 239002
- Tafalla et al. (2004) Tafalla, M., Myers, P. C., Caselli, P., & Walmsley, C. M. 2004, A&A, 416, 191
- Uzan (2011) Uzan, J.-P. 2011, Living Rev. Relativity, 14, 2
- Varshalovich & Potekhin (1995) Varshalovich, D. A., & Potekhin, A. Y. 1995, SSRv, 74, 259
- Varshalovich et al. (1996) Varshalovich, D. A., Panchuk, V. E., & Ivanchik, A. V. 1996, AstrL, 22, 6
- Webb et al. (1999) Webb, J. K., Flambaum, V. V., Churchill, C. W., Drinkwater, M. J., & Barrow, J. D. 1999, PhRvL, 82, 884