Temperature-driven Phase Transformation in Y3Co: Neutron Scattering and First-principles Studies
Abstract
Contrary to previous studies that identified the ground state crystal structure of the entire Co series ( is a rare earth) as orthorhombic , we show that Y3Co undergoes a structural phase transition at K. Single crystal neutron diffraction data reveal that at the trigonal prisms formed by a cobalt atom and its six nearest-neighbor yttrium atoms experience distortions accompanied by notable changes of the Y-Co distances. The formation of the low-temperature phase is accompanied by a pronounced lattice distortion and anomalies seen in heat capacity and resistivity measurements. Density functional theory calculations reveal a dynamical instability of the structure of Y3Co. In particular, a transversal acoustic phonon mode along the direction has imaginary frequencies at . Employing inelastic neutron scattering measurements we find a strong damping of the phonon mode below a critical temperature . The observed structural transformation causes the reduction of dimensionality of electronic bands and decreases the electronic density of states at the Fermi level that identifies Y3Co as a system with the charge density wave instability.
pacs
71.20.Be, 61.50.Ks, 61.05.F-, 63.20.D-I INTRODUCTION
The effects of a crystal structure transformation due to subtle atomic displacements have attracted much attention because they can lead to drastic changes in the electronic and magnetic properties of solids. For example, in a number of multiferroic compounds the electric dipole moments typically develop from very small spontaneous deformations in the crystal structure.[1] The cuprate high-temperature superconductors where superconductivity emerges in the proximity of, or in competition with, a charge-density wave (CDW) provide another example of materials where subtle atomic distortions play an essential role.[2] Currently most of the research on the subject is focused on strongly correlated oxides, although it is obvious that such phenomena could occur in intermetallic compounds as well. Charge and spin density waves introduce a new periodicity in intermetallics, thereby breaking the lattice periodicity which defines their band structure. In particular, the direct evidence of CDW formation was found in ternary rare-earth transition-metal silicides Ir4Si10.[3, 4] The results of the x-ray diffraction confirmed the existence of both incommensurate and commensurate CDW states in these compounds. The formation of the CDW driven by the nesting of the Fermi surface and hosted within Te layers was detected in tritellurides Te3.[5, 6] The reduction of the size of the Fermi surface at the transition has been studied extensively.[7] Anomalous in the electrical resistivity of nonmagnetic compounds Y2CoIn8, Y2CoGa8 and Dy2CoGa8 were also proposed to arise due to a CDW-induced anisotropic energy gap at the Fermi surface.[8] Moreover, high interest in tiny atomic displacements was reinforced recently when a purely electronic picture of CDW was stringently tested.[9, 10] The coordinated action of electronic and ionic subsystems, i.e. the electron-phonon correlations was found to be responsible for the CDW instability in prototypical CDW materials CeTe3 and MSe2, M=Nb, Ta, Ti.
Binary intermetallic systems containing rare earth metals, such as Co ( is rare earth or yttrium) have been studied for more than three decades for their diversity of interesting properties. They usually exhibit complicated magnetic behavior, depending on the rare-earth, including metamagnetic transitions,[11, 12] giant magnetoresistance,[13] a substantial magnetocaloric effect[14] and superconductivity.[15] Co ions do not possess any ordered magnetic moment in Co.[12]
Y3Co with a nonmagnetic rare-earth site often serves as a reference system in systematic studies over the Co series, but is also an interesting system in its own right. A pronounced anomaly in the temperature dependent resistivity around K was reported more than twenty years ago but its origin was never satisfactorily explained.[16] The anomaly was discussed in terms of interactions of the localized cobalt magnetic moments that is in contradiction with the later results of magnetic measurements.[13] A small hump of the specific heat curve around 160 K was also observed but never discussed.[13] The crystal structure was repeatedly reported to be orthorhombic Fe3C-type structure ( space group) for entire Co series at all temperatures.[17, 18] Thus, the origin of the observed phenomena remained unclear.
In this work, using elastic and inelastic neutron scattering (INS) and density functional theory (DFT) calculations, we show that Y3Co undergoes a structural phase transition at K. The formation of this new phase is evident by a pronounced lattice distortion, and heat capacity and resistivity anomalies. We suggest that the nature of the observed anomalies at may be attributed to the formation of low-dimensional electronic bands with decreased density of states (DOS) at the Fermi level below the transition temperature.
II EXPERIMENTAL
Y3Co samples were prepared by arc melting of the elements in a helium atmosphere. Several single crystals with largest dimensions of approximately mm3 were grown by remelting the ingots at temperatures just above the peritectic point in a resistance furnace with a high temperature gradient, followed by annealing at 600∘C for 3 days. Neutron single crystal diffraction experiments were performed at the HB-3A four circle diffractometer[19] at the High Flux Isotope Reactor (HFIR) and at the Cold Neutron Chopper Spectrometer (CNCS)[20] at the Spallation Neutron Source (SNS) both at Oak Ridge National Laboratory. INS measurements were done using the thermal triple-axis spectrometer HB-1 at HFIR and at CNCS. At HB-3A, measurements were done using a neutron wavelength of Å (Si-331 monochromator). At HB-1 a neutron wavelength of 3.20 Å was chosen with a PG-002 monochromator. The incident wavelength at CNCS was Å. The coefficients of linear thermal expansion were measured using the dilatometer DL-1500 RHP/DL-1500-H (UCVAC/SINKU). Heat capacity, resistivity and magnetization measurements were carried out using a Quantum Design PPMS.
III RESULTS AND DISCUSSION

Our single crystal exhibits an anomaly in its temperature dependence of the dc resistivity similar to that published earlier in Refs. 16, 13. For temperatures above 160 K, the resistivity in all three high-symmetry directions increases monotonically with temperature. In the range K the resistivity curves, especially measured along the direction, exhibit a broad hump (not shown here, see Fig. 9 in Ref. 16). High-resolution measurements of the thermal expansion along the orthorhombic , and axes reveal more pronounced anomalies. A steplike decrease of the and coefficients occurs around upon cooling whereas slightly increases, see Fig. 1a. As one can see in Fig. 1b a small but noticeable peak in the heat capacity curve is also visible at . Additional heat capacity measurements show that the anomaly has no magnetic field dependence. Also, the inverse magnetic susceptibility curve does not show any peculiarities around 160 K (Fig. 1c). Thus, a magnetic origin of the observed phenomena seems unlikely. Rather, these observations suggest the presence of a temperature-driven structural phase transition in Y3Co at K. Concerning the magnetic properties of Y3Co, the determination of basic mean-field parameters such as paramagnetic moments and the Curie-Weiss temperature is difficult (if not meaningless) because Y3Co does not follow a Curie-Weiss law over any long temperature interval. This question was discussed in past, see for example Ref. 16.
| 180 K | 120 K | ||||
| N of refined parameters | 11 | 11 | 17 | 32 | 62 |
| /all | |||||
| Reflections collected | 323/577 | 424/664 | |||
| Reflections unique | 323/577 | 334/567 | 414/652 | 423/662 | 424/664 |
| Reflections rejected | 0/6 | 90/97 | 10/12 | 1/2 | 0/0 |
| /,% | 4.76/5.26 | 5.62/6.17 | 6.65/16.98 | 6.93/15.05 | 7.2/8.96 |
| GooF | 1.00 | 1.17 | 3.68 | 2.96 | 1.83 |
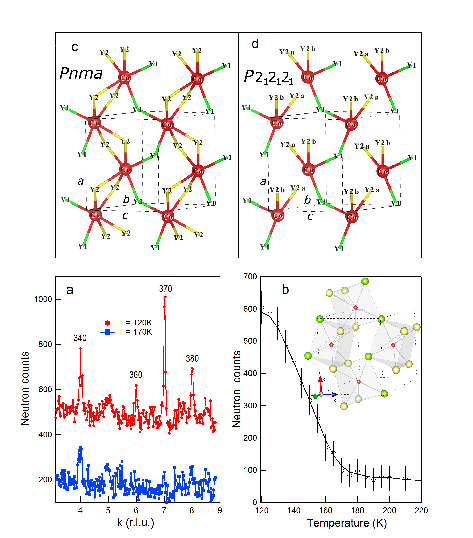
First, we use elastic neutron scattering to explore structural transformations. Using the CNCS time of flight spectrometer we acquire multiple datasets for different orientations of the crystal and combine them in software to fully map out the scattering function in a large region. A sector of 100 degree rotation with 1∘ step using scattering plane was recorded in total. A number of weak reflections were observed in the diffraction pattern measured at K which are absent at K, as demonstrated in Fig. 2a. The data were obtained by integration in the direction from 2.95 to 3.05 reciprocal lattice units (r.l.u.) and in energy transfer from -0.1 to 0.1 meV. These reflections violate the extinction rules for the Bragg reflections in space group. Fig. 2b shows a typical temperature dependence of the integrated peak intensity of one of the strongest forbidden reflections.
The observation of a few very weak, symmetry-forbidden reflections stimulated further investigations using the four circle neutron diffractometer HB-3A. A total of 577 and 664 reflections were collected at K and 120 K, respectively. A structure refinement of the diffraction data was carried out with the Jana2000 program,[21] the details are presented in Table 1. Our criteria in choice of the model were i) fulfillment of symmetry conditions of a space group and ii) quality of the refinement defined by the conventional parameters: , and GooF . Here and are observed and calculated structure factors, is the weight , is the number of reflections and is the total number of refined parameters.
The orthorhombic crystal structure with lattice parameters Å, Å and Å was confirmed for the high temperature phase. From 577 reflections measured at 180 K only 6 weak observations () are rejected as systematically extinct. Also the R-values of refinement are good. In this structure twelve yttrium ions per unit cell occupy two nonequivalent positions, 4 (Y1) and 8 (Y2). Four Co ions are located at the 4 position within the trigonal prisms formed by yttrium ions. The prisms are interconnected through edge- and corner-sharing to form layers as shown in the insert of Fig. 2b.
From 664 reflections measured at 120 K 90 significant observations () are rejected as systematically extinct. Therefore, though the R-values of refinement in the space group are acceptable, the resulting parameters correspond only to the average structure. The fine details of the structural distortion at can be extracted only when the symmetry conditions satisfying the new reflections are taken into account. All reflections can be indexed only in the lowest symmetry group . However, the number of relevant peaks and their intensities are at present insufficient for a full structure determination. The atomic coordinates and isotropic displacement parameters obtained for different space groups are summarized in Table 2.
| [Å2] | [Å2] | ||||||||
| K | K | ||||||||
| =7.024(5) =9.429(6) =6.358(5) Å | =7.021(5) =9.428(6) =6.354(5) Å | ||||||||
| Co | 0.388(1) | 1/4 | 0.960(1) | 0.018(1) | Co | 0.388(1) | 1/4 | 0.960(1) | 0.019(2) |
| Y1 | 0.0425(3) | 1/4 | 0.1334(4) | 0.0144(5) | Y1 | 0.0429(4) | 1/4 | 0.1339(4) | 0.0126(5) |
| Y2 | 0.1759(2) | 0.0651(2) | 0.6760(2) | 0.0158(4) | Y2 | 0.1763(3) | 0.0657(2) | 0.6761(3) | 0.0150(4) |
| K | K | ||||||||
| Co | 0.389(3) | 0.250 | 0.960(3) | 0.020(4) | Co1a | 0.3928 | 0.5007 | 0.9601 | 0.012(3) |
| Y1 | 0.04218(8) | 0.2496(1) | 0.1334(9) | 0.014(1) | Co1b | 0.884(2) | -0.509(1) | -0.462(4) | 0.014(3) |
| Y2a | 0.1806(5) | 0.0685(3) | 0.6676(6) | 0.0163(8) | Co1c | -0.378(4) | 0.007(2) | -0.955(5) | 0.023(4) |
| Y2b | -0.1718(5) | -0.0645(3) | -0.6842(8) | 0.0163(8) | Co1d | -0.892(4) | 0.002(2) | 0.465(4) | 0.019(3) |
| Y1a | 0.047(4) | 0.472(2) | 0.110(5) | 0.020(1) | |||||
| K | Y1b | 0.552(4) | -0.520(2) | 0.349(5) | 0.015(1) | ||||
| Y1c | -0.030(3) | 0.982(2) | -0.158(4) | 0.0107(9) | |||||
| Co1a | 0.393(2) | 0.5007(9) | 0.960 | 0.020(3) | Y1d | -0.531(3) | -0.019(2) | -0.388(4) | 0.0106(9) |
| Co1b | 0.881(2) | -0.5043(9) | -0.462(6) | 0.018(3) | Y2a | 0.188(3) | 0.306(2) | 0.669(4) | 0.014(1) |
| Y1a | 0.0416(8) | 0.4979(3) | 0.140(8) | 0.015(1) | Y2b | 0.685(3) | -0.322(2) | -0.194(5) | 0.025(2) |
| Y1b | 0.5391(8) | -0.5040(3) | 0.373(8) | 0.014(1) | Y2c | -0.161(3) | 0.805(2) | -0.695(4) | 0.011(1) |
| Y2a | 0.1728(8) | 0.3148(4) | 0.686(8) | 0.0169(9) | Y2d | -0.661(3) | 0.174(2) | 0.179(5) | 0.024(1) |
| Y2b | 0.6721(8) | -0.3136(4) | -0.182(8) | 0.0159(9) | Y3a | 0.694(3) | 0.305(2) | 0.815(4) | 0.009(1) |
| Y3a | 0.6800(8) | 0.3166(4) | 0.832(8) | 0.0140(9) | Y3b | 0.201(3) | -0.328(2) | -0.354(4) | 0.027(2) |
| Y3b | 0.1789(8) | -0.3194(4) | -0.332(8) | 0.0176(9) | Y3c | -0.662(3) | 0.805(2) | -0.850(4) | 0.0073(9) |
| Y3d | -0.165(3) | 0.175(2) | 0.318(5) | 0.017(1) | |||||
It turns out that the measured integrated intensities at K could best described within the space group . Here the R-values are higher than for the and models, but advantage of the model is that almost all reflections are taken into account and changes of the structure from the model can be easily followed. Fig. 2c-d present the Y-Co bonds within one layer. The Co and Y1 atoms have almost the same positions in the and models, whereas the Y2 position is split into the Y2a and Y2b sites in and these atoms are shifted maximal in (by 0.05 Å) and minimal in (by 0.02 Å) from the average position. The main consequence of the structural transition is spanning of the Co-Y2a, Co-Y2b interatomic distances, their variation reaches almost 5%, see Table 3 .
| K, | K, | |
|---|---|---|
| Co - Y1 | 2.666(8) | 2.66(1) |
| Co - Y1 | 2.802(8) | 2.82(2) |
| Co - Y2a | 2.806(6) | 2.84(1) |
| Co - Y2a | 2.921(6) | 2.88(1) |
| Co - Y2b | 2.79(1) | |
| Co - Y2b | 2.93(1) |
A possible origin of the temperature-driven structural phase transition observed in Y3Co will now be discussed. To understand the phase stability of the Y3Co high-temperature structure, it is essential to know the lattice dynamics of the phase. It is well known that at high temperatures a number of elements and intermetallic compounds adopt energetically unstable crystal structures. For example, the transition metals of groups III and IV are stable in a bcc phase at high temperatures and transform to hcp upon lowering the temperature.[22] They exhibit one or several dynamically unstable phonon modes which are characterized by imaginary harmonic frequencies.[23] These phonon modes are dynamical precursors of the ionic displacements and cause the transition when the temperature is lowered. To check for such a scenario we have studied the dynamical stability of the structure of Y3Co at K. First-principles calculations were performed using the Vienna ab initio simulation package (VASP)[24] based on projector augmented wave (PAW) pseudopotentials [25] within the generalized gradient approximation (GGA) as parameterized by Perdew, Burke, and Ernzerhof (PBE).[26] After careful convergence tests, a plane wave cutoff energy of 400 eV and an -point Monkhorst-Pack mesh[27] for the 16-atom unit cell of Y3Co were found to be sufficient to converge the total energy to better than 1 meV/atom. The resulting optimized lattice constants ( Å, Å, Å) are in good agreement with our experimental values, within %. Phonon spectra were computed by means of the supercell approach with the finite displacement method[28] realized in Phonopy package.[29] We used the 128 atomic supercell created from the optimized primitive unit cell. The computational cost of these calculations becomes unreasonable high, due to the low symmetry, if a larger cell is considered.

The PAW-GGA-DFT based energy bands along high-symmetry directions of the Brillouin zone and DOS of Y3Co are shown in Fig. 3. As evident from the Fig. 3, energy bands around arise mainly due to Y 4d and Co 3d states, with a dominance of Y 4d electrons. It turns out that the Fermi level situates close to a DOS minimum between Co 3d and Y 4d bands, that means that the second derivative of the density of state is positive. The combination of first and second derivatives 3[ dd] - [ dd] could explain the tendency of temperature dependence of resistivity to saturate, see for instance Ref. 30.
The calculated phonon dispersion relations with 48 phonon branches along various high-symmetry directions in the Brillouin zone and the corresponding phonon density of states (PDOS) are shown in Fig. 4. The calculated PDOS reproduces well the frequencies of the peaks and shoulders of the experimental data. We do not observe a statistically significant difference between PDOS taken at temperatures above and below the phase transition. However, as one can see in Fig. 4 the resulting phonon band structure of the phase exhibits a clear instability, evidenced by the appearance of the imaginary phonon frequencies (represented in Fig. 4 as negative values) of the lowest acoustic branch in the direction with . Analysis of the eigenvectors of the unstable acoustic phonon mode shows that the polarization vector is polarized along the direction. This suggests that the Y2a and Y2b ions of the Co-Y2-Co layer-connected chains displace in opposite directions, towards the structure stabilized at low temperature.

We further focus on the predicted dynamically unstable acoustic mode at temperatures above and below the phase transition. We constructed intensity contour maps based on a series of constant-energy scans obtained at the triple-axis spectrometer HB-1, see Fig. 5. A strong reduction of the phonon mode intensity below a critical temperature is clearly seen. Fig. 6 shows constant scans at for temperatures above and below phase transition. In order to compare the phonon intensities measured at different temperatures the data were corrected by the Bose population factor , . According to the calculated phonon dispersions the INS spectrum in direction at energy transfer meV comprises two acoustic modes including dynamically unstable one. These modes cannot be resolved in our measurements due to finite resolution but at K can be modeled by two resolution limited Gaussians, see Fig. 6. Lowering the temperature to 120 K we found that the lower Gaussian is almost vanished whereas upper mode is unaffected. The peak broadening was not observed in our measurements. This indicates that indeed the transversal acoustic (TA) low-energy phonon branch is unstable and vanishes at temperatures below the phase transition.
Overall, we can argue that (i) the anomaly in heat capacity which happens at the same temperature K as an anomalous thermal expansion along , (ii) the maximal shift of the Y2a and Y2b in direction in comparison with and and (iii) unstable low-energy phonon branch, indicate of the lattice instability along direction. Comparing our results with those from known CDW compounds with low-dimensional electronic bands we find qualitative similarities. Most of the CDW systems have anomalies in the thermodynamic properties at their critical temperature . For instance, the transitions in a strong interchain coupled CDW systems Ir4Si10 are characterized by a sharp jumps in the susceptibility and the resistivity as well as by narrow cusp in the specific heat.[3, 4] We can therefore speculate that the observed structural distortions at in Y3Co also cause the reduction of the electronic bands dimensionality and a decrease of DOS at the Fermi level.
We should also note that our recent single crystal neutron diffraction measurements on the Tb3Co intermetallic compound reveal a superstructure pattern similar that was found in Y3Co.[31] We suggest that some other members of the Co series (or even all of them) have ground state crystal symmetry lower than .


IV CONCLUSIONS
To summarize, using advanced neutron scattering techniques, we were able to analyze the temperature-driven structural transition in the Y3Co and to determine the basic distortions occurring at critical temperature . Using inelastic neutron scattering data and ab initio calculations we have shown that at low temperatures the orthorhombic structure has a dynamically unstable transversal acoustic phonon mode, which induces the ionic displacements. We argue, the structure transformation causes the reduction of dimensionality of electronic bands and decreases the DOS at the Fermi level that places this system among the CDW materials. Thus, our results support the theoretical conclusion that CDW formation cannot be a purely electronic effect [9, 10]. It generally relies on the lattice distortion as an essential element and requires a strong -dependent electron-phonon coupling.
Acknowledgements.
The research at Oak Ridge National Laboratory′s High Flux Isotope Reactor and Spallation Neutron Source was sponsored by the Scientific User Facilities Division, Office of Basic Energy Sciences, US Department of Energy (DOE). This research used resources of the National Energy Research Scientific Computing Center, which is supported by the Office of Science of the U.S. Department of Energy under Contract No. DE-AC02-05CH11231. This work was partly supported by the program of the Ural Branch of RAS (project No. 12-T-2-1012) and by the Ministry of Education and Science of the Russian Federation (Contract 14.518.11.7020).References
- [1] T. Kimura, T. Goto, H. Shintani, K. Ishizaka, T. Arima, and Y. Tokura, Nature (London) 426, 55 (2003).
- [2] J. Chang, E. Blackburn, A. T. Holmes, N. B. Christensen, J. Larsen, J. Mesot, R. Liang, D. A. Bonn, W. N. Hardy, A.Watenphul, et al., Nature Physics 8, 871 (2012).
- [3] B. Becker, N. G. Patil, S. Ramakrishnan, A. A. Menovsky, G. J. Nieuwenhuys, J. A. Mydosh, M. Kohgi, and K. Iwasa, Phys. Rev. B 59, 7266 (1999).
- [4] S. van Smaalen, M. Shaz, L. Palatinus, P. Daniels, F. Galli, G. J. Nieuwenhuys, and J. A. Mydosh, Phys. Rev. B 69, 014103 (2004).
- [5] V. Brouet, W. L. Yang, X. J. Zhou, Z. Hussain, N. Ru, K. Y. Shin, I. R. Fisher, and Z. X. Shen, Phys. Rev. Lett. 93, 126405 (2004).
- [6] A. Sacchetti, C. L. Condron, S. N. Gvasaliya, F. Pfuner, M. Lavagnini, M. Baldini, M. F. Toney, M. Merlini, M. Hanfland, J. Mesot, et al., Phys. Rev. B 79, 201101 (2009).
- [7] E. Fawcett, Rev. Mod. Phys. 60, 209 (1988).
- [8] A. J. Devang, A. K. Nigam, S. K. Dhar, and A. Thamizhavel, Phys. Rev. B 80, 054414 (2009).
- [9] M. D. Johannes and I. I. Mazin, Phys. Rev. B 77, 165135 (2008).
- [10] Z. Zhu, Y. Cheng, and U. Schwingenschlögl, Phys. Rev. B 85, 245133 (2012).
- [11] G. Primavesi and K. N. R. Taylor, J. Phys. F: Met. Phys. 2, 761 (1972).
- [12] A. F. Gubkin, A. Podlesnyak, and N. V. Baranov, Phys. Rev. B 82, 012403 (2010).
- [13] N. V. Baranov, A. A. Yermakov, P. E. Markin, U. M. Possokhov, H. Michor, B. Weingartner, and G. Hilscher, J. Alloys and Compounds 329, 22 (2001).
- [14] S. K. Tripathy, K. G. Suresh, and A. K. Nigam, J. Magn. Magn. Mater. 306, 24 (2006).
- [15] T. H. Geballe, B. T. Matthias, V. B. Compton, E. Correnzwit, G. W. Hull, Jr., and L. D. Longinotti, Phys. Rev. 137, A119 (1965).
- [16] E. Talik, J. Szade, J. Heimann, A. Winiarska, A. Winiarski, and A. Chelkowski, J. Less-Common Metals 138, 129 (1988).
- [17] D. T. Cromer and A. C. Larson, Acta Crystallogr. 14, 1226 (1961).
- [18] K. H. J. Buschow and A. S. van der Goot, J. Less-Common Met. 18, 309 (1969).
- [19] B. C. Chakoumakos, H. Cao, F. Ye, A. D. Stoica, M. Popovici, M. Sundaram, W. Zhou, J. S. Hicks, G. W. Lynn, and R. A. Riedel, J. Appl. Cryst. 44, 655 (2011).
- [20] G. Ehlers, A. Podlesnyak, J. L. Niedziela, E. B. Iverson, and P. E. Sokol, Rev. Sci. Instrum. 82, 085108 (2011).
- [21] V. Petricek, M. Dusek and L. Palatinus (2000): Jana2000. The crystallographic computing system. Institute of Physics, Praha, Czech Republic.
- [22] W. Petry, A. Heiming, J. Trampenau, M. Alba, C. Herzig, H. R. Schober, and G. Vogl, Phys. Rev. B 43, 10933 (1991).
- [23] P. Souvatzis, O. Eriksson, M. I. Katsnelson, and S. P. Rudin, Phys. Rev. Lett. 100, 095901 (2008).
- [24] G. Kresse and J. Furthmuller, Phys. Rev. B 54, 11169 (1996).
- [25] G. Kresse and J. Joubert, Phys. Rev. B 59, 1758 (1999).
- [26] J. P. Perdew, K. Burke, and M. Ernzerhof, Phys. Rev. Lett. 77, 3865 (1996).
- [27] H. J. Monkhorst and J. D. Pack, Phys. Rev. B 13, 5188 (1972).
- [28] K. Parlinski, Z. Q. Li, and Y. Kawazoe, Phys. Rev. Lett. 78, 4063 (1997).
- [29] A. Togo, F. Oba, and I. Tanaka, Phys. Rev. B 78, 134106 (2008).
- [30] H. Jones, Hdb. Phys. (Berlin: Springer Verlag, 1956), vol. 2, p. 266.
- [31] M. Frontzek et al. (to be published).