Spectral variability of IRAS 18325-5926 and constraints on the geometry of the scattering medium.Note: Accepted for publication in ApJ
Abstract
We analyze Suzaku and XMM-Newton data of the highly variable Seyfert 2, IRAS 18325-5926. The spectra of the source are well modeled as a primary component described as an absorbed power law and a secondary power law component which is consistent with being scattered emission from an on-axis extended highly ionized medium. We show that while the primary component varies on a wide range of timescales from s, the scattered emission is variable only on timescales longer than s. This implies that the extent of the scattering medium is greater than cm. The ratio of the scattered to primary flux () implies a column density for the scattering medium to be cm-2. We argue that for such a medium to be highly ionized it must be located less than cm from the X-ray source. Thus we localize the position and extent of scattering region to be a few cm, with an average particle density of cm-3. We consider the physical interpretation of these results and as an aside, we confirm the presence of a broad Iron line emission in both the XMM-Newton and Suzaku observations.
I. Introduction
The Unified Model for Seyfert galaxies predicts that the differences observed between type 1 and type 2 Seyfert galaxies are primarily due to orientation effects [1]. According to this model, there is a geometrically thick torus surrounding the accretion disk around the central supermassive black hole. Type 1 Seyfert galaxies are those active galactic nuclei (AGN) seen at low inclination angles (i.e. nearly face on) which provide an unobstructed view of the inner central region. Broad optical emission lines, which originate close to the black holes, are observed along with the narrow ones, originating further from the source. In the X-ray regime, the spectra is typically a power law one (showing sometimes a soft excess) and affected mostly by absorption in our own Galaxy. In contrast, type 2 Seyfert are those AGN which are observed at high inclination angles (i.e. nearly edge on) and hence their central engine is obscured by the dusty torus. The broad optical lines are not observed here but the narrow ones which originate high above in the axis of the torus, are detected. Their X-ray spectra is highly absorbed at low energies implying that the torus has a neutral column density in the range of - cm-2. The environment around central engine of AGN is expected to be fairly complex. For example, partially ionized, optical thin gas along our line of sight into the nuclei of several AGN can absorb the soft X-rays. This partially ionized material has come to be known as the “warm absorber” [14]. The geometry and the position of these warm absorbers are uncertain. Some AGN show evidence for high-velocity outflows [7, 29, 8, 10, 22, 5, 31, 6, e.g.]. Moreover with the aid of high resolution, narrow band imaging (or integral field spectroscopy) and HST imaging, it was possible to identify extended regions of highly ionized material around the central engine also known as ‘ionization cones’ with a size of a few up to 1520 kpc which suggests an anisotropic escape of photons from AGN confined to a cone by a dusty torus [39]. Such ionization cones were studied in NGC 1068 and in several other Seyfert 2 galaxies progressively using dispersive grating spectroscopy onboard Chandra and XMM-Newton [32, 40, 20, 27, 33, 13, 11, 9, e.g.]. Recent work on Seyfert 2 NGC 4945 based on XMM-Newton, Suzaku, Swift-BAT and Chandra data has revealed detailed characteristics of the circumnuclear reflector. The study implies the distance of the reflector 3550 pc and the Chandra imaging suggests a resolved, flattened, pc long clumpy structure, whose spectrum is explained by the cold reflection of the primary AGN emission [21]. Constraining the location and geometry, knowledge of the state and dynamics of these different components that make up the environment around AGN, is important to understand how the central engine accretes matter and any feedback the AGN may have in terms of matter outflow to the galaxy.
An interesting aspect of several Seyfert 2 AGN is the presence of an excess power law like emission at low energies ( keV), which may be due to scattered emission [34, 2]. In this scenario, the direct low energy photons of the source are absorbed by the torus. There is an extended scattering medium along the axis of the torus, which scatters some of the photons to our line of sight. Significant amount of work has been done using ASCA, BeppoSAX, XMM-Newton and Suzaku data, to address the nature of the scattering medium and its implications towards understanding the excess soft X-ray emission and geometrical structure in Seyfert 2 AGN. For instance, [34] studied in detail the importance of X-ray scattering and reflection for a sample of 25 Seyfert 2 AGN using ASCA data. They found a case of Mrk 3 whose spectrum could be explained by the presence of hot scattering gas in the soft X-ray regime with scattering fraction cover 0.02%5%. A similar study using ASCA investigated the physical conditions of the scattering material in a sample of scattering-dominated AGN. The study suggested that the soft X-rays represent scattered light, similar to optical polarized broad lines [25]. [12] explained the soft X-ray continuum of NGC 1068 and Circinus galaxy observed by BeppoSAX due to the combined presence of a scattered power law emission and an optically thin plasma emission and estimated column densities of the warm scatterer as 1021 cm-2 and a few 1022 cm-2 respectively. [2] studied a sample of six Seyfert 2 galaxies with optical polarized broad lines using ASCA data. The work revealed significant soft X-ray emission owing to the scattered light from their nuclear emission. They further estimated a few percent larger scattering efficiency than found for Seyfert 2 AGN without optical polarized broad lines. Pappa et al. [28] modeled the scattering emission as a secondary power law component in the ASCA spectra of a sample of eight Seyfert 2 galaxies and a warm scattering medium in NGC 4151 was observed by [38].
Suzaku broadband observations of obscured Seyfert galaxy MCG revealed a soft excess below 1 keV which was explained by emission from scattered continuum photons and distant photoionized gas. It was deduced that this source was viewed at moderate () inclination through Compton-thin matter at the edge of a Compton-thick torus covering steradians, consistent with Unified models [30]. Further studies with Suzaku showed that for two sources the scattered light constituted a small fraction () of the nuclear emission [36]. This suggested a scenario in which there was a geometrically thick torus with a small opening angle and/or very small amount of gas responsible for scattering. Another detailed work studied the wide band Suzaku spectrum of Markarian 3 which was resolved into weak, soft power-law emission, a heavily absorbed power law component, cold reflection, and emission lines. The weak, soft power law emission was considered to be scattered light by ionized gas with a scattering fraction of [3]. The possibility of scattering from an ionized medium was discussed in the Suzaku analysis of Seyfert 2 NGC 4945 [15]. A comprehensive study by [26] using XMM-Newton observations of 32 obscured AGN investigated their multi-wavelength properties in relation to the scattering fraction. The sample covered a broad range of the scattering fraction (); with eight AGN exhibiting low scattering fraction () suggesting that they are buried in a geometrically thick torus with a very small opening angle. They found no significant correlation between scattering fraction and far-infrared luminosity and a weak anti-correlation between the Eddington ratio and scattering fraction.
The variability of the scattered component as compared to the primary emission can provide constraints on the geometry of the scatterer. X-ray variability studies of Mrk 3 demonstrated that unlike the hard X-ray emission, the soft X-rays did not vary over 13 year baseline suggesting its origin from an extended region [34]. [2] also studied Mrk 3 and found no variability in the soft component over a 10 year long period although the hard component changed by a factor of 6 during 3 years. It was suggested that if most of the soft X-rays from Mrk 3 were scattered, the large time lag indicated that the distance of the scatterer from the nucleus is comparable to 6 lt-yr ( pc). This result supported a large scattering region as also presented by [34].
IRAS 18325-5926 is an IRAS selected Seyfert 2 galaxy at a redshift . It was first observed in X-rays by Ginga [16] which showed that the spectral index of the source is steeper than normal. The ASCA observation of this source revealed a quasi-periodic modulation in hours timescales [18] which was not seen in later RXTE or Beppo-SAX lightcurves [19]. It is one of the few AGN which shows a clear broad Iron line [17] which is possibly due to reflection of an highly ionized disk [19]. Beppo-SAX observation of this source hinted at a possible roll-over at keV [19]. Recently, [41] reported the detection of warm absorbers in this source with Chandra HETGS spectra. They found an intrinsic absorbing line system with an outflow velocity kms-1 which is contributed by two warm absorbers with outflowing velocities of 340110 kms-1 and 460220 kms-1, respectively. [24] also found warm absorbers; and detected the absorption features (in the form of a broad trough) in the vicinity of the keV iron K edge.
IRAS 18325-5926 also shows a soft component which may be due to a scattered component [17]. The scattered emission can only respond to variations in the intrinsic photons on a timescale longer than the light crossing one. It is fortuitous that the hard ( keV) X-ray spectrum of IRAS 18325-5926 shows rapid variations on timescales s and hence is an ideal source where the size of the scattering emission can be constrained. Here, we analyze XMM-Newton and Suzaku observations of the source to investigate the timescale on which the scattered emission responds to the primary one. The fraction of scattered photons is related to the total column density of the medium and since the scattered photons are not absorbed, the scattering medium should be highly ionized as we discuss in this work. Hence, these physical constraints allow us to estimate the the size and density of the scattering medium.
In the next section we describe the XMM-Newton and Suzaku observations and the details of data reduction process. In §3, the time-averaged spectra of the source are modeled and in §4 the spectral variability in different timescales are investigated. In §5, the size and density of the scattering medium are estimated and the results and conclusions are presented in §6.
| Camera | Exposure Time(ks) | Count Rate (s-1) |
|---|---|---|
| ObsID: 0022940101 (XMM-Newton) | ||
| EPIC-pn | ||
| MOS1 | ||
| MOS2 | ||
| ObsID: 0022940201 (XMM-Newton) | ||
| MOS1 | ||
| MOS2 | ||
| ObsID: 702118010 (Suzaku) | ||
| PIN | ||
| XIS 0 | ||
| XIS 1 | ||
| XIS 3 |
II. Observation and Data Reduction
Two observations from XMM-Newton during 2001 March 5 (ObsID: 0022940101) and March 6 (ObsID: 0022940201) and one observation from Suzaku 2007 October 10 (ObsID: 702118010) have been analyzed in this work. Details of the observations are shown in Table 1.
II.1. XMM-Newton
The EPIC pn and MOS cameras were operated in the small window mode using medium filter. Data was reduced using version 12.0 of the Scientific Analysis software (SAS). The exposure time for EPIC-pn camera was too small for first observation (ObsID: 0022940101) and the camera was not in the working mode for the second observation (ObsID: 0022940201), therefore analysis were done only with the two EPIC-MOS cameras. The correction for background flaring is done by setting a threshold count level of 1.5 counts for the first observation. For the second XMM-Newton observation,the background flares were excluded by choosing appropriate time filters which resulted in ks data for each MOS camera. For spectral analysis, the data was filtered to the good X-ray events (FLAG==0) with pattern 12 in the energy range 0.2-15 keV. To extract the source spectra a circular region of radius 40 for both MOS1 and MOS2 centered at the peak position of IRAS 18325-5926 were used. The background spectra was extracted from a nearby circular region, free of sources. The source spectra were re-binned with a minimum of 100 counts per channel. The re-binned data were analyzed using XSPEC in the energy range . For both observations, it was verified that the MOS1 and MOS2 spectra were consistent with each other and hence all spectral fittings were done on the combined data.
II.2. Suzaku
Of the four XIS instruments only three of them were in the operating mode. So observations were taken from three XIS (XIS0, XIS1 and XIS3) and the HXD (PIN) sensors. The XIS was in normal clocking mode. Suzaku FTOOL XISRMFGEN and XISSIMARFGEN is used to generate response matrices and ancillary response files respectively. For the extraction of XIS spectra a circular region of radius centered on the source were used, while backgrounds were extracted from the outer annulus region free of sources. We use an appropriate scaling factor for the background to take into account the different extraction areas of the source and the background.

The source spectrum was re-binned with a minimum of 300 counts per channel for all the three XIS sensors and 60 counts per channel for HXD(PIN). The XSPEC package was used for spectral analysis. The energy range was set to for XIS and for HXD. The normalization factor between XIS and HID spectra was fixed to 1.18. A sharp absorption line around was seen in the 0.6-10 keV energy band. It was found that this line feature is not present in all the XIS instruments. Close examination of the line reveals that the line is at the silicon K-edge and the feature could be due to incorrect response calculation. So the energy range is not considered for spectral fitting. Apart from this feature it was verified that all the XIS spectra were consistent with each other. So all the XIS spectra were combined for the analysis.
III. Spectral Analysis


To understand the spectra of the source, All three data sets were initially fitted by an an absorbed power law model. Galactic absorption was fixed to column density of cm-2. To this an additional neutral absorption at the redshift of source was included. The first XMM-Newton data with best fit model and their ratio are plotted in Fig 1. The ratio plot clearly shows two excesses. One at low energies which could be due to a scattered component and other at due to the K Iron line emission.
The Iron line emission feature in both the XMM-Newton and the Suzaku observations can be fitted by a broad Gaussian feature. The centroid energy is at and is broad with which is consistent with the ASCA observations [17]. The width of the line suggests a relativistic origin for the line. The relativistic Iron line model in xspec, “diskline” can also represent the feature. However, the line is too weak to constrain most of the parameters. For example, the first observation of XMM-Newton, provides a line energy of and an inclination angle of degrees, if the other parameters (i.e. the emissivity index , inner and outer radius ) are fixed at standard values. The line energy is less than what is expected from a highly ionized disk () as modeled by [19]. However, the present data is not good enough to undertake a detailed analysis of the complex iron line feature. Further complications are evident by the presence of an absorption edge at in the second XMM-Newton observation. Thus, in this work we model the Iron line feature using the “diskline” model and concentrate instead on the low energy excess.
The low energy excess is a broad feature and cannot be due to presence of narrow emission lines. We have checked the RGS data and confirmed that there are no strong narrow emission lines in the soft band as also revealed in the Chandra observation [24]. Instead, it can be modeled as an additional unabsorbed (i.e. only affected by the Galactic absorption) power law with the spectral index tied to that of the intrinsic one. The normalization of this additional power law is the only free parameter in the fitting [35]. The best fit spectral parameters are tabulated in Table 2 and the spectra with best-fit model and residuals are shown in Fig. 2 and Fig. 3 for the first XMM-Newton and Suzaku observations respectively. The spectral fits are reasonable with no obvious systematic residuals.
| Model Parameters | I | II | III |
|---|---|---|---|
| aaAbsorption column density in units of cm-2. The Galactic absorption of cm-2 has been included in all spectra. b Absorption edge component with energy and optical depth required only for observation II. cDiskline model where is the rest frame energy, is the inclination angle and is the normalization of the model in photons cm-2s-1. The emissivity index , inner radius and outer radius have been fixed to standard values. dThe primary power law with photon index and normalization, in units of photons cm-2s-1. eScattered power law emission with photon index same as the primary one and normalization, in units of photons cm-2s-1. | |||
| bbfootnotemark: ( keV) | – | – | |
| - | – | ||
| ccfootnotemark: ( keV) | |||
| (f) | |||
| () | (f) | (f) | |
| ddfootnotemark: | |||
| eefootnotemark: | |||
IV. Variability Studies
As expected, Table 2 shows that the spectrum of IRAS 18325-5926 was different in the Suzaku observation of October 2007 as compared to the XMM-Newton ones of March 2003. In particular, the normalization of the primary power law changed by nearly a factor of two. The normalization of the scattered power law emission also reveal a significant increase by % which shows that on timescales of years the scattered emission is variable, most probably in response to the primary continuum. The ratio of the scattered to the primary continuum also changed from during 2003 to in 2007, suggesting that the scattering medium itself is variable on such long timescales.
The two XMM-Newton observations are about a day apart and Table 2 reveals that the normalization of the primary power law does vary on this timescale, by increasing from to photons cm-2 s-1. However the normalization of the scattered component does not respond to this variation on s, remaining nearly constant at photons cm-2 s-1.
The source shows significant variability on a shorter timescale of s, as is evident in the lightcurve of one of the XMM-Newton observations shown in Fig 4.

We investigate whether the scattered continuum is variable on this timescale by dividing the data into two states defined as high ( count rate ¿ 1 counts/s) and low (count rate ¡ 1 counts/s) flux levels. Spectral fitting of each flux level for the first XMM-Newton observation, reveals that the primary power law normalization varied from to photons cm-2s-1. However the scattered component normalization did not seem to respond to this variation with (low flux level) to photons cm-2s-1. A similar result was obtained for the second XMM-Newton observation where the primary component normalization changed from to , but there was no detectable change in the scattered one with (low flux level) to photons cm-2s-1 (high flux level).
Further evidence that the scattered component does not respond to the primary one comes from analyzing the variability as a function of energy. For this, we extracted lightcurves for XMM-Newton observations in the energy bands 0.3-1.0 keV, 1.0-2.0 keV, 2.0-3.5 keV, 3.5-5.0 keV and 5.0-10.0 keV, respectively and for Suzaku observation, 0.3-1.68 keV, 1.68-3.0 keV, 3.0-5.32 keV and 5.32-9.5 keV, respectively. For extracting these lightcurves we have selected the good time intervals excluding the period of high background flares. In Fig 5, the fractional root mean square variability amplitude () is plotted against energy for all three data sets. is the square root of the excess variance which is the measured variance minus the expected variance due to Poisson noise. The measurement error on is computed using the formalism given by [37]. For all three data sets there is a sharp decrease in the variability below where the scattered component is a significant fraction of the total spectrum. This is indicative of a variable primary and a constant scattered component. One can estimate the variability that must be present in the primary component, to reproduce the observed , as
| (1) |
where is the total count rate detected in the energy bin and is the count rate in that bin due to the primary component alone. Fig. 5 shows as a function of energy (triangles with dotted lines as error bars). Thus, a nearly energy independent variability of the primary component, with a non-varying scattered component can explain the total observed variability of the source.
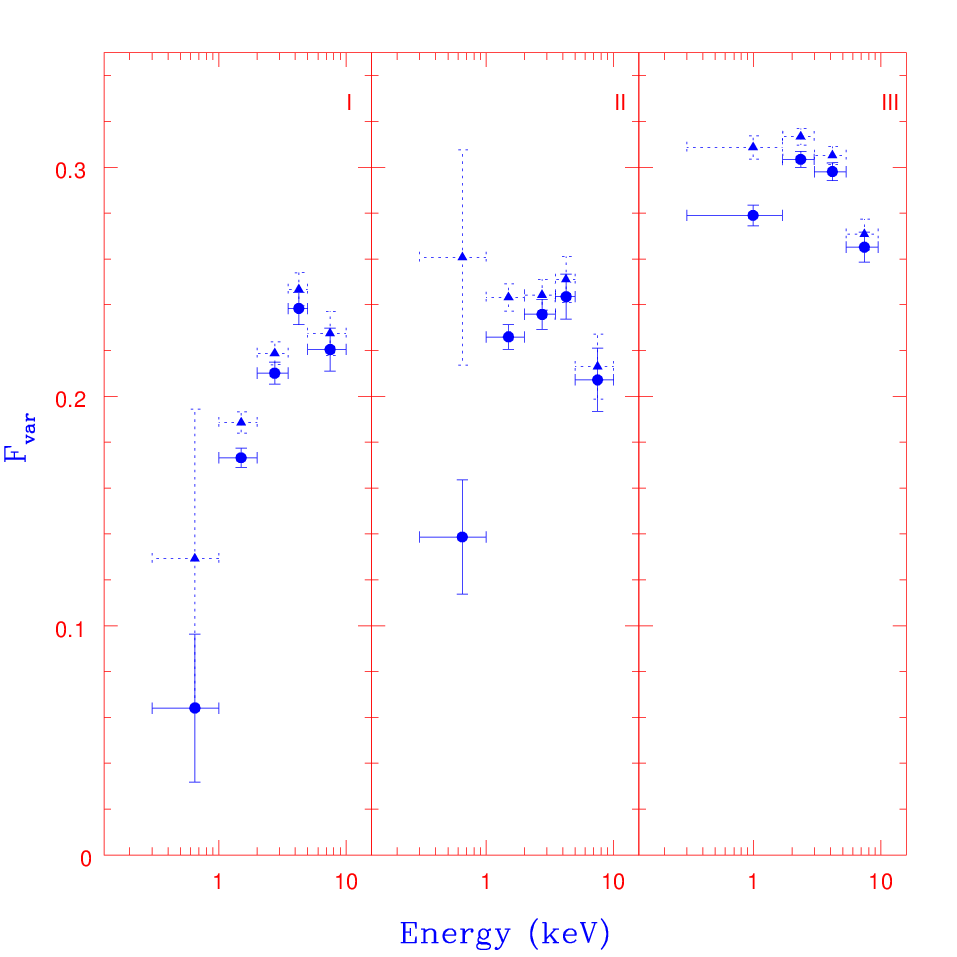
Thus the variability of the source indicates that while the primary component varies in a wide range of timescales, the scattered component responds only on timescales longer than a day ( s).
V. Geometry Of the Scatterer
Since the scattered component does not respond to the continuum on timescales of s, the scattering medium must be larger than cm. A simple geometry for the medium is a funnel shaped volume along the axis of the accretion disk. If the opening angle of the cone is , the fraction of photons that will be scattered is , where is the Thomson optical depth of the medium. Thus, we can estimate the column density as
| (2) |
where is the observed ratio of the normalizations of the primary to the scattered power law.
Such a high column density would absorb the soft X-ray photons from the source (instead of scattering them) unless the medium is highly ionized. For that to happen, the ionization parameter must be larger than a critical value . This naturally puts an upper limit on the size of the region or
| (3) | |||||
The X-ray luminosity of the source in the - band is ergs s-1 for the XMM-Newton observations assuming =70 km s-1 Mpc-1. The ionizing luminosity which includes photons with energy eV would be about a factor of few higher and is taken as ergs s-1. Thus the scattering medium can be constrained to have a column density cm-2, a size in the range cm and an average number density cm-3.
In this interpretation, the scattering medium is highly ionized and hence if the source was viewed in a lower inclination angle (like in a Seyfert 1), the spectrum will not be absorbed. However, a small fraction of the gas, (with column density cm-2) which is furthest away from the source could be partially ionized. This partial ionized gas could be the origin of the warm absorbers observed in many Seyfert 1. This would imply that the warm absorber clouds are at a distance of cm from the black hole. This is interesting since spectral fitting of the warm absorbers cannot constrain this distance and there always has been a large uncertainty regarding their location.
The present analysis does not provide information about the dynamic nature of the scattering medium as to whether it is an outflow or inflow. If we assume the medium to be outflowing in typical speeds of km s-1, the mass outflow rate can be estimated to be
| (4) | |||||
The mass accretion rate in the accretion disk can be estimated from as being g/s for a radiative efficiency, and bolometric luminosity ergs s-1, which is consistent with the results obtained by Chandra analysis of this source [24]. Despite the large uncertainties in these estimations, it seems that the scattering medium would require a mass outflow rate which is a significant fraction of the accretion one. The kinetic power carried by the outflow ergs s-1 is small compared to the radiative luminosity. However, these estimates depend upon the information on velocity which is unknown.
An alternate interpretation to the scattering medium described above, is that the secondary component is reflection from a highly ionized inner layer of the torus surrounding the black hole. From the lack of variability, the radius of the torus, cm and for it to be highly ionized would require, the density . For the torus to efficiently reflect the X-ray radiation, it must be optically thick to scattering i.e. its column density cm-2. This implies that the width of the torus , making the geometry unlikely. Hence we prefer the scattering geometry above as a more viable scenario.
VI. Results and Conclusions
The spectrum of IRAS 18325-5926 is well modeled by an absorbed power law and a secondary power law component to describe the low energy excess feature in the form of a scattered emission. We found that the scattered component varies on timescales longer than s unlike the primary emission which varies on a wide range of timescales ( s). This indicates the size of the scattering medium to be greater than cm. The observed ratio of the scattered to primary flux () gives the column density for the scattering medium to be 1023 cm-2. In order to facilitate scattering instead of absorption, the location of such a scattering medium should be less than cm from the X-ray source for it to be highly ionized. So we are also able to localize the position and extent of scattering region to be a few times cm, with an average particle density of cm-3. Hence, the location of the torus is 1016 cm. Besides, the spectral analysis of two XMM-Newton and a Suzaku observation also reveal the presence of a broad Iron line feature in the source. For Seyfert 2 AGN, with column density ¿ 1024 cm-2, the matter is optically thick to Compton scattering which makes the nucleus almost invisible. Hence the broad iron line cannot be detected in this scenario. However, for Seyfert 2 AGN with relatively low values of 1023 cm-2, where one sees through the outer edge of the putative cold torus, central X-ray emission above a few keV can penetrate the torus making the nuclear source visible to the observer. This picture would allow the detection of broad Fe K emission line consistent with the unification scheme. The presence of absorption edge at 8.2 keV in the second XMM-Newton observation of IRAS 18325-5926 (ObsId:0022940201) may suggest the possible link to the scattering medium, but it also depends on whether the X-rays are absorbed by the scattering medium or not.
A speculative but consistent scenario for the AGN seems to be that the source has a bi-polar outflow with a mass outflow rate comparable to the accretion one. However with a kinetic power much smaller than the radiative luminosity. The outflow is highly ionized to a distance of cm, with a column density of cm-2, beyond which there may be partially ionized gas. The source is surrounded by a torus at a distance of cm. A fraction of the primary X-rays scatter into our line of sight from the ionized outflow. A more systematic study of several such sources and theoretical hydro-dynamical simulations have to be undertaken to validate this geometry.
VII. Acknowledgements
This work is based on observations obtained with XMM-Newton, an ESA science mission with instruments and contributions directly funded by ESA Member States and NASA. This research has made use of data obtained from the Suzaku satellite, a collaborative mission between the space agencies of Japan (JAXA) and the USA (NASA). We would like to thank the XMM-Newton and Suzaku mission teams for developing excellent instruments. We thank the anonymous referee for the careful reading of the manuscript and useful comments.
References
- [1] Antonucci, R. 1993, ARA&A, 31, 473
- [2] Awaki, H., Ueno, S., Taniguchi, Y., & Weaver, K. A. 2000, ApJ, 542, 175
- [3] Awaki, H., Anabuki, N., Fukazawa, Y., et al. 2008, PASJ, 60, 293
- [4] Behar, E., Rasmussen, A. P., Blustin, A. J., et al. 2003, ApJ, 598, 232
- [5] Braito, V., Reeves, J. N., Dewangan, G. C., et al. 2007, ApJ, 670, 978
- [6] Cappi, M., et al. 2009, A&A, 504, 401
- [7] Chartas, G., Brandt, W. N., Gallagher, S. C., & Garmire, G. P. 2002, ApJ, 579, 169
- [8] Dadina, M., & Cappi, M. 2004, A&A, 413, 921
- [9] Dadina, M., Guainazzi, M., Cappi, M., et al. 2010, A&A, 516, A9
- [10] Dasgupta, S., Rao, A. R., Dewangan, G. C., & Agrawal, V. K. 2005, ApJ, 618, L87
- [11] Evans, D. A., Ogle, P. M., Marshall, H. L., et al. 2010, Accretion and Ejection in AGN: a Global View, 427, 97
- [12] Guainazzi, M., Matt, G., Antonelli, L. A., et al. 1999, MNRAS, 310, 10
- [13] Guainazzi, M., Bianchi, S., Cappi, M., Dadina, M., & Malaguti, G. 2008, Revista Mexicana de Astronomia y Astrofisica Conference Series, 32, 96
- [14] Halpern, J. P. 1984, ApJ, 281, 90
- [15] Itoh, T., Done, C., Makishima, K., et al. 2008, PASJ, 60, 251
- [16] Iwasawa, K., Kunieda, H., Tawara, Y., Awaki, H., Koyama, K., Murayama, T., & Taniguchi, Y. 1995, AJ, 110, 551
- [17] Iwasawa, K., Fabian, A. C., Mushotzky, R. F., Brandt, W. N., Awaki, H., & Kunieda, H. 1996, MNRAS, 279, 837
- [18] Iwasawa, K., Fabian, A. C., Brandt, W. N., Kunieda, H., Misaki, K., Terashima, Y., & Reynolds, C. S. 1998, MNRAS, 295, L20
- [19] Iwasawa, K., Lee, J. C., Young, A. J., Reynolds, C. S., & Fabian, A. C. 2004, MNRAS, 347, 411
- [20] Kinkhabwala, A., Sako, M., Behar, E., et al. 2002, ApJ, 575, 732
- [21] Marinucci, A., Risaliti, G., Wang, J., et al. 2012, MNRAS, 423, L6
- [22] Markowitz, A., Reeves, J. N., & Braito, V. 2006, ApJ, 646, 783
- [23] Matt, G. 1997, Mem. Soc. Astron. Italiana, 68, 127
- [24] Mocz, P., Lee, J. C., Iwasawa, K., & Canizares, C. R. 2011, ApJ, 729, 30
- [25] Netzer, H., Turner, T. J., & George, I. M. 1998, ApJ, 504, 680
- [26] Noguchi, K., Terashima, Y., Ishino, Y., et al. 2010, ApJ, 711, 144
- [27] Ogle, P. M., Brookings, T., Canizares, C. R., Lee, J. C., & Marshall, H. L. 2003, A&A, 402, 849
- [28] Pappa, A., Georgantopoulos, I., Stewart, G. C., & Zezas, A. L. 2001, MNRAS, 326, 995
- [29] Reeves, J. N., O’Brien, P. T., & Ward, M. J. 2003, ApJ, 593, L65
- [30] Reeves, J. N., Awaki, H., Dewangan, G. C., et al. 2007, PASJ, 59, 301
- [31] Reeves, J., Done, C., Pounds, K., et al. 2008, MNRAS, 385, L108
- [32] Sako, M., Kahn, S. M., Paerels, F., & Liedahl, D. A. 2000, ApJ, 543, L115
- [33] Schurch, N. J., Warwick, R. S., Griffiths, R. E., & Kahn, S. M. 2004, MNRAS, 350, 1
- [34] Turner, T. J., George, I. M., Nandra, K., & Mushotzky, R. F. 1997, ApJ, 488, 164
- [35] Trippe, M. L., Crenshaw, D. M., Deo, R. P., et al. 2010, ApJ, 725, 1749
- [36] Ueda, Y., Eguchi, S., Terashima, Y., et al. 2007, ApJ, 664, L79
- [37] Vaughan, S., Edelson, R., Warwick, R. S., & Uttley, P. 2003, MNRAS, 345, 1271
- [38] Warwick, R. S., & Griffiths, R. G. 2001, X-ray Astronomy: Stellar Endpoints, AGN, and the Diffuse X-ray Background, 599, 1003
- [39] Wilson, A. S., Braatz, J. A., Heckman, T. M., Krolik, J. H., & Miley, G. K. 1993, ApJ, 419, L61
- [40] Young, A. J., Wilson, A. S., & Shopbell, P. L. 2001, ApJ, 556, 6
- [41] Zhang, S.-N., Gu, Q.-S., Ji, L., & Peng, Z.-X. 2011, Research in Astronomy and Astrophysics, 11, 1171