Top-quark transverse-momentum distributions in -channel single-top production
Nikolaos Kidonakis
Kennesaw State University, Physics #1202,
1000 Chastain Rd., Kennesaw, GA 30144-5591, USA
Abstract
I present approximate next-to-next-to-leading-order (NNLO) top-quark transverse momentum, , distributions in -channel single-top production. These distributions are derived from next-to-next-to-leading-logarithm (NNLL) soft-gluon resummation. Theoretical results for the single top as well as the single antitop distributions are shown for LHC and Tevatron energies.
1 Introduction
Single-top production has been observed at both the Tevatron [1, 2] and the LHC [3, 4] and it has been an important process for study in addition to top-antitop pair production. The single-top cross sections are smaller than the corresponding ones for top-pair production and thus more difficult to observe. A lot of theoretical progress has been made in calculating the total cross sections and differential distributions.
Single-top production can proceed via three different types of partonic processes. One of them is the -channel process via the exchange of a space-like boson, a second is the -channel via the exchange of a time-like boson, and a third is associated production. At both LHC and Tevatron energies the -channel is numerically dominant. The -channel partonic processes are of the form and for single top production, and and for single antitop production.
The calculation of the complete next-to-leading order (NLO) corrections to the differential cross section for -channel production was performed in Ref. [5]. This calculation enabled the derivation of the top quark distribution at NLO. More recent results and further studies for the NLO top distribution in -channel production have appeared in [6, 7, 8, 9, 10].
Theoretical calculations for -channel production beyond NLO that include higher-order corrections from next-to-leading-logarithm (NLL) soft-gluon resummation appeared in [11, 12], and more recently at next-to-next-to-leading-logarithm (NNLL) accuracy in [13]. It was shown in those papers that the soft-gluon corrections dominate the cross section at NLO, and thus approximate it very well, while the NNLO soft-gluon corrections provide an additional enhancement.
The work in [11, 12, 13] is at the double-differential level and thus allows the calculation not only of total cross sections but also of differential distributions. The transverse momentum, , distribution of the top quark (or the antitop quark) is particularly interesting since deviations from new physics may appear at large , and measurements of the distribution are taken at the LHC. The calculation of these distributions at LHC as well as Tevatron energies is the subject of this paper. Some preliminary results based on the work in this paper have appeared in [14]. The work presented here is based on the formalism of the standard moment-space perturbative QCD resummation of soft-gluon corrections. Results based on another approach, soft-collinear effective theory (SCET), have also recently appeared in [15]. The differences between the moment-space and SCET approaches to resummation have been detailed in [16].
2 Top quark distributions


We consider single-top production in collisions of hadrons and with momenta , and let and represent the transverse momentum and rapidity of the top quark (or antitop). The underlying partonic reactions have momenta . The partonic invariants are , , , , where is the top quark mass. The hadronic invariants are , , and .
The resummation of threshold logarithms is carried out in moment space and it follows from the factorization of the differential cross section into hard, soft, and jet functions that describe, respectively, the hard scattering, noncollinear soft gluon emission, and collinear gluon emission from the initial- and final-state quarks and gluons [11, 13]. The resummed result can then be used as a generator of approximate higher-order corrections and inverted back to momentum space without need for any prescriptions. The threshold corrections that arise from soft-gluon emission take the form of logarithmic plus distributions, , where for the -th order QCD corrections. At NNLO these corrections to the double-differential partonic cross section take the form
where is the strong coupling, is the renormalization scale, and denotes the Born-level contributions. The coefficients are in general functions of , , , , , and the factorization scale ; these coefficients have been determined from two-loop calculations and NNLL resummation for all partonic processes contributing to this channel in [13].
To calculate the hadronic differential cross section one has to convolute the partonic result with parton distribution functions (pdf). The dominant partonic processes are and . Additional processes involving only quarks are and the Cabibbo-suppressed , and ; the contributions from even more suppressed processes (, , , etc.) are negligible. Additional processes involving antiquarks and quarks are and the Cabibbo-suppressed , and ; the contributions from even more suppressed processes (, , , etc.) are negligible. We use the MSTW2008 NNLO pdf [17] in our numerical results below.
For the -channel processes of the form the Born terms are
| (2.2) |
For the -channel processes of the form we have
| (2.3) |
Here , denote elements of the CKM matrix, and is the Weinberg angle. The processes and results for single antitop production are entirely analogous to those for single top.
The transverse momentum distribution of the top quark (or antitop) is given by
where denote the pdf,
| (2.5) |
with and ,
| (2.6) |
| (2.7) |
and
| (2.8) |
Note that the total cross section can easily be obtained by integrating the distribution over from 0 to , and we have checked that we recover the total cross section result of [13] which is also in very good agreement with both LHC [3, 4] and Tevatron [1, 2] data.
In Fig. 1 we present the approximate NNLO top-quark distribution in the left plot as well as the approximate NNLO antitop distribution in the right plot at the LHC at 7 TeV energy. The horizontal and vertical scales in the two plots are chosen the same for easier comparison of the relative magnitude of the top versus the antitop distributions. In both cases the central result is with a choice of factorization and renormalization scale equal to the top quark mass, taken as GeV, and the theoretical uncertainty from the variation of the scales by a factor of two (i.e. from to ) is also shown. The distributions peak at a of around 35 GeV and quickly fall with increasing , which is shown up to 140 GeV.

In Fig. 2 we present the same distributions at 7 TeV LHC energy but now in a logarithmic plot with a much larger range up to 500 GeV. Here we display all results in one plot for ease of comparison of the top versus the antitop distributions. The distributions fall over four orders of magnitude in the range shown.


In Fig. 3 we present the approximate NNLO top-quark distribution in the left plot as well as the approximate NNLO antitop distribution in the right plot at the LHC at 8 TeV energy, in analogy to Fig. 1. Again the central result is with scales equal to the top quark mass, and the theoretical uncertainty from the variation of the scales by a factor of two is also shown. The distributions again peak at a of around 35 GeV as at 7 TeV energy, with an enhancement over the NLO result of 5%.

In Fig. 4 we present the same distributions at 8 TeV LHC energy in one logarithmic plot with a range up to 500 GeV.


Figs. 5 and 6 display the corresponding results at 14 TeV LHC energy. At 14 TeV energy, is an order of magnitude larger for a of 500 GeV than at 7 TeV energy for both the top and the antitop distributions.


In Fig. 7 we compare the transverse momentum distributions for the top (left plot) and the antitop (right plot) at the three different LHC energies of 7, 8, and 14 TeV. The results are all with scale equal to and the range extends up to 1000 GeV. In this range the distributions fall over six orders of magnitude.
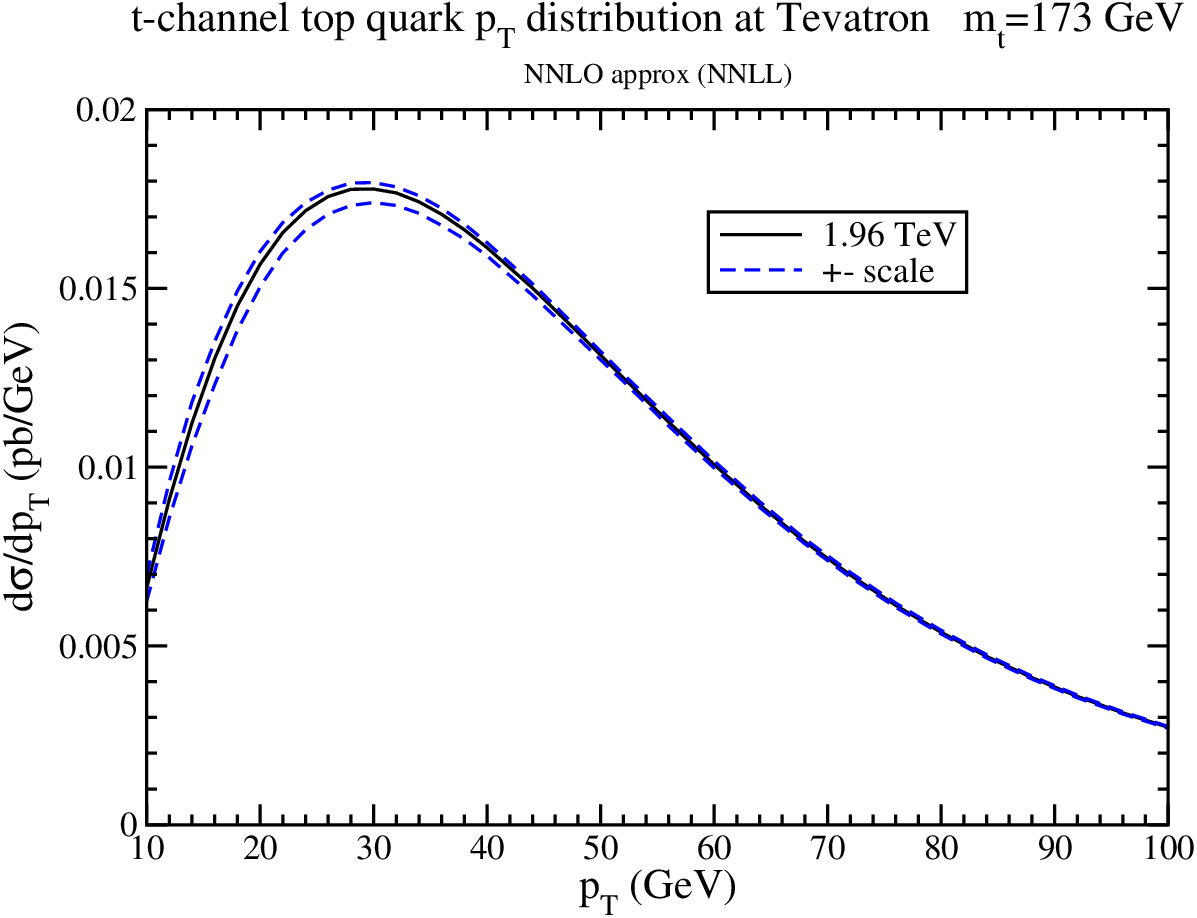

Finally, in Fig. 8 we present results for the top-quark distribution at the Tevatron with 1.96 TeV energy. The left plot shows results up to a of 100 GeV while the right plot uses a logarithmic scale with results up to a of 200 GeV. The distributions peak at a of around 30 GeV. The cross section for antitop production at the Tevatron is identical to that for top production.
3 Conclusions
We have presented the transverse momentum distribution, , of the top quark and of the antitop quark in -channel single-top and single-antitop production at the LHC and the Tevatron. Soft-gluon corrections are known to be important in these processes and have been resummed at NNLL accuracy. We have improved on NLO calculations by including soft-gluon corrections at NNLO. The theoretical uncertainty from factorization and renormalization scale dependence has also been determined. The distributions at current LHC energies peak at around a of 35 GeV and the NNLO corrections provide an enhancement over NLO up to 5%.
Acknowledgements
This material is based upon work supported by the National Science Foundation under Grant No. PHY 1212472.
References
- [1] D0 Collaboration, Phys. Rev. Lett. 103, 092001 (2009) [arXiv:0903.0850 [hep-ex]]; Phys. Lett. B 682, 363 (2010) [arXiv:0907.4259 [hep-ex]]; Phys. Lett. B 690, 5 (2010) [arXiv:0912.1066 [hep-ex]]; Phys. Lett. B 705, 313 (2011) [arXiv:1105.2788 [hep-ex]]; Phys. Rev. D 84, 112001 (2011) [arXiv:1108.3091 [hep-ex]].
- [2] CDF Collaboration, Phys. Rev. Lett. 103, 092002 (2009) [arXiv:0903.0885 [hep-ex]]; Phys. Rev. D 82, 112005 (2010) [arXiv:1004.1181 [hep-ex]]; CDF Note 10793.
- [3] CMS Collaboration, Phys. Rev. Lett. 107, 091802 (2011) [arXiv:1106.3052 [hep-ex]]; JHEP 1212 (2012) 035 [arXiv:1209.4533 [hep-ex]]; CMS-PAS-TOP-11-021; CMS-PAS-TOP-12-011; CMS-PAS-TOP-12-038.
- [4] ATLAS Collaboration, Phys. Lett. B 717, 330 (2012) [arXiv:1205.3130 [hep-ex]]; ATLAS-CONF-2011-088; ATLAS-CONF-2011-101; ATLAS-CONF-2012-056; ATLAS-CONF-2012-132.
- [5] B.W. Harris, E. Laenen, L. Phaf, Z. Sullivan, and S. Weinzierl, Phys. Rev. D 66, 054024 (2002) [hep-ph/0207055].
- [6] J.M. Campbell, R. Frederix, F. Maltoni, and F. Tramontano, Phys. Rev. Lett. 102, 182003 (2009) [arXiv:0903.0005 [hep-ph]]. .
- [7] R. Schwienhorst, C.-P. Yuan, C. Mueller, and Q.-H. Cao, Phys. Rev. D 83, 034019 (2011) [arXiv:1012.5132 [hep-ph]].
- [8] P. Falgari, F. Giannuzzi, P. Mellor, and A. Signer, Phys. Rev. D 83, 094013 (2011) [arXiv:1102.5267 [hep-ph]].
- [9] R. Frederix, E. Re, and P. Torrielli, JHEP 1209 (2012) 130 [arXiv:1207.5391 [hep-ph]].
- [10] P. Falgari, arXiv:1302.3699 [hep-ph].
- [11] N. Kidonakis, Phys. Rev. D 74, 114012 (2006) [hep-ph/0609287].
- [12] N. Kidonakis, Phys. Rev. D 75, 071501(R) (2007) [hep-ph/0701080].
- [13] N. Kidonakis, Phys. Rev. D 83, 091503(R) (2011) [arXiv:1103.2792 [hep-ph]].
- [14] N. Kidonakis, in DIS 2012, arXiv:1205.3453 [hep-ph]; arXiv:1210.7813 [hep-ph], to appear in a special issue of Particles and Nuclei; in CKM 2012, arXiv:1212.2844 [hep-ph].
- [15] J. Wang, C.S. Li, and H.X. Zhu, Phys. Rev. D 87, 034030 (2013) [arXiv:1210.7698 [hep-ph]].
- [16] N. Kidonakis and B.D. Pecjak, Eur. Phys. J. C 72, 2084 (2012) [arXiv:1108.6063 [hep-ph]].
- [17] A.D. Martin, W.J. Stirling, R.S. Thorne, and G. Watt, Eur. Phys. J. C 63, 189 (2009) [arXiv:0901.0002 [hep-ph]].