Electrostatic repulsion-driven crystallization model arising from filament networks
Abstract
The crystallization of bundles in filament networks interacting via long-range repulsions in confinement is described by a phenomenological model. The model demonstrates the formation of the hexagonal crystalline order via the interplay of the confinement potential and the filament-filament repulsion. Two distinct crystallization mechanisms in the short- and large- screening length regimes are discussed, and the phase diagram is obtained. Simulation of large bundles predicts the existence of topological defects within the bundled filaments. This electrostatic repulsion-driven crystallization model arising from studying filament networks can even find a more general context extending to charged colloidal systems.
I Introduction
Pattern formation from mutually repelling units in confined geometries has inspired various experimental [1, 2] and theoretical [3, 4, 5, 6] studies. These patterns provide a route to directed self-assembly [7]. Moreover, fascinating physics emerge in confined geometries that influence the physical properties of purely repulsive particle systems. For example, topological defects in 2D crystalline order on curved geometries, resulting from the repulsion of confining particles, can influence the melting of 2D crystals [8] and the mechanical properties of materials [9]. Recent experiments show the crystallization of like-charge synthetic supramolecular peptide filaments into lattices with very large spacings [10]. Bundles of crystallized filaments are observed to be randomly distributed forming a network of bundles. The observed, unexpectedly large crystalline lattice spacing between crystallized filaments in the bundle excludes the possibility of short-range attractions associated with counterion correlations that occur between close rods or filaments [11]. The underlying crystallization mechanism is therefore fundamentally distinct from those reported for cytoskeleton filaments and ds-DNA strands in the presence of short-range attractions, such as those induced by multi-valent counterions that lead to the formation of compact bundles [12, 13, 14, 15, 16]. Without any attractive interaction, the confinement effect due to the observed network of bundles seems to be the only force to counter the repulsion among filaments.
In this work, we analyze the interplay between the repulsive interaction and network confinement in the crystallization of filaments. We develop a particle model to understand how the long-range repulsions induce hexagonal crystalline order inside bundles of filaments, where the bundles form networks or gels. The electrostatic repulsion-driven crystallization model arising from filament networks can even be discussed in a more general context; in particular the introduced spatially varying confinement potential can be employed to manipulate charged particles in general colloidal systems [17].
II Model
The filaments in bundles are observed to be straight up to the scale of one micron, while their cross sectional radius is only a few nanometers [18]; their deformation is neglected in our model. By projecting these filaments to the plane perpendicular to them, the three-dimensional problem of the disorder-order transition of bundled filaments is reduced to the crystallization of particles in a confined flat disk; the thickness of filaments are neglected given the large lattice spacing. In what follows, we discuss the energetics of these particles. Experimental work suggests that the Poisson-Boltzmann equation provides a reasonably accurate description of even highly charged polyelectrolytes in 1:1 solutions despite its mean field nature, which is the case of interest in experiment [11]. The extraordinarily large lattice spacing of crystallized filaments (in comparison with the screening length) validates the application of the Debye-Hckel solution to the PB equation for the interaction energy between filaments; the possible counterion correlations on polyelectrolyte surfaces are significantly diminished beyond a very short distance [19, 20]. The screened Coulomb interaction energy between two parallel polyelectrolyte cylinders is [21]:
| (1) |
where is a constant related to charge densities on filaments, is the zeroth-order modified Bessel function of the second kind, and is the Debye screening length. Note that the full cylindrical solution to the Poisson-Boltzmann equation includes terms of and as [22]. Therefore, the linearized approximation to the filament-filament interaction essentially neglects terms that decay faster than ; the contributions from these terms are trivial for large distances between filaments [23, 24]. For sufficiently large screening length, the interaction energy between particles takes the form of the two-dimensional Coulomb interaction that can be derived from the two-dimensional Poisson equation [25]: , where is the line density of charges on filaments, and is a constant. Note that for , , where the Euler constant . The neglect of the constant terms in the expansion for also leads to the expression for the 2D Coulomb interaction. It is interesting to note that the interaction energy of two vortex lines in superconductors is also proportional to the zeroth-order modified Bessel function of the second kind as in Eq.(1) [26].
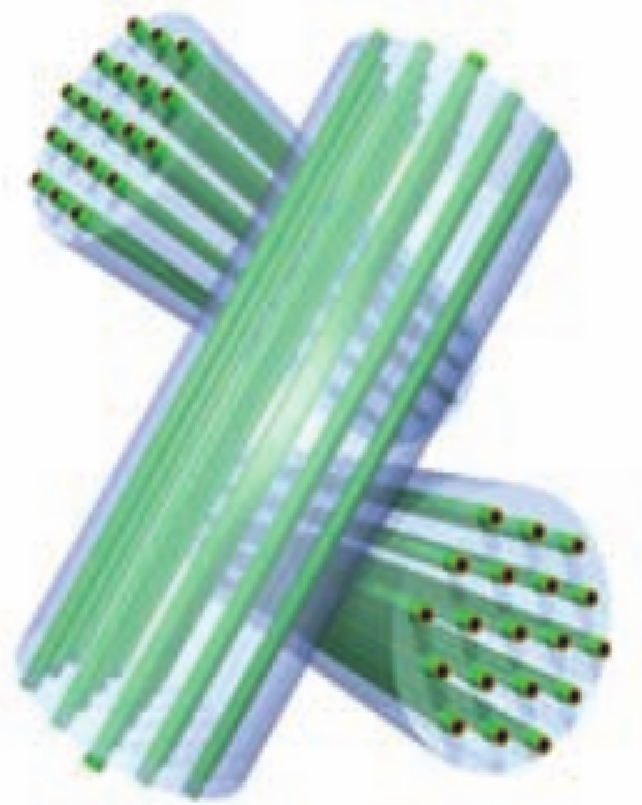

We model the interaction between a bundle and its surrounding filaments by a geometric constraint and a confinement potential. In experiment, the bundles are randomly oriented and their interlocking in the network limits the mobility of any bundle within some channel around them, as schematically shown in Fig. 1(a) [18]. The shape of the channel is assumed to be circular here. This geometric constraint is represented by a hard-wall potential. Furthermore, filaments in a bundle are subject to a confinement potential arising from the electrostatic repulsion between the filaments and the wall. To obtain the expression for the confinement potential, we first calculate the Coulomb interaction energy of a single filament in an arbitrary bundle in a filament network. Filaments in neighboring bundles are represented by the two green lines at and in Fig 1(b). For filament length , and , numerical calculations show that the potential energy of a charged filament between two perpendicular ones versus its position can be well fitted by a quadratic curve. The collective interactions from all filaments in neighboring bundles enhance the potential energy of the charged filament (the blue one at ) without modifying the quadratic law; the sum of quadratic polynomials is also a quadratic polynomial. Based on the above heuristic calculation, the confinement potential is assumed to conform to a quadratic law in the non-screening regime. Considering the screening effect of solutions, we model the influence of the wall on a filament as decaying exponentially. The expression for the confinement potential must reduce to a quadratic form as the screening length approaches infinity. We therefore propose the expression for the confinement potential as
| (2) |
where is the distance from the center of the channel to a filament. Here we introduce the phenomenological parameter to characterize the strength of the confinement potential. It has a complicated dependence on the charge density of filaments as well as their orientations and positions in the network. It is interesting to compare Eq.(2) with the confinement potential between two quarks that can be approximated by (both and are constants) [27]. Note that the optimal angle defined in Fig 1(a) is calculated to be always with the position of the blue line varying between and . This result supports the hypothesized templating effect in the formation of networks, which states that long filaments formed at early stages act as templates for the formation of bundles as the growth of short filaments continues [18].
To summarize the above discussion, the energetics of particles in a disk of radius representing filaments in a bundle is:
| (3) | |||
where is the two-dimensional position vector of a particle in a disk. The first two terms are the hard-wall potential and the confinement potential, respectively. is the Heaviside step function; it is zero for and 1 for . The parameter is a large number characterizing the hard-wall potential. The last term in Eq.(3) describes the interaction between filaments. Note that in the limit of large screening length, Eq.(3) is recognized as the constrained two-dimensional Coulomb gas model [25]. For an electrically neutral network, only the geometric constraint term in Eq.(3) survives. The confinement potential term tends to push particles towards the center of the disk, while the particle-particle repulsion term prevents their approach.
We perform annealing Monte Carlo simulation for identifying the lowest-energy configuration of particles confined in a disk [28]. About MC sweeps are carried out for each run; each MC sweep consists of trial attempts to randomly move each particle. The acceptance or rejection of a MC trial is determined by the standard Metropolis algorithm. The hard-wall potential is treated as a geometric constraint, i.e., the particles are not allowed to move beyond the disk boundary. In the simulation, the functional to be minimized is , which reduces to in the limit of large screening length. The phenomenological dimensionless parameter controls the relative importance of the confinement potential and the interaction between particles. In simulation, we set which defines a unit length. Other length scales are measured in terms of the radius of the disk.
In oder to characterize the hexagonal crystalline order, we construct bonds between particles via the Delaunay triangulation [29] and introduce a bond order parameter on the constructed triangular lattice [30]
| (4) |
where describes the orientation of the bond connecting the two neighboring particles and relative to some fixed reference axis. The modulus of is independent of a global rotation of the system. for a perfect hexagonal crystal and for a liquid state. For eliminating the edge effect in a finite system, the exterior particles are excluded in the calculation of the order parameter .


III Results and Discussion
In experiments, the hexagonal crystalline order emerges in bundles of filaments with the increase of charges on filaments [10, 31]. In this process, the parameter , which characterizes the relative strength of the confinement potential to the interaction between particles, varies correspondingly. The bundle size is rather polydispersed; the number of filaments in a bundle is in the magnitude of . We systematically study bundles of varying sizes. Figure 2 shows that the dependence of on is highly non-monotonous. For example, for , and it suddenly drops to or by decreasing or increasing one particle to the system. This phenomenon can be attributed to the geometric specialty of the number 19. It is a centered hexagonal number. A centered hexagonal number is the number of a hexagon with a dot at the center and all other dots surrounding the central dot in a hexagonal lattice. Adding or removing a point from a perfect hexagonal lattice composed of would destroy the perfect crystalline structure. This phenomenon is shown in Fig.3 (a-c); 18, 19 and 20 from (a) to (c). In Fig. 2, the points above the red line may be regarded as in a crystallized state; the configurations of is shown in Fig. 3 (b). Those below the red line may be in partially crystallized states. For example, the interior particles in the configurations of and are perfectly crystallized, as shown in Fig. 3(d-f). Their low values of are due to the topological defects near the boundary.


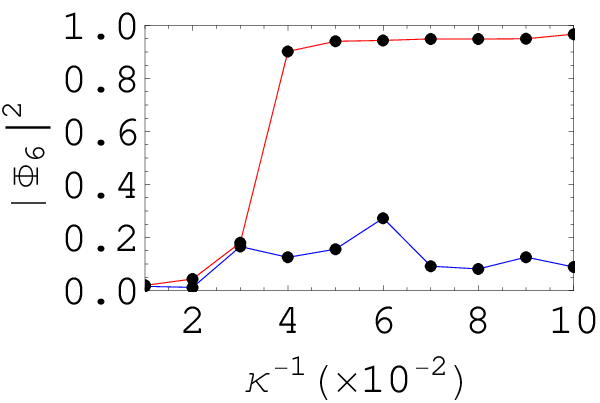


In what follows, we will present typical results for small () and large () bundles. Figure 4 shows the low-energy configurations of 19 filaments confined in a bundle subject to the confinement potential with the increase of the screening length (from left to right) that are generated via the MC simulation. The comparison of the upper row () and the lower row () indicates that the confinement potential significantly facilitates the formation of crystalline order; a hexagonal crystalline order has been well established at for , as shown in Fig. 4(e). In the regime of short screening length (), since the confinement potential decays exponentially away from the wall, the particles can only feel a strong repulsion from the wall if they are within about one screening length from it. On the other hand, the particles at a distance exceeding are invisible to one other. Therefore, the system is essentially composed of soft disks of effective radius confined in a disk of effective radius . With the increase of the screening length, the available area a particle can explore is consequently reduced, and either a crystalline order or a glass state will finally be formed at some critical value for the screening length. This scenario is substantiated in the simulation. Fig. 4 (d-f) shows that the hexagonal crystalline order starts to appear only if the screening length exceeds some critical value as read from the red curve in Fig. 5(a), which is corresponding to for the typical value of [10].


| 0.02 | 0.04 | 0.06 | 0.08 | 0.1 | 0.12 | 0.14 | 0.16 | 0.18 | 0.2 | 2 | 5 | 10 | 15 | 20 | 25 | |
| 9 | 0.00 | 0.12 | 0.13 | 0.15 | 0.08 | 0.36 | 0.37 | 0.36 | 0.36 | 0.35 | 0.02 | 0.02 | 0.00 | 0.01 | 0.08 | 0.09 |
| 8 | 0.04 | 0.09 | 0.12 | 0.06 | 0.09 | 0.37 | 0.39 | 0.37 | 0.37 | 0.33 | 0.00 | 0.00 | 0.05 | 0.00 | 0.05 | 0.06 |
| 7 | 0.00 | 0.23 | 0.03 | 0.11 | 0.07 | 0.39 | 0.39 | 0.37 | 0.37 | 0.39 | 0.09 | 0.00 | 0.14 | 0.00 | 0.00 | 0.14 |
| 6 | 0.00 | 0.13 | 0.04 | 0.12 | 0.11 | 0.05 | 0.38 | 0.37 | 0.39 | 0.36 | 0.16 | 0.00 | 0.01 | 0.00 | 0.00 | 0.00 |
| 5 | 0.00 | 0.08 | 0.03 | 0.14 | 0.11 | 0.41 | 0.39 | 0.37 | 0.37 | 0.36 | 0.00 | 0.00 | 0.00 | 0.00 | 0.00 | 0.00 |
| 4 | 0.02 | 0.12 | 0.14 | 0.09 | 0.40 | 0.07 | 0.38 | 0.39 | 0.38 | 0.30 | 0.00 | 0.00 | 0.00 | 0.00 | 0.00 | 0.00 |
| 3 | 0.02 | 0.12 | 0.34 | 0.19 | 0.11 | 0.41 | 0.37 | 0.39 | 0.36 | 0.36 | 0.01 | 0.00 | 0.00 | 0.00 | 0.00 | 0.00 |
| 2 | 0.00 | 0.22 | 0.09 | 0.11 | 0.11 | 0.39 | 0.37 | 0.39 | 0.37 | 0.38 | 0.00 | 0.00 | 0.00 | 0.00 | 0.00 | 0.00 |
| 1 | 0.01 | 0.13 | 0.15 | 0.11 | 0.09 | 0.07 | 0.11 | 0.38 | 0.382 | 0.40 | 0.00 | 0.00 | 0.02 | 0.00 | 0.00 | 0.01 |
| 0 | 0.00 | 0.04 | 0.06 | 0.26 | 0.31 | 0.15 | 0.14 | 0.24 | 0.06 | 0.05 | 0.00 | 0.00 | 0.01 | 0.03 | 0.00 | 0.01 |
We proceed to discuss the crystallization mechanism in the large screening length limit, where the filaments in a bundle behave like a 2D Coulomb gas in a disk, and the confinement potential conforms to a square law. Without considering the confinement potential, the particles in the zero-temperature 2D Coulomb gas are always uniformly distributed along the circumference of the disk [32]. This remarkable feature is specific to the logarithm potential. A confinement potential is therefore required for pushing particles away from the boundary and forming some ordered structure in the interior of the disk. Figure 6 shows the low-energy configurations of 19 filaments confined in a bundle with the increasing from (a) to (j), where two transitions are identified. The first one occurs at where a particle is pushed from the boundary to the center of the disk. In this jump, the reduction of the confinement potential exceeds the energy barrier by moving a particle from the boundary to the center of the disk. With the further increase of , more and more particles are pushed to the interior of the disk, forming a series of symmetric patterns, as shown in Fig. 6(b-f). These discrete structures break rotational symmetry, despite the existing rotational symmetry in the potential. As the total number of particles in the interior of the disk exceeds six, the hexagonal crystalline structure emerges that is highlighted by the Delaunay triangulation. The effect of further increase of is to compress the system; the particles originally on the boundary start to migrate towards the interior of the disk [see Fig. 6(g-j)]. Fig. 5(b) shows a rather sharp disorder-order phase transition at that corresponds to the configuration in Fig. 6(g).
Figure 7 shows the phase diagram of the system in the parameter space of and . The two crystalline zones are represented by blue squares. The interesting re-entrance effect for is found in simulation. This agrees with general observations that confinement effects yield re-entrance [33, 34, 35]. The formation of the left crystalline zone in Fig. 7 is understood in terms of the soft-disk picture, while the upper right one is attributed to the confinement potential that pushes particles away from the disk boundary, as has been discussed in the proceeding paragraphs. As exceeds some critical value (about for and for ), the crystalline order is destroyed. These critical values are very close to half of the lattice spacings in the corresponding crystallized filaments at for () and at for (), respectively. The melting of the crystals is therefore driven by increasing the effective radius of the soft disks; the melting starts when the repulsion between particles becomes strong enough so that the confinement potential fails to hold the particles together. The simulation also indicates that the crystalline order can be destroyed for exceeding about and in the short- and large-screening length regimes, respectively. The underlying physics is the overcompression-induced breakage of a crystal; the compression originates from the confinement potential tends to push particles towards the center of the disk.
As the number of particles increases, the value of the order parameter is generally reduced, as shown in Table 1 for a bundle of filaments in the parameter space of and . The maximum value for the order parameter in the region considered in Table 1 does not exceed 0.5, and the value of the order parameter for large screening length is even lower. It implies that a large system tends to be in a disordered state. The emerging topological defects in large systems are responsible for the reduction of the value of the order parameter; their proliferation destroys the crystalline order. Figure 8 shows the five- and seven-fold disclinations in a bundle of filaments. It is important to note that these defects are introduced via physical potentials instead of either a non-Euclidean background geometry [36] or geometrically induced stresses [37]. In simulation, we take attempts to reduce the possibility of artificially introducing defects, such as choosing various initial configurations and carefully heating the lowest-energy states repeatedly to avoid the metastable states. The irremovability of the topological defects in simulation makes one to conjecture that defects may exist intrinsically in large bundles that are subject to a spatially varying potential.
IV Conclusion
Our particle model shows that the interplay between the repulsive interaction and network confinement leads to the re-entrance phenomenon in the phase diagram. In addition, MC simulation suggests the emergence of topological defects in large bundles via pure physical potentials. This may lead to further study about the formation mechanism of topological defects in two-dimensional systems. Our model provides an example of controlling the separation of filaments and their bundling that may find applications in the control of cells in external filamentous matrices [38] and the design of biomaterials. In addition, the electrostatic repulsion-driven crystallization model arising from the study of filament networks can even find a more general context. Crystallization, melting and dynamics of confined two-dimensional charged colloidal systems have been extensively studied, where the particles are mutually repelled [39, 40, 17]. In our model, the introduced spatially varying confinement potential that is mimicking the charged environment of a bundle can find its applications in a general colloidal system.
ACKNOWLEDGMENTS
This work was funded by grants from the Office of the Director of Defense Research and Engineering (DDRE) and the Air Force Office of Scientific Research (AFOSR) under Award No. FA9550-10-1-0167.
References
- [1] A. Bausch, M. Bowick, A. Cacciuto, A. Dinsmore, M. Hsu, D. Nelson, M. Nikolaides, A. Travesset, and D. Weitz, Science 299, 1716 (2003).
- [2] W. Irvine, V. Vitelli, and P. Chaikin, Nature 468, 947 (2010).
- [3] Y. Levin, Rep. Prog. Phys. 65, 1577 (2002).
- [4] F. Solis, G. Vernizzi, and M. Olvera de la Cruz, Soft Matter 7, 1456 (2011).
- [5] M. Bowick and Z. Yao, Europhys. Lett. 93, 36001 (2011).
- [6] Z. Yao and M. Olvera de la Cruz, Phys. Rev. E 87, 012603 (2013).
- [7] G. DeVries, M. Brunnbauer, Y. Hu, A. Jackson, B. Long, B. Neltner, O. Uzun, B. Wunsch, and F. Stellacci, Science 315, 358 (2007).
- [8] J. Kosterlitz and D. Thouless, J. Physics C 6, 1181 (2002).
- [9] D. Nelson, Defects and Geometry in Condensed Matter Physics (Cambridge University Press, 2002).
- [10] H. Cui, E. Pashuck, Y. Velichko, S. Weigand, A. Cheetham, C. Newcomb, and S. Stupp, Science 327, 555 (2010).
- [11] G. Wong and L. Pollack, Annu. Rev. Phys. Chem. 61, 171 (2010).
- [12] J. Widom and R. Baldwin, J. Mol. Biol. 144, 431 (1980).
- [13] E. Raspaud, M. Olvera de la Cruz, J. Sikorav, and F. Livolant, Biophys. J. 74, 381 (1998).
- [14] J. Stendahl, M. Rao, M. Guler, and S. Stupp, Adv. Funct. Mater. 16, 499 (2006).
- [15] M. Greenfield, J. Hoffman, M. Olvera de la Cruz, and S. Stupp, Langmuir 26, 3641 (2009).
- [16] M. Sayar and C. Holm, Phys. Rev. E 82, 031901 (2010).
- [17] H. Löwen, E. Oguz, L. Assoud, and R. Messina, Adv. Chem. Phys. 148, 225 (2012).
- [18] J. Hartgerink, E. Beniash, and S. Stupp, Science 294, 1684 (2001).
- [19] B.-Y. Ha and A. J. Liu, Phys. Rev. Lett. 79, 1289 (1997).
- [20] A. Diehl, H. Carmona, and Y. Levin, Phys. Rev. E 64, 011804 (2001).
- [21] S. Brenner and V. Parsegian, Biophys. J. 14, 327 (1974).
- [22] C. Tracy and H. Widom, Physica A 244, 402 (1997).
- [23] S. Brenner and D. McQuarrie, J. Colloid Interface Sci. 44, 298 (1973).
- [24] D. Harries, Langmuir 14, 3149 (1998).
- [25] S. Ma, Statistical Mechanics (World Scientific, 1985).
- [26] M. Tinkham, Introduction to Superconductivity (Courier Dover Publications, 2012).
- [27] J. Hsu, Phys. Rev. D 24, 802 (1981).
- [28] M. Newman and G. Barkema, Monte Carlo Methods in Statistical Physics (Clarendon Press, 1999).
- [29] M. De Berg, O. Cheong, M. Van Kreveld, and M. Overmars, Computational Geometry (Springer, 2008).
- [30] D. Nelson and B. Halperin, Phys. Rev. B 19, 2457 (1979).
- [31] G. Stark, Biochim Biophys Acta 1071, 103 (1991).
- [32] M. Sancho, J. Sebastián, and V. Giner, Eng. Sci. Edu. J. 10, 26 (2001).
- [33] R. Bubeck, C. Bechinger, S. Neser, and P. Leiderer, Phys. Rev. Lett. 82, 3364 (1999).
- [34] R. Messina and H. Löwen, Phys. Rev. Lett. 91, 146101 (2003).
- [35] C. Royall, M. Leunissen, A. Hynninen, M. Dijkstra, and A. van Blaaderen, J. Chem. Phys. 124, 244706 (2006).
- [36] M. Bowick and L. Giomi, Adv. Phys. 58, 449 (2009).
- [37] G. M. Grason, Phys. Rev. Lett. 105, 045502 (2010).
- [38] J. Meredith Jr, B. Fazeli, and M. Schwartz, Molecular Biology of the Cell 4, 953 (1993).
- [39] L. Assoud, R. Messina, and H. Löwen, J. Chem. Phys. 129, 164511 (2008).
- [40] W.-T. Juan and L. I, Phys. Rev. Lett. 80, 3073 (1998).