The Assembly of Milky Way-Like Galaxies Since Note: Accepted for publication in ApJ Letters
Abstract
Galaxies with the mass of the Milky Way dominate the stellar mass density of the Universe but it is uncertain how and when they were assembled. Here we study progenitors of these galaxies out to , using data from the 3D-HST and CANDELS Treasury surveys. We find that galaxies with present-day stellar masses of built % of their stellar mass since , with most of the star formation occurring before . In marked contrast to the assembly history of massive elliptical galaxies, mass growth is not limited to large radii: the mass in the central 2 kpc of the galaxies increased by a factor of between and . We therefore rule out simple models in which bulges were fully assembled at high redshift and disks gradually formed around them. Instead, bulges (and black holes) likely formed in lockstep with disks, through bar instabilities, migration, or other processes. We find that after the growth in the central regions gradually stopped and the disk continued to build, consistent with recent studies of the gas distributions in galaxies and the properties of many spiral galaxies today.
Subject headings
cosmology: observations — galaxies: evolution — Galaxy: structure — Galaxy: formationI. Introduction
The Milky Way is a very typical galaxy, in the sense that a randomly chosen star in the Universe is most often found in a bulge-disk system of similar mass. Despite their ubiquity, and our exquisite knowledge of one example of their class, the assembly history of large spiral galaxies is still uncertain (see Rix & Bovy 2013, and references therein). A key question is when different structural components of the galaxies were formed. The morphology and stellar populations of many spiral galaxies suggest a two-phase scenario, with bulges typically forming at high redshift and disks gradually assembling around them (e.g., Kauffmann, White, & Guiderdoni 1993; Zoccali et al. 2006). Such a purely inside-out scenario would be qualitatively similar to the assembly history of massive ellipticals, which formed a dense core at high redshift and subsequently built up their outer parts (e.g., van Dokkum et al. 2010; Hilz, Naab, & Ostriker 2013).
However, the structural evolution of spiral galaxies is probably more complex than this. In cosmological simulations of gas accretion the structure of the forming galaxy not only depends on the properties of the dark matter but also on the details of the feedback mechanism (e.g., Agertz, Teyssier, & Moore 2011; Brooks et al. 2011) and on the accretion mode (e.g., Sales et al. 2012). Furthermore, major mergers may be too rare to form many bulges (e.g., Kitzbichler & White 2008), and several studies have suggested alternative ways to build up central mass concentrations. In particular, (pseudo-)bulges may be the result of secular evolution (e.g., Kormendy & Kennicutt 2004; Parry et al. 2009), “direct injection” of gas in cold streams (e.g., Sales et al. 2012) and/or migration in unstable disks (Elmegreen, Bournaud, & Elmegreen 2008; Dekel et al. 2009; Krumholz & Dekel 2010). Such clumpy, unstable, rapidly star-forming disks have been shown to exist at high redshift (e.g., Genzel et al. 2008; Förster Schreiber et al. 2011).
In this paper we provide new constraints on the assembly of spiral galaxies by studying plausible progenitors of Milky Way-mass galaxies in the 3D-HST survey (Brammer et al. 2012). The goals are to determine the average star formation histories of these galaxies, to determine the mass growth in their central regions since , and to compare their structural evolution to that of more massive galaxies. The data also provide key constraints on the ingredients in recent hydrodynamical models: these models now succeed in reproducing many of the properties of the present-day Milky Way (Brooks et al. 2011; Guedes et al. 2011) and to improve them further we need to test their predictions at earlier times. A Kroupa (2001) IMF is assumed throughout the paper.

II. Mass Evolution
Following previous studies (e.g., van Dokkum et al. 2010; Papovich et al. 2011; Patel et al. 2013; Leja, van Dokkum, & Franx 2013) we link progenitor and descendant galaxies by requiring that they have the same (cumulative) co-moving number density. Effectively, galaxies are ranked according to their stellar mass and we study galaxies at high redshift that have the same rank order as the Milky Way does at . The implicit assumption is that rank order is conserved through cosmic time, or that processes that break the rank order do not have a strong effect on the average measured properties. As shown in Leja et al. (2013) the method recovers the true mass evolution of galaxies remarkably well in simulations that include merging, quenching, and scatter in the growth rates of galaxies.
The present-day stellar mass of the Milky Way is approximately (Flynn et al. 2006; McMillan 2011). Using the SDSS-GALEX stellar galaxy mass function of Moustakas et al. (2013) we find that galaxies with masses have a number density of Mpc-3. We then trace the progenitors of these galaxies by identifying, at each redshift, the mass for which the cumulative number density is Mpc-3 (see Fig. 1b). We used the Marchesini et al. (2009) mass functions as they are complete in the relevant mass and redshift range; we verified that the results are similar when other mass functions are used (Ilbert et al. 2013; Muzzin et al. 2013).
The stellar mass evolution for galaxies with the rank order of the Milky Way is shown in Fig. 1c. The evolution is rapid from to and relatively slow afterward. We therefore approximate the evolution with a quadratic function of the form
| (1) |
Based on the variation between mass functions of different authors, and the results of Leja et al. (2013), we estimate that the uncertainty in the evolution out to is approximately 0.2 dex.11 1 We verified that changing the evolution does not affect the key results of this paper. More than half of the present-day mass was assembled in the 3 Gyr period between and , and as we show later the mass growth is likely dominated by star formation at all redshifts. The mass evolution is significantly faster than that of more massive galaxies (van Dokkum et al. 2010; Patel et al. 2013), consistent with recent results of Muzzin et al. (2013).

III. Milky Way Progenitors from to
III.1. Rest-frame Images
Having determined the stellar mass evolution with redshift, we can now select galaxies in mass bins centered on this evolving mass and study how their properties changed. We selected galaxies in GOODS-North and GOODS-South as these fields have multi-band ACS and WFC3 imaging (from the GOODS and CANDELS surveys respectively; Giavalisco et al. 2004; Grogin et al. 2011; Koekemoer et al. 2011), as well as WFC3 G141 grism spectra from the 3D-HST program (Brammer et al. 2012). Redshifts, stellar masses, and star formation rates were determined from deep photometric catalogs in these fields, combined with the grism spectra (see Brammer et al. 2012 and references therein, and R. Skelton et al., in preparation). The 3D-HST v2.1 catalogs are % complete in the relevant mass and redshift range, but we note that we rely largely on photometric redshifts (rather than grism redshifts) at .
There are 361 galaxies at in the catalogs whose mass is within dex of . Images of a random subset of 90 are shown in Fig. 2. The images have the same physical scale and represent the same rest-frame filters ( and ). Their brightness is scaled in such a way that their total ( + ) flux is proportional to . The rest-frame and images were created by interpolating the two ACS and/or WFC3 images (smoothed to the resolution) whose central wavelengths are closest to the redshifted and filters.
Also shown are nearby galaxies from the Sloan Digital Sky Survey (SDSS). We selected 40 galaxies with and from the DR7 MPA-JHU catalogs22 2 http://home.strw.leidenuniv.nl/˜jarle/SDSS/ (Brinchmann et al. 2004), and degraded their and images to the same spatial resolution as the high redshift galaxies. A random subset of 10 are shown in Fig. 2.

It is clear from Fig. 2 that present-day galaxies with the mass of the Milky Way have changed over cosmic time. The most obvious change is that galaxies became redder with time, particularly after , indicative of a decrease in the specific star formation rate. The galaxies also appear brighter at lower redshift in Fig. 2, reflecting the mass evolution of Eq. 1. A striking aspect of this change in brightness, and a central result of this paper, is that the bulges appear to change nearly as much as the disks, particularly at . We do not see high density “naked bulges” at around which disks gradually assembled. Instead, the central densities at were much lower than the central densities at . We quantify this result in the remainder of the paper.
III.2. Evolution of Surface Density Profiles
We first analyze the surface density profiles of the galaxies, to study their mass growth as a function of radial distance from their centers. Following van Dokkum et al. (2010) we measured the profiles from stacked images to increase the signal-to-noise ratio. The galaxies were grouped in six bins with mean redshifts , , , , , and . Each bin contains 40–90 galaxies. The rest-frame and band images in each bin were normalized and stacked, aggressively masking all neighboring objects.
The image stacks were corrected for the effects of the point spread function (PSF) following the method outlined in Szomoru et al. (2010). First, a two-dimensional Sersic (1968) model, convolved with the PSF, was fit to the stacks using the GALFIT code (Peng et al. 2010). Then the residuals of this fit were added to the unconvolved Sersic model. As shown in Szomoru et al. (2010) this method reconstructs the true flux distribution with high fidelity, even for galaxies that are poorly fit by Sersic profiles. The resulting radial surface density profiles are shown in Fig. 3. The profiles are derived from the rest-frame band images and scaled such that the total mass within a diameter of 50 kpc is equal to . Errorbars were determined from bootstrapping (see van Dokkum et al. 2010). We note here that the color gradients of the stacks are small ( dex-1) at all redshifts, consistent with other studies (e.g., Szomoru et al. 2013).
There is strong evolution in the overall normalization of the profiles from to and less evolution thereafter, reflecting the mass evolution of Eq. 1. The evolution from to is strikingly uniform: the profiles are roughly parallel to one another in Fig. 3b, and rather than assembling only inside-out the galaxies increase their mass at all radii. This is in marked contrast to more massive galaxies, which form their cores early and exclusively build up their outer parts over this redshift range (see Fig. 6 in van Dokkum et al. 2010 and Fig. 6 in Patel et al. 2013). After the evolution in the central parts slows down but the outer parts continue to build up, consistent with the visual impression that around this time the classical “quiescent bulge and star forming disk” structure of spiral galaxies was established (see Fig. 2).

III.3. Mass Growth at Different Radii
We explicitly show the mass growth at different radii in Fig. 4a. From to the mass outside of kpc increased by dex and the mass inside 2 kpc increased by dex. Although the mass evolution is slightly faster at large radii than at small radii, the trend is qualitatively different from that seen in more massive galaxies: after the mass within 2 kpc is constant to within 0.1 dex for galaxies with (see Fig. 7 of Patel et al. 2013). At later times the central mass growth decreases: from to the mass within 2 kpc grows by only dex.
In Fig. 4b we express the growth in mass as an (implied) star formation rate. The star formation rate was calculated directly from Eq. 1, with a upwards correction to account for mass loss in winds.33 3 This factor is the mass loss after 2 Gyr for a Kroupa (2001) IMF. The implied star formation rate is approximately constant at yr-1 from to and then decreases rapidly to yr-1 at . The form of this star formation history is well approximated by
| (2) |
We can compare Eq. 2 with the actual star formation rates of the galaxies: the points with errorbars in Fig. 4b show the mean star formation rates of the galaxies that went into the analysis, as obtained from SED fits (see Kriek et al. 2009, and Skelton et al., in preparation). With and 5 degrees of freedom the points are consistent with the solid line. This consistency is reassuring, and also implies that the assembly history can be fully explained by star formation, with mergers likely playing a minor role. This can, again, be contrasted with more massive galaxies, as star formation is not sufficient to explain their growth after (van Dokkum et al. 2010).
III.4. Structural Evolution
Finally, we quantify the implications of our results for the structural evolution of galaxies with the present-day mass of the Milky Way. As the mass growth is mostly independent of radius, we expect the structure of the galaxies to remain more or less the same over cosmic time. The evolution of the GALFIT-derived structural parameters of the stacks (see § 3.2) is shown in Fig. 5.
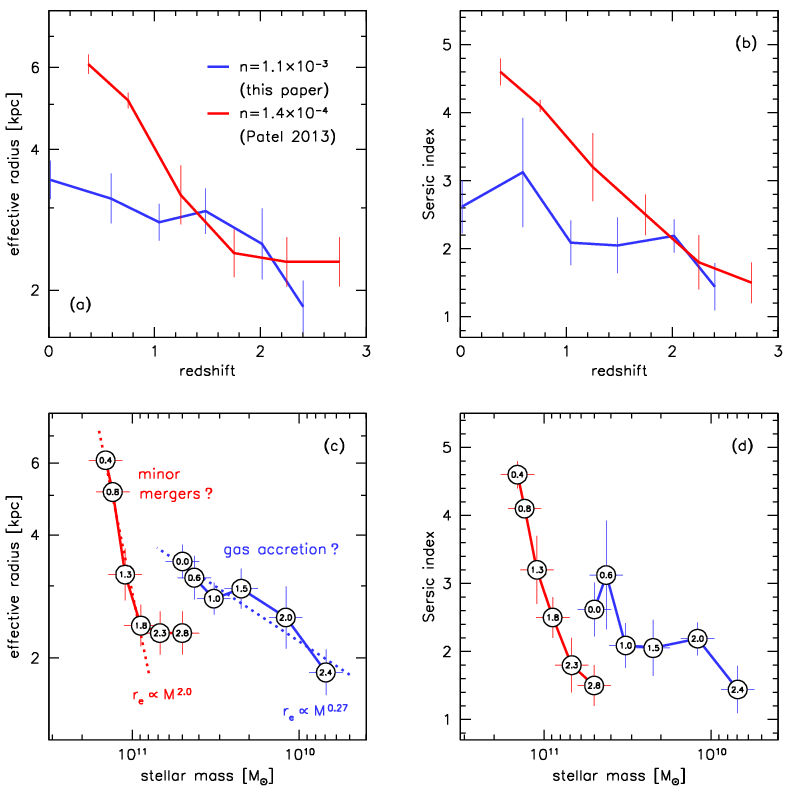
The effective radii and Sersic indices have indeed changed relatively little since , particularly when it is considered that the galaxies increased in mass by a factor of over this time. The radius increased by a factor and the Sersic index changed from to . The red curves show the change in these same parameters for high mass galaxies, calculated in the same way (Patel et al. 2013). Even though the progenitors of today’s massive galaxies increased their mass by only a factor of over this redshift range they show much more dramatic structural evolution.
This point is emphasized in Fig. 5c,d which compares the structural evolution to the mass evolution for both classes of galaxies. The sizes of massive galaxies grow as (van Dokkum et al. 2010; Hilz et al. 2013; Patel et al. 2013), whereas those of galaxies with the mass of the Milky Way grow as . This slope is similar to that of the size-mass relation of late type galaxies (e.g., Shen et al. 2003). We note that an increase in Sersic index does not imply growth of a classical bulge for either class of galaxy (see also Nelson et al. 2013).
IV. Discussion
In this Letter we have demonstrated that it is possible to obtain a description of the formation of galaxies with the mass of the Milky Way all the way from to the present. We find that these galaxies built up % of their stellar mass since . The build-up can be fully explained by the measured star formation rates of the galaxies, and does not require significant merging. A key result of our paper is that the mass growth took place in a fairly uniform way, with the galaxies increasing their mass at all radii. Our results are therefore inconsistent with simple models in which the central parts of spiral gaaxies are fully assembled at early times: we do not find “naked bulges” at high redshift. Instead, they are consistent with models in which bulges (and presumably black holes) were largely built up at the same time as disks, through short-lived peaks in the accretion rate, bar instabilities, migration, or other processes (e.g., Kormendy & Kennicutt 2004; Dekel et al. 2009). The implied star formation rate declines precipitously after , particularly in the central kpc of the galaxies. By we are left with quiescent bulges and slowly star forming disks.
Many other studies have reached similar conclusions using independent arguments; here we limit the discussion to a handful examples. Wuyts et al. (2011) and Nelson et al. (2013) find that star formation at high redshift typically occurs in disks. Nelson et al. (2012) find that galaxies begin to build inside-out at . As noted in § 1 Genzel et al. (2008), Förster Schreiber et al. (2011), and others have identified thick, clumpy star forming disks at . Finally, the inferred star formation history (Eq. 2) is broadly consistent with results from other methods (e.g., Yang et al. 2012; Behroozi, Wechsler, & Conroy 2012).
It is tempting to compare our results directly to known properties of the Milky Way itself; e.g., Eq. 2 implies a star formation rate of yr-1, in reasonably good agreement with that of the Milky Way (Robitaille & Whitney 2010). We note, however, that the Milky Way has a relatively low bulge-to-disk ratio for its mass (e.g., McMillan 2011). Furthermore, the Milky Way, like any other galaxy, has had a unique history and it is fundamentally hazardous to apply the statistical analysis of samples of distant galaxies to an individual nearby galaxy (see, e.g., Fig. 1 of Leja et al. 2013).
As noted in previous Sections, the formation process of galaxies with appears to be very different from that of more massive galaxies. Massive galaxies formed exclusively inside-out since , with their extended wings assembling after formation of a compact core at earlier times. It will be interesting to see if galaxy formation models can reproduce both types of behavior seen in Fig. 5; e.g., it may be that (minor) mergers lead to growth at large radii whereas gas accretion leads to more uniform growth.
This study can be extended and improved in many ways. Most importantly, we have largely ignored systematic uncertainties in our analysis. Among the uncertainties are the low mass end of the mass function at (see, e.g., Reddy & Steidel 2009); possible errors in the number density selection technique (Leja et al. 2013); systematic errors in redshifts and/or masses in the 3D-HST v2.1 catalogs; and the conversion of light-weighted to mass-weighted profiles. We have also ignored the spread in galaxy properties at fixed mass (see, e.g., Baldry et al. 2006; Franx et al. 2008, and Fig. 2). Finally, our analysis is, by its nature, indirect: we do not actually observe the formation of different parts of the galaxies but infer this from changes in their stellar surface densities. Stellar migration and other processes almost certainly altered the orbits of stars after their formation (Roškar et al. 2008). Deep, direct observations of spatially-resolved gas distributions at high redshift, particulary in the crucial epoch , are needed to disentangle formation and migration, and to shed light on the physical processes that are at work (e.g., Nelson et al. 2012, 2013; Freundlich et al. 2013).
- [2] Agertz, O., Teyssier, R., & Moore, B. 2011, MNRAS, 410, 1391
- [4] Baldry, I. K., Balogh, M. L., Bower, R. G., Glazebrook, K., Nichol, R. C., Bamford, S. P., & Budavari, T. 2006, MNRAS, 373, 469
- [6] Behroozi, P. S., Wechsler, R. H., & Conroy, C. 2012, ApJ, submitted (arXiv:1207.6105)
- [8] Brammer, G. B., van Dokkum, P. G., Franx, M., Fumagalli, M., Patel, S., Rix, H.-W., Skelton, R. E., Kriek, M., et al. 2012, ApJS, 200, 13
- [10] Brinchmann, J., Charlot, S., Heckman, T. M., Kauffmann, G., Tremonti, C., & White, S. D. M. 2004, ArXiv Astrophysics e-prints
- [12] Brooks, A. M., Solomon, A. R., Governato, F., McCleary, J., MacArthur, L. A., Brook, C. B. A., Jonsson, P., Quinn, T. R., et al. 2011, ApJ, 728, 51
- [14] Debattista, V. P., Mayer, L., Carollo, C. M., Moore, B., Wadsley, J., & Quinn, T. 2006, ApJ, 645, 209
- [16] Dekel, A., Birnboim, Y., Engel, G., Freundlich, J., Goerdt, T., Mumcuoglu, M., Neistein, E., Pichon, C., et al. 2009, Nature, 457, 451
- [18] Elmegreen, B. G., Bournaud, F., & Elmegreen, D. M. 2008, ApJ, 688, 67
- [20] Flynn, C., Holmberg, J., Portinari, L., Fuchs, B., & Jahreiß, H. 2006, MNRAS, 372, 1149
- [22] Förster Schreiber, N. M., Shapley, A. E., Erb, D. K., Genzel, R., Steidel, C. C., Bouché, N., Cresci, G., & Davies, R. 2011, ApJ, 731, 65
- [24] Franx, M., van Dokkum, P. G., Schreiber, N. M. F., Wuyts, S., Labbé, I., & Toft, S. 2008, ApJ, 688, 770
- [26] Freundlich, J., Combes, F., Tacconi, L. J., Cooper, M. C., Genzel, R., Neri, R., Bolatto, A., Bournaud, F., et al. 2013, ArXiv e-prints
- [28] Genzel, R., Burkert, A., Bouché, N., Cresci, G., Förster Schreiber, N. M., Shapley, A., Shapiro, K., Tacconi, L. J., et al. 2008, ApJ, 687, 59
- [30] Giavalisco, M., Ferguson, H. C., Koekemoer, A. M., Dickinson, M., Alexander, D. M., Bauer, F. E., Bergeron, J., Biagetti, C., et al. 2004, ApJ, 600, L93
- [32] Grogin, N. A., Kocevski, D. D., Faber, S. M., Ferguson, H. C., Koekemoer, A. M., Riess, A. G., Acquaviva, V., Alexander, D. M., et al. 2011, ApJS, 197, 35
- [34] Guedes, J., Callegari, S., Madau, P., & Mayer, L. 2011, ApJ, 742, 76
- [36] Hilz, M., Naab, T., & Ostriker, J. P. 2013, MNRAS, 429, 2924
- [38] Ilbert, O., McCracken, H. J., Le Fevre, O., Capak, P., Dunlop, J., Arnouts, S., Aussel, H., Caputi, K., et al. 2013, ArXiv e-prints
- [40] Kauffmann, G., White, S. D. M., & Guiderdoni, B. 1993, MNRAS, 264, 201
- [42] Kitzbichler, M. G. & White, S. D. M. 2008, MNRAS, 391, 1489
- [44] Koekemoer, A. M., Faber, S. M., Ferguson, H. C., Grogin, N. A., Kocevski, D. D., Koo, D. C., Lai, K., Lotz, J. M., et al. 2011, ApJS, 197, 36
- [46] Kormendy, J., & Kennicutt, R. C., Jr. 2004, ARA&A, 42, 603
- [48] Kriek, M., van Dokkum, P. G., Labbé, I., Franx, M., Illingworth, G. D., Marchesini, D., & Quadri, R. F. 2009, ApJ, 700, 221
- [50] Kroupa, P. 2001, MNRAS, 322, 231
- [52] Krumholz, M. R. & Dekel, A. 2010, MNRAS, 406, 112
- [54] Leja, J., van Dokkum, P., & Franx, M. 2013, ApJ, 766, 33
- [56] Marchesini, D., van Dokkum, P. G., Förster Schreiber, N. M., Franx, M., Labbé, I., & Wuyts, S. 2009, ApJ, 701, 1765
- [58] McMillan, P. J. 2011, MNRAS, 414, 2446
- [60] Moustakas, J., Coil, A., Aird, J., Blanton, M. R., Cool, R. J., Eisenstein, D. J., Mendez, A. J., Wong, K. C., et al. 2013, ArXiv e-prints
- [62] Muzzin, A., Marchesini, D., Stefanon, M., Franx, M., McCracken, H. J., Milvang-Jensen, B., Dunlop, J. S., Fynbo, J. P. U., et al. 2013, ArXiv e-prints
- [64] Nelson, E. J., van Dokkum, P. G., Brammer, G., Förster Schreiber, N., Franx, M., Fumagalli, M., Patel, S., Rix, H.-W., et al. 2012, ApJ, 747, L28
- [66] Nelson, E. J., van Dokkum, P. G., Momcheva, I., Brammer, G., Lundgren, B., Skelton, R. E., Whitaker, K. E., Da Cunha, E., et al. 2013, ApJ, 763, L16
- [68] Papovich, C., Finkelstein, S. L., Ferguson, H. C., Lotz, J. M., & Giavalisco, M. 2011, MNRAS, 412, 1123
- [70] Parry, O. H., Eke, V. R., & Frenk, C. S. 2009, MNRAS, 396, 1972
- [72] Patel, S. G., van Dokkum, P. G., Franx, M., Quadri, R. F., Muzzin, A., Marchesini, D., Williams, R. J., Holden, B. P., et al. 2013, ApJ, 766, 15
- [74] Peng, C. Y., Ho, L. C., Impey, C. D., & Rix, H.-W. 2010, AJ, 139, 2097
- [76] Reddy, N. A. & Steidel, C. C. 2009, ApJ, 692, 778
- [78] Rix, H.-W. & Bovy, J. 2013, ArXiv e-prints
- [80] Robitaille, T. P. & Whitney, B. A. 2010, ApJ, 710, L11
- [82] Roškar, R., Debattista, V. P., Quinn, T. R., Stinson, G. S., & Wadsley, J. 2008, ApJ, 684, L79
- [84] Sales, L. V., Navarro, J. F., Theuns, T., Schaye, J., White, S. D. M., Frenk, C. S., Crain, R. A., & Dalla Vecchia, C. 2012, MNRAS, 423, 1544
- [86] Sersic, J. L. 1968, Atlas de galaxias australes (Cordoba, Argentina: Observatorio Astronomico, 1968)
- [88] Shen, S., Mo, H. J., White, S. D. M., Blanton, M. R., Kauffmann, G., Voges, W., Brinkmann, J., & Csabai, I. 2003, MNRAS, 343, 978
- [90] Szomoru, D., Franx, M., van Dokkum, P. G., Trenti, M., Illingworth, G. D., Labbé, I., Bouwens, R. J., Oesch, P. A., et al. 2010, ApJ, 714, L244
- [92] Szomoru, D., Franx, M., van Dokkum, P. G., Trenti, M., Illingworth, G. D., Labbé, I., & Oesch, P. 2013, ApJ, 763, 73
- [94] van Dokkum, P. G., Whitaker, K. E., Brammer, G., Franx, M., Kriek, M., Labbé, I., Marchesini, D., Quadri, R., et al. 2010, ApJ, 709, 1018
- [96] Wuyts, S., Forster Schreiber, N. M., van der Wel, A., Magnelli, B., Guo, Y., Genzel, R., Lutz, D., Aussel, H., et al. 2011, ArXiv e-prints
- [98] Yang, X., Mo, H. J., van den Bosch, F. C., Zhang, Y., & Han, J. 2012, ApJ, 752, 41
- [100] Zoccali, M., Lecureur, A., Barbuy, B., Hill, V., Renzini, A., Minniti, D., Momany, Y., Gómez, A., et al. 2006, A&A, 457, L1