Simultaneous quantitative imaging of surface and magnetic forces
Abstract
We demonstrate quantitative force imaging of long-range magnetic forces simultaneously with near-surface van-der-Waals and contact-mechanics forces using intermodulation atomic force microscopy. Magnetic forces at the 200 pN level are separated from near-surface forces at the 30 nN level. Imaging of these forces is performed in both the contact and non-contact regimes of near-surface interactions.
Separating and identifying the various forces acting between a sharp tip and a sample surface has been a long standing challenge for the interpretation of contrast in atomic force microscopy (AFM). One typical example is the separation of near-surface forces, such as the attractive van-der-Waals and repulsive contact forces which dominate a few nanometers from the surface, from magnetic [1, 2] or electrostatic [3] forces which dominate at larger distances from the surface. To measure these long-range forces a two-pass method is typically used [4, 5], which has the disadvantage of doubled scan time, loss of resolution and limited ability to measure very close to the surface during the second lifted pass, when the feedback is turned off. Recently multifrequency AFM modes have emerged which provide more measurement channels while scanning [6], allowing single-pass imaging of magnetic forces [7, 8]. Some of these methods have demonstrated the ability to rapidly capture the entire force-distance curve [9, 10, 11, 12, 13, 14, 15] allowing for simultaneous imaging of topography and material properties. In this letter we perform Intermodulation AFM (ImAFM) [16] with a magnetically coated tip and analyze the data so as to separate the long-range magnetic force from near-surface forces, thus obtaining simultaneous imaging of topography, mechanical and magnetic properties in one scan, with a standard cantilever, at a typical scan speed for dynamic AFM.
In narrow-band ImAFM the cantilever is excited simultaneously with two drive tones closely separated in frequency and centered around a resonance frequency of the cantilever. Upon interaction with the surface the nonlinear tip-surface force creates a spectrum of many intermodulation products of the two drive tones (figure 1a), which can be measured by a phase-sensitive lockin technique with good signal-to-noise ratio. We have previously shown that this spectrum contains the information necessary to accurately reconstruct the tip-surface force curve and we have demonstrated several methods of force reconstruction from the raw spectral data [13, 14, 15]. One of these methods involves assuming a parametrized force model for the interaction where the force parameters are determined from the measured spectrum with the help of a numerical solver [13]. Here we performed this model-based force reconstruction method using a force model which takes into account both near-surface and long-range forces. We image a hard disk sample with perpendicular magnetization and observe that the parameters of the long-range force capture the expected magnetic image.
It is difficult to derive a simple and exact analytic expression describing the force between the magnetic AFM tip and the hard disk surface [17, 18]. A good approximate model should have few parameters and the correct asymptotic behavior: The force should go to zero as the distance between the tip and the sample is increased, and the characteristic length for this decay should be the order of the separation of magnetic poles on the surface. We choose a power-law decay,
| (1) |
where is the magnitude of the magnetic force at the position of the surface and the characteristic decay length. We note that the power corresponds to a monopol-monopol while corresponds to dipole-dipole interaction [19, 20]. An estimate of the characteristic decay length is the size of the individual magnetic bits, nm nm [21]. Thus we expect the magnetic force to extend significantly beyond the range of the van-der-Waals force which is typically less than nm.
To account for the surface forces we used the Derjaguin-Muller-Toporov (DMT) model [22, 23]. The DMT model describes the attractive force of van-der-Waals interactions and the repulsive force due to Hertzian contact mechanics. The qualitative shape of the DMT force-distance curve coincides with that observed when a polynomial [15] or model-free force reconstruction [14] is performed on the data. The net force is reconstructed as a function of the cantilever deflection , where is the probe height and the instantaneous position of the tip, both being measured in the laboratory frame. In terms of the cantilever deflection the combined force model reads,
| (2) |
Where is the Hamaker constant, is the intermolecular distance in the van-der-Waals model, is the effective Young’s modulus, the tip radius and the distance to the surface measured from the probe height .
ImAFM was performed in ambient conditions using a Dimension 3100 (Veeco) AFM with an additional multifrequency lock-in amplifier[24] (Intermodulation Products AB) to apply the drive tones and measure the amplitude and phase at 32 response frequencies. A commercially available magnetic force microscopy cantilever MESP-RC (Bruker) was calibrated using the thermal noise method [25, 26]. The resonance frequency was kHz, quality factor and stiffness N/m. The cantilever was driven at kHz and kHz with a total maximum peak-to-peak amplitude of 100 nm. The measurement bandwidth kHz and the image resolution of 256 256 pixels determined a scan speed of 1 line per second. The nominal tip-radius specified by the manufacturer was nm.
In the 32 amplitude and phase images obtained by ImAFM we could identify two different types of contrasts. The first contrast showed an irregular granular structure with nm grains, matching the expected tip radius. We attribute this granular contrast to variations in the surface topography at a scale similar to, or smaller than the tip radius. The second contrast showed larger structures corresponding to the expected magnetic domains. Specifically the nm magnetic tracks as well as groups of bits were visible, although it was unclear if single bits along the track could be resolved. Most of the amplitude and phase images contained a mixture of these two contrasts with one sometimes more dominant in the phase, sometimes more dominant in the amplitude. In general the magnetic contrast was weak compared to the topographic contrast. Figure 1b shows the amplitude and phase images of the lower 11th order intermodulation product at kHz. In this image the granular structure dominates in the amplitude image while both the magnetic and granular contrast can be seen in the phase image.
When reconstructing the force from the intermodulation spectrum with the model-based method, a low number of free parameters aids the solver in finding a distinct minimum of the error function [13]. To reduce the number of free parameters we fixed the characteristic decay length and power of the magnetic force. We systematically investigated parameter ranges of nm and and found no significant qualitative difference in the contrast observed in the image of the parameter . For nm there was a significant reduction in the contrast of the image. These observations are consistent with the magnetic force decay length being large compared to the oscillation range of the cantilever. Therefore we fixed the parameter values nm (average dimension of magnetic bit) and (dipole-dipole interaction) for the remaining analysis. The images of the parameter , the intermolecular distance in the van-der-Waals force model, showed very little contrast so we fixed this parameter to its mean value over the scan area nm. Furthermore we fix the tip radius nm.
The intermodulation spectrum was analyzed to determine the free parameters of the force model eq. (2) at each pixel of the image [13]. The force curves at two pixels marked with crosses in figure 1b, are plotted in figure 1c. The force is dominated by a repulsive interaction of nN at peak indentation and an attractive minima of nN. This relatively strong attractive force indicates a blunt tip, as one might expect from an AFM tip with a magnetic coating. The difference in magnetic force between the two points can be seen in the region a few nanometers away from the surface (figure 1c inset). This difference is quantified in terms of the parameter nN (red cross) and nN (blue cross). The reconstructed magnetic force is found to be much weaker than the near-surface forces, consistent with the amplitude and phase images being dominated by the granular contrast. Nevertheless, both forces are detected simultaneously and separated from one another.
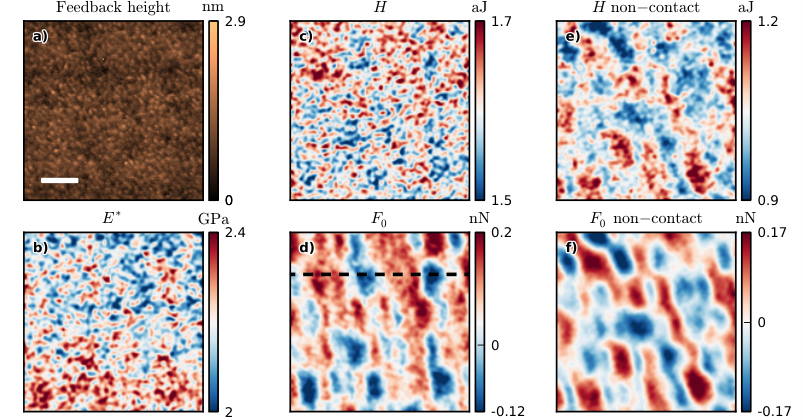
With ImAFM the force inversion is preformed on the intermodulation spectral data stored at each pixel of the scan to create an image of a force parameter. In the parameter images related to the near-surface interactions , and , no prominent features could be seen in the scan area, as expected with a homogeneous sample. However, The long-range force parameter generated an image with features corresponding to the magnetic domains of the sample. The parameter images contain noise and spatial fluctuations caused by the atomic-scale variations in contact geometry. To reduce these effects we applied a spatial Gaussian filter to smooth the parameter values, with a standard deviation nm, the order of the size of the tip (fig. 2, see supplemental material for unsmoothed images). The image (fig. 2d) clearly shows the magnetic structure while the near-surface parameters (fig. 2b and c) show only a granular contrast corresponding the the length scale of the smoothing. We observe both positive and negative values of , each having roughly the same magnitude, consistent with the bits being magnetized perpendicular to the surface.
The granulaity seen together with the magnetic structure in the image (fig. 2d) is the result of cross-talk from the near-surface forces, which are much stronger than the magnetic forces. To mitigate this effect we performed an ImAFM scan where the free-oscillation amplitude was reduced to nm peak-to-peak. Lower stored energy in the reduced-amplitude oscillation resulted in a tip-surface interaction that did not reach the repulsive regime [27], thus removing the largest force contribution. The attractive forces were large enough to allow for stable feedback and scanning. These non-contact measurements were performed with a different cantilever from the same batch having similar calibration values and the magnetic pattern was much more clear in several of the intermodulation amplitude and phase images. For the force reconstruction we used the model eq. 2 for the case only. The tip radius, magnetic decay length and power were again fixed to nm, nm and respectively, and the free parameters , and were obtain from the fit. The parameter image of was much improved (fig. 2f) and the values coincided with that determined at larger oscillation amplitude with a different cantilever. The image of the Hamaker constant (fig. 2e) however showed significant cross-talk with the magnetic image, which may be the result of magnetic forces very close to the surface that are larger than that predicted by the model. Indeed, our model under-estimates the magnetic force at distances less than the bit-size, where a monopol-monopol interaction is expected. Further improvement of the magnetic image may be possible by improving the magnetic design of the tip [28].
One can also visualize the data as slices of the 3-dimensional force volume[29]. Figure 3a shows the function using the fitted and fixed parameter values, plotted the plane for a vertical slice intersecting the plane along the dashed black line in figure 2d. The force, measured as a function of deflection , was corrected by the feedback height , so that the vertical scale in fig. 3a represents the tip position measured from a fixed reference point in the laboratory frame. The white region at the bottom of fig. 3a is outside the range of tip oscillation, and the blue-red interface corresponds to the location of the surface, or the onset of the repulsive force. Figure 3b and c shows slices of the force volume in the plane at different heights, indicated by the two dashed lines in fig 3a. Near the surface (fig. 3b) the van-der-Waals force dominates and at a larger distance from the surface (fig. 3c) the magnetic forces dominate. Two movies showing scans of slices in the both the and planes are available in the supplemental material online at [link].
In conclusion, we demonstrate a novel method to separately image the long-range magnetic forces and near-surface forces in atomic force microscopy. We simultaneously measured the repulsive contact-mechanics force, attractive van-der-Waals force and magnetic force with a single-pass scan, which, to our knowledge, has not been previously demonstrated. The method can also be applied to other long-range forces such as electrostatic forces, and it provides a calibrated means of quantitatively determining of the separate forces. A long term goal of magnetic force imaging is to obtain quantitative measurements of 3-dimensional magnetic fields and magnetization at the sample surface. Achieving this goal requires not only quantitative measurement of force, but also well-characterized magnetic tips and suitable magnetic force models.


References
- [1] S. Hosaka, A. Kikukawa, Y. Honda, H. Koyanagi, and S. Tanaka, Japanese Journal of Applied Physics 31, L904 (1992).
- [2] B. I. Kim, Review of Scientific Instruments 80, 023702 (2009).
- [3] H. W. Hao, Journal of Vacuum Science & Technology B: Microelectronics and Nanometer Structures 9, 1323 (1991).
- [4] R. Giles, J. P. Cleveland, S. Manne, P. K. Hansma, B. Drake, P. Maivald, C. Boles, J. Gurley, and V. Elings, Applied Physics Letters 63, 617 (1993).
- [5] S. Porthun, L. Abelmann, and C. Lodder, Journal of Magnetism and Magnetic Materials 182, 238 (1998).
- [6] R. García and E. T. Herruzo, Nature Nanotechnology 7, 217 (2012).
- [7] J. W. Li, J. P. Cleveland, and R. Proksch, Applied Physics Letters 94, 163118 (2009).
- [8] C. Dietz, E. T. Herruzo, J. R. Lozano, and R. García, Nanotechnology 22, 125708 (2011).
- [9] U. Dürig, New Journal of Physics 2, 5 (2000).
- [10] M. Stark, R. W. Stark, W. M. Heckl, and R. Guckenberger, Proceedings of the National Academy of Sciences of the United States of America 99, 8473 (2002).
- [11] J. Legleiter, M. Park, B. Cusick, and T. Kowalewski, Proceedings of the National Academy of Sciences of the United States of America 103, 4813 (2006).
- [12] O. Sahin, S. Magonov, C. Su, C. F. Quate, and O. Solgaard, Nature nanotechnology 2, 507 (2007).
- [13] D. Forchheimer, D. Platz, E. A. Tholén, and D. Haviland, Physical Review B 85, 1 (2012).
- [14] D. Platz, D. Forchheimer, E. A. Tholén, and D. B. Haviland, Nature Communications 4, 1360 (2013a).
- [15] D. Platz, D. Forchheimer, E. A. Tholén, and D. B. Haviland, , 10 (2013b), arXiv:1302.1829 .
- [16] D. Platz, E. A. Tholén, D. Pesen, and D. B. Haviland, Applied Physics Letters 92, 153106 (2008).
- [17] D. Sarid, Scanning Force Microscopy: With Applications to Electric, Magnetic, and Atomic Forces (Oxford University Press, Cary, NC, USA, 1994) p. 284.
- [18] U. Hartmann, Annual Review of Materials Science 29, 53 (1999).
- [19] J. D. Jackson, Classical Electrodynamics, 2nd ed. (Wiley, New York, 1975) p. 880.
- [20] M. Raşa, B. W. M. Kuipers, and a. P. Philipse, Journal of colloid and interface science 250, 303 (2002).
- [21] Seagate Technology LLC, “Product Manual: Barracuda 7200.11 Serial ATA,” (2008).
- [22] B. Derjaguin, V. Muller, and Y. Toporov, Journal of Colloid and Interface Science 53, 314 (1975).
- [23] R. García, Surface Science Reports 47, 197 (2002).
- [24] E. A. Tholén, D. Platz, D. Forchheimer, V. Schuler, M. O. Tholén, C. Hutter, and D. B. Haviland, Review of Scientific Instruments 82, 026109 (2011).
- [25] J. E. Sader, J. W. M. Chon, and P. Mulvaney, Review of Scientific Instruments 70, 3967 (1999).
- [26] M. J. Higgins, R. Proksch, J. E. Sader, M. Polcik, S. Mc Endoo, J. P. Cleveland, and S. P. Jarvis, Review of Scientific Instruments 77, 013701 (2006).
- [27] S. Santos, L. Guang, T. Souier, K. Gadelrab, M. Chiesa, and N. H. Thomson, Review of Scientific Instruments 83, 043707 (2012).
- [28] L. M. Belova, O. Hellwig, E. Dobisz, and E. Dan Dahlberg, The Review of scientific instruments 83, 093711 (2012).
- [29] B. J. Albers, T. C. Schwendemann, M. Z. Baykara, N. Pilet, M. Liebmann, E. I. Altman, and U. D. Schwarz, Nanotechnology 20, 264002 (2009).