An extended main sequence turn-off in the Small Magellanic Cloud star cluster NGC 411 Thanks: Based on observations with the NASA/ESA Hubble Space Telescope, obtained at the Space Telescope Science Institute, which is operated by the Association of Universities for Research in Astronomy, Inc., under NASA contract NAS5-26555
Abstract
Based on new observations with the Wide Field Camera 3 onboard the Hubble Space Telescope, we report the discovery of an extended main sequence turn-off (eMSTO) in the intermediate-age star cluster NGC 411. This is the second case of an eMSTO being identified in a star cluster belonging to the Small Magellanic Cloud (SMC), after NGC 419. Despite the present masses of these two SMC clusters differ by a factor of , the comparison between their colour–magnitude diagrams (CMD) shows striking similarities, especially regarding the shape of their eMSTOs. The loci of main CMD features are so similar that they can be well described, in a first approximation, by the same mean metallicity, distance and extinction. NGC 411, however, presents merely a trace of secondary red clump as opposed to its prominent manifestation in NGC 419. This could be due either to the small number statistics in NGC 411, or by the star formation in NGC 419 having continued for Myr longer than in NGC 411. Under the assumption that the eMSTOs are caused by different generations of stars at increasing age, both clusters are nearly coeval in their first episodes of star formation. The initial period of star formation, however, is slightly more marked in NGC 419 than in NGC 411. We discuss these findings in the context of possible scenarios for the origin of eMSTOs.
Keywords:
Stars: evolution – Hertzsprung-Russell (HR) and C-M diagrams1 Introduction

The recent discovery of double, multiple, or simply extended main sequence turn-offs (eMSTO) in intermediate-age Magellanic Clusters (Mackey & Broby Nielsen, 2007; Mackey et al., 2008) has generated much interest in the literature, especially after its connection with the phenomenon of multiple populations seen in old globular clusters became clearer (Goudfrooij et al., 2009; Conroy & Spergel, 2011; Girardi et al., 2011; Keller et al., 2011; Mackey et al., 2013). The present understanding is that eMSTOs are simply reflecting multiple episodes of star formation taking place inside the potential well of the cluster, over a time span of a few 100 Myr. Other effects such as a spread in the rotational velocities (Bastian & de Mink, 2009) and the presence of interacting binaries (Yang et al., 2011) may contribute to creating some moderate dispersion in the MSTO, but certainly cannot cause the entire effect as observed: while the hypothesis of rotation have been confuted on both theoretical and observational grounds (Girardi et al., 2000; Platais et al., 2012, see), interacting binaries are expected to make just a very minor fraction of the stars populating such star clusters.
One of the most striking examples of eMSTOs is present in the massive SMC cluster NGC 419 (Glatt et al., 2009), which also presents a dual red clump (RC) of giants (Girardi et al., 2009). Detailed study of its CMD by Rubele et al. (2011) has pointed to an internal age spread of 700 Myr. This is by far the longest detected duration of star formation activity in a Magellanic Cloud star cluster. Massive LMC clusters of the same age present star formation histories (SFH) which last for at most 450 Myr (Rubele et al., 2010; Rubele et al., 2013). Since NGC 419 is the only known example of eMSTO in the SMC, it remains to be explored whether this very long SFH is simply related with its large mass, or if it has been favoured in some way by its host galaxy – either as a result of the different mean metallicity, or of the different dynamical environment, of the SMC as compared to the LMC disk.
In this paper, we present new HST observations that clearly show an eMSTO in the relatively less massive SMC cluster NGC 411 (Sect 2), which is nearly coeval to NGC 419 (Rich et al., 2000). Comparisons with theoretical isochrones and with NGC 419 are presented in Sect. 3. Among other results, NGC 411 is found to have a more compact RC than NGC 419, while sharing about the same spread of the turn-off. Sect. 4 discusses these findings in the context of present scenarios for the formation of eMSTOs.
2 The NGC 411 data
2.1 Data and photometry
The NGC 411 data were obtained during HST cycle 18 program GO-12257 (PI: Girardi), and consist of total exposures of 2200, 1520, and 1980 seconds, respectively, in the , and filters of WFC3/UVIS. The cluster was centred slightly offset from the chip gap. The latter was conveniently covered by means of two dithered exposures. Fig. 1 presents the WFC3 image around the cluster centre.
A detailed description of the data reduction and analysis will be provided in a forthcoming paper (P. Goudfrooij et al., in prep.). Suffice it to mention that the images were processed using standard techniques (Rajan et al., 2010, see) which include bias and dark subtraction, cosmic-ray rejection, flat-fielding, distortion correction and multi-drizzling. The photometry was performed using two different methods: (1) the simultaneous ePSF fitting technique developed by Anderson et al. (2008), and later adapted by him to be used in the WFC3/UVIS images, and (2) the automated pipeline developed by J. Kalirai as described in Kalirai et al. (2012). Both reduction pipelines produced consistent results, so that by default we will just present the data from method (1). No correction for charge transfer inefficiency was performed. The derived photometry was aperture-corrected and calibrated into the Vegamag system as described in Goudfrooij et al. (2009).
2.2 Cluster structural parameters
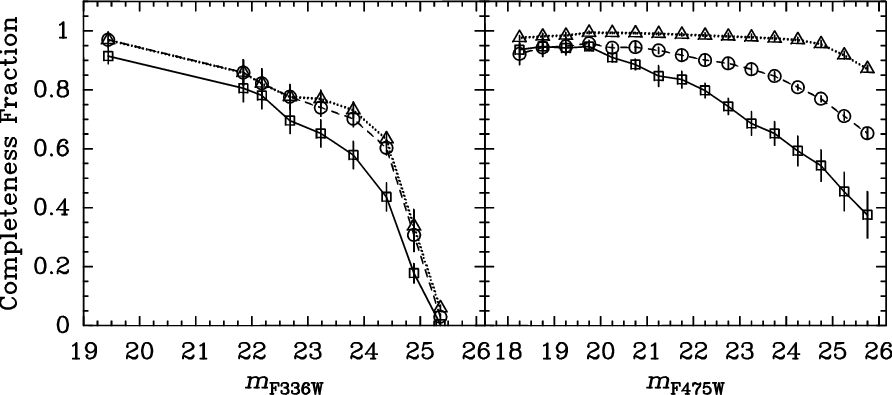
Extensive runs of artificial star tests were performed, giving origin to the completeness functions illustrated in Fig. 2, as a function of magnitude and of the radius from the cluster centre.

The best-fitting King (1962) profile was derived using all stars with mag, and after applying completeness corrections, in the same way as in Goudfrooij et al. (2011). The results are illustrated in Fig. 3. The cluster centre is located at coordinates in the drizzled image (Fig. 1), with a formal error of just 2 pixels in either direction. Other parameters for the fit are ( pc), ″( pc), ellipticity and position angle . These radii are geometric mean values, i.e. , where is the semimajor axis of the ellipse.
For comparison, from the fits of King profiles Mackey & Gilmore (2003) derive pc, while McLaughlin & van der Marel (2005, their tables 10 and 11) derive pc and pc. In both cases is much smaller than our derived value. Note that Mackey & Gilmore (2003) and McLaughlin & van der Marel (2005) use the same set of surface brightness data, originally obtained from Mackey & Gilmore (2003) from the archival WFPC2 images. The smaller area and depth covered by WFPC2 observations, together with overlooking the apparent cluster’s ellipticity, might be at the origin of these different values.
Throughout this paper, NGC 411 will be compared to NGC 419, which apparently is a much bigger cluster in several aspects. According to Glatt et al. (2009), NGC 419 has ″, and ″. Note that NGC 411 turns out to have about the same as NGC 419, but a much smaller (and half-light radius). NGC 411 and NGC 419 have integrated -band magnitudes, inside aperture radii of 100″, of 11.806 and 10.304 mag, respectively (Goudfrooij et al., 2006). Under the assumption that both clusters have similar distances, extinction, ages, metallicities (see below) and mass functions, this magnitude difference translates into a ratio between the present total masses11 1 The integrated 2MASS -band magnitude from Pessev et al. (2006) produces a luminosity ratio of 0.21. This estimate is however expected to be more affected by stochastic fluctuations due to the small numbers of bright RGB and AGB stars per cluster, so we opt for using the -band one. of .
2.3 Colour magnitude diagrams


Figure 4 shows CMDs derived from our data. The top panels refer to the arcmin2 region inside the limit of , which is prevalently populated by cluster stars. In order to illustrate the contamination by the field, the bottom panels show a random subsample ( %) of the field stars at , aimed to represent the same total area as the top panels. It is evident that the field contamination is close to negligible in the cluster core. This can be quantified by star counts in the RC: the cluster region contains 158 RC stars (here broadly defined as stars with , ), whereas the same area of the field contains just RC stars.
A feature evident in the new data is the broad turn-off of NGC 411, especially noticeably in the vs. CMD of Fig. 4. The vs. CMD does not add much to the resolution of this feature, due to the limited colour range at which the turn-offs appear in this diagram.
The eMSTO of NGC 411 has not been noticed in the previous WFPC2 data from Rich et al. (2000), probably because of the much higher photometric errors at that time. In our observations, the photometric errors at the turn-off level () are just 0.03 mag, which is small enough to resolve these fine CMD structures.
In addition to the eMSTOs the cluster CMDs show other well-known features, such as the sequence of binaries parallel to the main sequence, the red giant branch (RGB), a well defined sequence of subgiants, and the early-asymptotic giant branch bump. These sequences will be discussed in more detail in a subsequent paper.
3 Discussion
3.1 Comparison with isochrones
We now give a closer look at the CMD features in NGC 411. Given the insignificance of the field contamination, we will use just the stars at . These CMDs will be compared to theoretical isochrones, and to the NGC 419 data, for which the SMC field contamination is also not a problem (Girardi et al., 2009).

Figure 5 zooms in the MSTO and RC regions in the vs. and vs. diagrams of NGC 411, comparing the cluster data with theoretical isochrones selected from the PARSEC suite v1.1 (Bressan et al., 2012)22 2 http://stev.oapd.inaf.it/cmd; PARSEC isochrones are revised versions of previous Padova sets, converted to the HST WFC3 and ACS filters using the set of transformations described in (Girardi et al., 2008). . The isochrones illustrated are basically an eyeball fit to the vs. diagrams on the right panel, with the vs. on the left panel being used as a consistency check. Five different ages are illustrated, as described below. One of these isochrones is also overplotted in the previous Fig. 4.
We initially select isochrones with a metallicity of dex () and a scaled-solar mixture of metals. With this choice, the position of the main sequence (for mag) is determined by two parameters only: the absolute distance modulus , which just shifts the isochrones vertically in the plot, and the total extinction , which moves the isochrones along the extinction/reddening vectors illustrated in the figure (for mag). A good fit of the observed MS in vs. diagram – and in particular of its leftmost ridge line, which corresponds to sequence of single hydrogen-burning stars – is provided by the pair of values . The rightmost sequence of stars along the MS is easily explained as being a sequence of binaries (both apparent and real). Indeed, the expected position of equal-mass detached binaries is illustrated by the dashed line in Figs. 4 and 5, which is obtained by simply shifting the MS section of the isochrone upward by mag.
The same values provide also a good description of the MS in the vs. diagram, but offset in colour by about mag. We verified that it is not possible to get rid of this offset by simply changing the isochrone metallicity by dex and hence adjusting the values. Rather, we attribute the offset to a possible problem in the colour- relations adopted in the isochrones. This question is irrelevant for this work, since offsets of mag in this diagram would not change any of our conclusions.
After the metallicity and values are fixed, the age range of the isochrones is defined by the location and width of the “golf club” that characterises the eMSTOs in the vs. diagram. We find that the age range from 1.51 to 2.19 Gyr ( from 9.18 to 9.34) comprises the extent of the observed eMSTO in NGC 411. This Gyr interval should be considered just as a rough estimate, since a more accurate evaluation requires taking into account, at least, the photometric errors and the spread in the CMD caused by binaries. Among the isochrones in this age interval, the 1.66-Gyr one (, in orange) reproduces particularly well the mean location of the subgiant branch, and hence is taken as the representative “mean age”, and is also plotted in Fig. 4.
The selected age values are also supported by the comparison between these theoretical isochrones and the location of the RC, shown in the upper panels of Fig. 5. Most of the RC stars appear in a compact and almost-vertical structure towards the red side of the RC. This main concentration is expected for He-burning stars derived from low-mass stars – i.e. stars that developed an electron-degenerate core after the MS and hence climb the RGB, igniting helium at a core mass of (see figure 10 in Bressan et al. 2012). Isochrones for all ages Gyr are able to fit this rightmost RC feature, which comprises about of the RC stars seen in NGC 411.
The remaining RC stars are scattered in a lopsided feature towards the blue and the faint part of the CMD, but still confined over a small section of the vs. diagram (spanning just mag in colour). We note that the isochrone of age 1.51 Gyr (in green) comprises the bulk of stars in this CMD feature. In the isochrones, this feature clearly corresponds to the initial section of the so-called “secondary red clump” (Girardi, 1999, SRC; ), which is the youngest part of the RC, made of stars just massive enough to have ignited helium in non-degenerate conditions.
3.2 Comparison with NGC 419
We now compare the NGC 411 data and best-fit isochrones with the data for the NGC 419 cluster which, as first noticed by Rich et al. (2000), has about the same age as NGC 411. NGC 419 is also a cluster with a well-marked eMSTO (Glatt et al., 2009) and a dual red clump (Girardi et al., 2009). When interpreted in terms of age spread only, these CMD features lead to an impressive -Myr long period of star formation in NGC 419 (Rubele et al., 2010).

NGC 419 data comes partially from the ACS/WFC observations in GO-10396 (PI: J.S. Gallagher) in the filters and , re-reduced in a similar way as the NGC 411 data33 3 Throughout this paper, we denote ACS/WFC filters with the subscript A. When no subscript is provided, we are referring to WFC3/UVIS filters. To these ACS images, we have added data from WFC3/UVIS obtained in our GO-12257 program, with the cluster centre positioned just slightly offset from the chip gap as for NGC 411. Since the filters are not the same as for NGC 411, we have derived the equivalent of WFC3 filters using the following approximations derived from Bressan et al. (2012) isochrones44 4 The isochrones take fully into account the different filter throughputs of ACS/WFC and WFC3/UVIS filters, and their impact on bolometric corrections and -colour transformations (Girardi et al., 2008, see).:
| (1) |
These approximations give origin to the quantities
| (2) | |||||
which are plotted in Fig. 6 as a function of the colour in the WFC3/UVIS system, i.e. . As can be appreciated, the relations from Eq. 1 turn out to be accurate to within 0.01 mag in magnitude, and 0.02 mag in colour, over the entire interval of interest in this paper, and for both dwarfs and giants. We checked that the same numbers apply over the entire metallicity range , which comprises most of the metallicity determinations of SMC field and cluster stars (Carrera et al., 2008; Piatti, 2012, e.g.). Such mag errors, though systematic, are small enough to be ignored in the context of this paper.

NGC 419 is located in an area towards the SMC Wing with about 2.3 times more SMC field population than that for NGC 411. Moreover, the NGC 419 centre presents a much larger density and is not as free from crowding as NGC 411. In order to circumvent these problems, we have selected NGC 419 stars within an annulus with radius between 400 and 800 WFC3/UVIS pixels55 5 We recall that 1 ACS/WFC pixel corresponds to 1.25 WFC3/UVIS pixel. (16 to 32″, or to 9.3 pc) from the cluster centre. This represents an area comparable to the one selected for NGC 411, but with about twice its numbers of cluster and SMC field stars.
Figure 7 presents the comparison between NGC 419 data and the same theoretical isochrones used in Fig. 5. Isochrone parameters – including distance, extinction, metallicity and ages – are exactly the same as used for NGC 411. A difference w.r.t. Fig. 5, is that the isochrone colours and magnitudes, presented in the WFC3 filters, were also derived from the ACS ones via the relations in Eq. 1. In this way, we keep a high level of consistency between data and models, while producing a plot that has a very similar colour-magnitude scale as the one for NGC 411.


A few aspects in this comparison with the isochrones and with the NGC 411 data, are remarkable:
- 1.
The same isochrone parameters that were used to fit NGC 411, produce a nice fit of NGC 419 as well – with, perhaps, just minor adjustments being required in the adopted extinction. Indeed, we have observed that a slightly better reproduction of the RC and MSTO loci would have been obtained with a slightly larger value of (namely 0.28 instead of 0.25 mag) for NGC 419; however, for the sake of clarity in the comparison, we still adopt the same extinction value as for NGC 411, in all our plots.
- 2.
The extent of the eMSTO is very similar in NGC 411 and NGC 419. Possibly there are differences at the bottom part of the eMSTOs, corresponding to the oldest stellar ages, which is also the CMD region in which binaries may have the largest effect in the CMD features. It is hard to tell whether these differences come from the different level of crowding between the two clusters, or if they are due to the two clusters spanning a different age interval.
- 3.
Although the main concentration of RC stars is in very much the same CMD position for the two clusters, the SRC is clearly more extended towards fainter magnitudes in NGC 419 than in NGC 411. In particular, the NGC 419 CMD presents a clear concentration of SRC stars at and , which does not appear in NGC 411.
It suffices to look at the youngest isochrone in the comparison – in this case the 1.45 Gyr one, in blue – to explain this more extended SRC in NGC 419. As thoroughly discussed in Girardi et al. (2009), this 0.5 mag faint extension of the RC is the undeniable signature of stellar cores that were just massive enough to ignite helium before the onset of electron-degeneracy. Although these conditions can be produced by means of interacting binaries of slightly older ages (Yang et al., 2011), an easy way of producing these stars in copious numbers is simply that of assuming that slightly more massive (and younger) stars are present in the cluster. In the case of the comparison between NGC 411 and NGC 419, the difference in the red clump morphology can be explained by NGC 419 having a youngest population which is just 60 Myr younger than the youngest population is NGC 411.
Figure 8 compares the luminosity function (LF) of RC stars between the two clusters, after scaling them to the same total number as in NGC 411. The similarity between the two LFs is remarkable, but with one significant difference: the deficit of SRC stars in NGC 411, at . A two-sample Kolmogorov-Smirnov (KS) test reveals a probability of 3 % that these distributions are drawn from the same intrinsic one. However, if we correct the NGC 419 data points by an extinction of just mag, the same KS turns out to provide significantly higher probabilities, as high as 97 %. Therefore, the difference between the RC morphologies cannot be regarded as statistically significant.
Figure 9 instead compares the eMSTO region between the two clusters. Following the same kind of analysis as performed in Goudfrooij et al. (2011) for LMC clusters, we draw an approximate sequence of ages across the eMSTOs, by means of the inclined parallelogram shown in the plot. This is almost identical to the one used by Goudfrooij et al. (2011), but shifted to significantly bluer colours so as to take into account the overall shift of the CMD, due to the lower SMC metallicities66 6 In LMC clusters with eMSTOs, like NGC 1751, NGC 1783, NGC 1806, and NGC 1846, the eMSTOs appears at colours (Goudfrooij et al., 2011, see).. This parallelogram avoids as much as possible the crossing of isochrones of different ages, and the presence of apparent binaries, that occurs at the top-right extremity of the eMSTO region. Stars are counted across this area of the CMD, in the small boxes as indicated, giving origin to the “pseudo-age” sequences plotted in the bottom panel.
Here, the similarity between the eMSTOs in the two clusters is again evident: both comprise very much the same total interval of colours and hence pseudo-ages, and the same peak at . The oldest bin for which the star counts are significant, corresponds to ages of about 2.2 Gyr, whereas the youngest one corresponds to ages of about 1.5 Gyr. There is also a subtle difference between the two histograms: NGC 419 contains relatively more older MSTO stars than NGC 411. At first sight, the effect seems to be significant: a two-sample KS test indicates a probability of % that the two distributions are drawn from the same intrinsic one. However, when correcting the NGC 419 data by a small relative extinction w.r.t. NGC 411 of the order of mag, we find that the null hypothesis – that both distributions of pseudo-ages follow from the same intrinsic one – reaches probability values as high as %.
Although these comparisons point to a great similarity between the CMDs of NGC 411 and NGC 419, it is clear that any quantitative conclusion about their differences has to wait for a more detailed analysis, that takes into account all the possible (and likely) small differences between the cluster distances, extinctions, and metallicities, as well as the different photometry.
4 Summary and concluding remarks
Based on the new HST observations with the WFC3/UVIS camera, we report the discovery of eMSTOs in the SMC intermediate-age cluster NGC 411. The same cluster presents a slightly-broadened RC, compatible with the presence of stars that, after their main sequence, developed a core mass just massive enough to ignite helium in non-degenerate conditions.
This is, after NGC 419 (Glatt et al., 2009; Girardi et al., 2009), just the second SMC cluster to present such features in their CMDs. eMSTOs have been uncovered in 13 clusters of similar ages in the LMC (Milone et al., 2009; Piatti, 2013; Keller et al., 2012, and references therein), among which at least 6 do also seem to present a dual RC (Girardi et al., 2009). The smaller number of such clusters in the SMC is expected, because the SMC contains significantly fewer intermediate-age and populous clusters than the LMC. Moreover, just a handful of them has been observed with high resolution by HST. Present observations seem to indicate that eMSTOs are as frequent an occurrence in the SMC clusters as in the LMC. Whatever is causing such phenomenon, it happens as well for all metallicities in the range .
Keller et al. (2011); Keller et al. (2012) find that all LMC clusters with eMSTOs are located in a well-defined region of the core radius–age diagram, with pc and ages between 1 and 2 Gyr (see figure 4 in Keller et al. 2012). With mean ages of Gyr and core radii of 4.2 pc and 4.5 pc, respectively, both NGC 411 and NGC 419 fall well within the same region of this diagram, although close to the upper age limit at which eMSTOs become difficult to resolve. It will be quite interesting to check if the same trends persist when data for more SMC clusters become available.
Another result is that, in terms of their global CMD features, NGC 411 and NGC 419 are nearly perfect twins, despite the former being about 4 times less massive and populous than the latter. After having transformed NGC 419 observations – partially obtained with ACS/WFC – to the same filter system as NGC 411, we have observed just minor differences between their CMDs, which could be partially attributed to minor offsets in their extinction values, small inadequacies in the transformation equations, or to the different photometric conditions in both clusters – the NGC 419 core being significantly more crowded. The differences are essentially: (1) NGC 411 appears to have a deficit of SRC stars as compared to NGC 419. This deficit could be explained either by the small number statistics, or by simply assuming that the youngest episode of star formation in NGC 419 is about 60 Myr younger than in NGC 411. (2) The eMSTO in NGC 419 is slightly more weighted towards older ages than in NGC 411. Both differences, however, become much less significant when the NGC 419 data is corrected by a difference in -band extinction of mag w.r.t. NGC 411.
The fact that both NGC 411 and NGC 419 clusters have nearly the same mean age was already noticed by Rich et al. (2000), using previous WFPC2 observations. They also identify a third cluster with apparently the same age (namely NGC 152), and suggest a major episode of cluster formation in the SMC. Our present observations confirm this picture, adding the evidence that NGC 411 and NGC 419 have some more properties in common than simply their mean age.
In the context of the present ongoing discussion about the origin of eMSTOs, the present observations are intriguing. If we assume that the only factor causing eMSTOs and dual RCs in these clusters are their extended histories of star formation, we are compelled to conclude that NGC 411 continued forming stars for a period almost as long as NGC 419, despite the latter being a much more massive cluster (with about 4 times the NGC 411 present total mass). The less pronounced SRC in NGC 411 is the only indication that it may have stopped its internal star formation at earlier ages than NGC 419. A modest 60 Myr earlier halt in SFH (as compared to the total Myr) would suffice to explain the difference.
Such long periods of star formation, occurring in two isolated clusters in a very similar way despite their very different present masses, is puzzling. One possibility is that the NGC 411 total mass was significantly higher in the past, so that both clusters had high enough escape velocity while the star formation was occurring in their centres. This aspect will be investigated in forthcoming papers.
On the other hand, our observations do not fit easily on the alternative explanations for the eMSTOs and dual RCs, that have been advanced by other authors. Indeed, two other possibilities are to be considered here:
- 1.
A spread in rotation among coeval stars, as suggested by Bastian & de Mink (2009): As demonstrated by Girardi et al. (2011), this effect is unlikely to cause eMSTOs, just because rotation extends the main sequence lifetimes. When isochrones are built from “rotating” evolutionary tracks, the increase in lifetimes largely compensates for the redward extension of the tracks due to rotation. The net effect is that coeval populations with and without rotation present a very modest spread in their turn-offs. Note that Li et al. (2012) have recently repeated the same mistake of ignoring the effect of rotation in lifetimes. At present, such a “picture” for the formation of eMSTOs is simply missing any convincing demonstration that it may cause eMSTOs in coeval clusters77 7 Such a demonstration has to be done using either coeval isochrones or simulated CMDs for rotating and non-rotating stars, as done in Girardi et al. (2011), and not “corrections based on evolutionary tracks”, as done in Bastian & de Mink (2009) and Li et al. (2012).. On the other hand, recent observations by Platais et al. (2012) found that rotation causes just a very modest broadening of the MSTO in the intermediate-age open cluster Tr 20, in agreement with the model predictions by Girardi et al. (2011).
- 2.
The presence of interacting binaries, that could contribute to eMSTOs and dual red clumps as shown by Yang et al. (2011): One main difficulty in this case is in explaining the high frequency (about 15% of all RC stars; Girardi et al. 2009) of SRC stars in a cluster such as NGC 419, which would require an extremely high fraction of interacting binaries. The fraction of non-interacting binaries in NGC 419, as detected from the sequence parallel to the cluster main sequence, is a modest % (limited to the interval of mass ratios between and 1, Rubele et al. 2010). So, in order to explain NGC 419 observations with binaries only, we would have to assume it contains nearly as many interacting binaries than non-interacting ones, which as far as we know, would be an unprecedented and very challenging observation.
Overall, our observation of a very extended MSTO in NGC 411 – almost as extended as in NGC 419 – adds a puzzle to an already confusing scenario. Although we are favouring the Occam’s Razor picture of extended SFHs occurring inside these clusters – simply because it has been shown to work in a quantitative way (Girardi et al., 2009; Rubele et al., 2010; Rubele et al., 2011; Rubele et al., 2013, see ) – we have to admit that the similarity of such CMDs in clusters of very different mass is intriguing. We are confident that the solutions for these issues will come from more observations of intermediate-age LMC and SMC clusters, together with even more accurate modelling of their CMDs. We are going to pursue both ways in upcoming papers.
Acknowledgements
We are grateful to Jay Anderson for sharing his ePSF program. The data presented in this paper were partially obtained from the Multimission Archive at the Space Telescope Science Institute (MAST). Support for HST Program GO-12257 was provided by NASA through a grant from the Space Telescope Science Institute, which is operated by the Association of Universities for Research in Astronomy, Inc., under NASA contract NAS5–26555. We thank the partial support from contract ASI-INAF I/016/07/0.
References
- Bastian & de Mink (2009) Bastian N., de Mink S. E., 2009, MNRAS, 398, L11
- Bressan et al. (2012) Bressan A., Marigo P., Girardi L., Salasnich B., Dal Cero C., Rubele S., Nanni A., 2012, MNRAS, 427, 127
- Carrera et al. (2008) Carrera R., Gallart C., Hardy E., Aparicio A., Zinn R., 2008, AJ, 135, 836
- Conroy & Spergel (2011) Conroy C., Spergel D. N., 2011, ApJ, 726, 36
- Girardi (1999) Girardi L., 1999, MNRAS, 308, 818
- Girardi et al. (2000) Girardi L., Bressan A., Bertelli G., Chiosi C., 2000, A&AS, 141, 371
- Girardi et al. (2008) Girardi L. et al., 2008, PASP, 120, 583
- Girardi et al. (2011) Girardi L., Eggenberger P., Miglio A., 2011, MNRAS, 412, L103
- Girardi et al. (2009) Girardi L., Rubele S., Kerber L., 2009, MNRAS, 394, L74
- Glatt et al. (2009) Glatt K. et al., 2009, AJ, 138, 1403
- Goudfrooij et al. (2006) Goudfrooij P., Gilmore D., Kissler-Patig M., Maraston C., 2006, MNRAS, 369, 697
- Goudfrooij et al. (2009) Goudfrooij P., Puzia T. H., Kozhurina-Platais V., Chandar R., 2009, AJ, 137, 4988
- Goudfrooij et al. (2011) Goudfrooij P., Puzia T. H., Kozhurina-Platais V., Chandar R., 2011, ApJ, 737, 3
- Kalirai et al. (2012) Kalirai J. S. et al., 2012, AJ, 143, 11
- Keller et al. (2012) Keller S. C., Dougal Mackey A., Da Costa G. S., 2012, ApJ, 761, L5
- Keller et al. (2011) Keller S. C., Mackey A. D., Da Costa G. S., 2011, ApJ, 731, 22
- King (1962) King I., 1962, AJ, 67, 471
- Li et al. (2012) Li Z., Mao C., Chen L., Zhang Q., 2012, ApJ, 761, L22
- Mackey & Broby Nielsen (2007) Mackey A. D., Broby Nielsen P., 2007, MNRAS, 379, 151
- Mackey et al. (2008) Mackey A. D., Broby Nielsen P., Ferguson A. M. N., Richardson J. C., 2008, ApJ, 681, L17
- Mackey et al. (2013) Mackey A. D., Da Costa G. S., Ferguson A. M. N., Yong D., 2013, ApJ, 762, 65
- Mackey & Gilmore (2003) Mackey A. D., Gilmore G. F., 2003, MNRAS, 338, 120
- McLaughlin & van der Marel (2005) McLaughlin D. E., van der Marel R. P., 2005, ApJS, 161, 304
- Milone et al. (2009) Milone A. P., Bedin L. R., Piotto G., Anderson J., 2009, A&A, 497, 755
- Pessev et al. (2006) Pessev P. M., Goudfrooij P., Puzia T. H., Chandar R., 2006, AJ, 132, 781
- Piatti (2012) Piatti A. E., 2012, MNRAS, 422, 1109
- Piatti (2013) Piatti A. E., 2013, MNRAS, in press, arXiv:1301.1627
- Platais et al. (2012) Platais I. et al., 2012, ApJ, 751, L8
- Rajan et al. (2010) Rajan et al. A., 2010, WFC3 Data Handbook. Tech. rep., Space Telescope Science Institute
- Rich et al. (2000) Rich R. M., Shara M., Fall S. M., Zurek D., 2000, AJ, 119, 197
- Rubele et al. (2011) Rubele S., Girardi L., Kozhurina-Platais V., Goudfrooij P., Kerber L., 2011, MNRAS, 414, 2204
- Rubele et al. (2013) Rubele S., Girardi L., Kozhurina-Platais V., Kerber L., Goudfrooij P., Bressan A., Marigo P., 2013, MNRAS, in press, arXiv:1301.3381
- Rubele et al. (2010) Rubele S., Kerber L., Girardi L., 2010, MNRAS, 403, 1156
- Yang et al. (2011) Yang W., Meng X., Bi S., Tian Z., Li T., Liu K., 2011, ApJ, 731, L37