J. P. Lees
Affiliation: Laboratoire d’Annecy-le-Vieux de Physique des Particules (LAPP), Université de Savoie, CNRS/IN2P3, F-74941 Annecy-Le-Vieux, France
V. Poireau
Affiliation: Laboratoire d’Annecy-le-Vieux de Physique des Particules (LAPP), Université de Savoie, CNRS/IN2P3, F-74941 Annecy-Le-Vieux, France
V. Tisserand
Affiliation: Laboratoire d’Annecy-le-Vieux de Physique des Particules (LAPP), Université de Savoie, CNRS/IN2P3, F-74941 Annecy-Le-Vieux, France
E. Grauges
Affiliation: Universitat de Barcelona, Facultat de Fisica, Departament ECM, E-08028 Barcelona, Spain
A. PalanoabAffiliation: INFN Sezione di Baria; Dipartimento di Fisica, Università di Barib, I-70126 Bari, Italy
G. Eigen
Affiliation: University of Bergen, Institute of Physics, N-5007 Bergen, Norway
B. Stugu
Affiliation: University of Bergen, Institute of Physics, N-5007 Bergen, Norway
D. N. Brown
Affiliation: Lawrence Berkeley National Laboratory and University of California, Berkeley, California 94720, USA
L. T. Kerth
Affiliation: Lawrence Berkeley National Laboratory and University of California, Berkeley, California 94720, USA
Yu. G. Kolomensky
Affiliation: Lawrence Berkeley National Laboratory and University of California, Berkeley, California 94720, USA
M. Lee
Affiliation: Lawrence Berkeley National Laboratory and University of California, Berkeley, California 94720, USA
G. Lynch
Affiliation: Lawrence Berkeley National Laboratory and University of California, Berkeley, California 94720, USA
H. Koch
Affiliation: Ruhr Universität Bochum, Institut für Experimentalphysik 1, D-44780 Bochum, Germany
T. Schroeder
Affiliation: Ruhr Universität Bochum, Institut für Experimentalphysik 1, D-44780 Bochum, Germany
C. Hearty
Affiliation: University of British Columbia, Vancouver, British Columbia, Canada V6T 1Z1
T. S. Mattison
Affiliation: University of British Columbia, Vancouver, British Columbia, Canada V6T 1Z1
J. A. McKenna
Affiliation: University of British Columbia, Vancouver, British Columbia, Canada V6T 1Z1
R. Y. So
Affiliation: University of British Columbia, Vancouver, British Columbia, Canada V6T 1Z1
A. Khan
Affiliation: Brunel University, Uxbridge, Middlesex UB8 3PH, United Kingdom
V. E. Blinov
Affiliation: Budker Institute of Nuclear Physics SB RAS, Novosibirsk 630090, Russia
A. R. Buzykaev
Affiliation: Budker Institute of Nuclear Physics SB RAS, Novosibirsk 630090, Russia
V. P. Druzhinin
Affiliation: Budker Institute of Nuclear Physics SB RAS, Novosibirsk 630090, Russia
V. B. Golubev
Affiliation: Budker Institute of Nuclear Physics SB RAS, Novosibirsk 630090, Russia
E. A. Kravchenko
Affiliation: Budker Institute of Nuclear Physics SB RAS, Novosibirsk 630090, Russia
A. P. Onuchin
Affiliation: Budker Institute of Nuclear Physics SB RAS, Novosibirsk 630090, Russia
S. I. Serednyakov
Affiliation: Budker Institute of Nuclear Physics SB RAS, Novosibirsk 630090, Russia
Yu. I. Skovpen
Affiliation: Budker Institute of Nuclear Physics SB RAS, Novosibirsk 630090, Russia
E. P. Solodov
Affiliation: Budker Institute of Nuclear Physics SB RAS, Novosibirsk 630090, Russia
K. Yu. Todyshev
Affiliation: Budker Institute of Nuclear Physics SB RAS, Novosibirsk 630090, Russia
A. N. Yushkov
Affiliation: Budker Institute of Nuclear Physics SB RAS, Novosibirsk 630090, Russia
D. Kirkby
Affiliation: University of California at Irvine, Irvine, California 92697, USA
A. J. Lankford
Affiliation: University of California at Irvine, Irvine, California 92697, USA
M. Mandelkern
Affiliation: University of California at Irvine, Irvine, California 92697, USA
B. Dey
Affiliation: University of California at Riverside, Riverside, California 92521, USA
J. W. Gary
Affiliation: University of California at Riverside, Riverside, California 92521, USA
O. Long
Affiliation: University of California at Riverside, Riverside, California 92521, USA
G. M. Vitug
Affiliation: University of California at Riverside, Riverside, California 92521, USA
C. Campagnari
Affiliation: University of California at Santa Barbara, Santa Barbara, California 93106, USA
M. Franco Sevilla
Affiliation: University of California at Santa Barbara, Santa Barbara, California 93106, USA
T. M. Hong
Affiliation: University of California at Santa Barbara, Santa Barbara, California 93106, USA
D. Kovalskyi
Affiliation: University of California at Santa Barbara, Santa Barbara, California 93106, USA
J. D. Richman
Affiliation: University of California at Santa Barbara, Santa Barbara, California 93106, USA
C. A. West
Affiliation: University of California at Santa Barbara, Santa Barbara, California 93106, USA
A. M. Eisner
Affiliation: University of California at Santa Cruz, Institute for Particle Physics, Santa Cruz, California 95064, USA
W. S. Lockman
Affiliation: University of California at Santa Cruz, Institute for Particle Physics, Santa Cruz, California 95064, USA
A. J. Martinez
Affiliation: University of California at Santa Cruz, Institute for Particle Physics, Santa Cruz, California 95064, USA
B. A. Schumm
Affiliation: University of California at Santa Cruz, Institute for Particle Physics, Santa Cruz, California 95064, USA
A. Seiden
Affiliation: University of California at Santa Cruz, Institute for Particle Physics, Santa Cruz, California 95064, USA
D. S. Chao
Affiliation: California Institute of Technology, Pasadena, California 91125, USA
C. H. Cheng
Affiliation: California Institute of Technology, Pasadena, California 91125, USA
B. Echenard
Affiliation: California Institute of Technology, Pasadena, California 91125, USA
K. T. Flood
Affiliation: California Institute of Technology, Pasadena, California 91125, USA
D. G. Hitlin
Affiliation: California Institute of Technology, Pasadena, California 91125, USA
P. Ongmongkolkul
Affiliation: California Institute of Technology, Pasadena, California 91125, USA
F. C. Porter
Affiliation: California Institute of Technology, Pasadena, California 91125, USA
R. Andreassen
Affiliation: University of Cincinnati, Cincinnati, Ohio 45221, USA
Z. Huard
Affiliation: University of Cincinnati, Cincinnati, Ohio 45221, USA
B. T. Meadows
Affiliation: University of Cincinnati, Cincinnati, Ohio 45221, USA
M. D. Sokoloff
Affiliation: University of Cincinnati, Cincinnati, Ohio 45221, USA
L. Sun
Affiliation: University of Cincinnati, Cincinnati, Ohio 45221, USA
P. C. Bloom
Affiliation: University of Colorado, Boulder, Colorado 80309, USA
W. T. Ford
Affiliation: University of Colorado, Boulder, Colorado 80309, USA
A. Gaz
Affiliation: University of Colorado, Boulder, Colorado 80309, USA
U. Nauenberg
Affiliation: University of Colorado, Boulder, Colorado 80309, USA
J. G. Smith
Affiliation: University of Colorado, Boulder, Colorado 80309, USA
S. R. Wagner
Affiliation: University of Colorado, Boulder, Colorado 80309, USA
R. Ayad
Affiliation: Now at the University of Tabuk, Tabuk 71491, Saudi Arabia
W. H. Toki
Affiliation: Colorado State University, Fort Collins, Colorado 80523, USA
B. Spaan
Affiliation: Technische Universität Dortmund, Fakultät Physik, D-44221 Dortmund, Germany
K. R. Schubert
Affiliation: Technische Universität Dresden, Institut für Kern- und Teilchenphysik, D-01062 Dresden, Germany
R. Schwierz
Affiliation: Technische Universität Dresden, Institut für Kern- und Teilchenphysik, D-01062 Dresden, Germany
D. Bernard
Affiliation: Laboratoire Leprince-Ringuet, Ecole Polytechnique, CNRS/IN2P3, F-91128 Palaiseau, France
M. Verderi
Affiliation: Laboratoire Leprince-Ringuet, Ecole Polytechnique, CNRS/IN2P3, F-91128 Palaiseau, France
S. Playfer
Affiliation: University of Edinburgh, Edinburgh EH9 3JZ, United Kingdom
D. BettoniaAffiliation: INFN Sezione di Ferraraa; Dipartimento di Fisica e Scienze della Terra, Università di Ferrarab, I-44122 Ferrara, Italy
C. BozziaAffiliation: INFN Sezione di Ferraraa; Dipartimento di Fisica e Scienze della Terra, Università di Ferrarab, I-44122 Ferrara, Italy
R. CalabreseabAffiliation: INFN Sezione di Ferraraa; Dipartimento di Fisica e Scienze della Terra, Università di Ferrarab, I-44122 Ferrara, Italy
G. CibinettoabAffiliation: INFN Sezione di Ferraraa; Dipartimento di Fisica e Scienze della Terra, Università di Ferrarab, I-44122 Ferrara, Italy
E. FioravantiabAffiliation: INFN Sezione di Ferraraa; Dipartimento di Fisica e Scienze della Terra, Università di Ferrarab, I-44122 Ferrara, Italy
I. GarziaabAffiliation: INFN Sezione di Ferraraa; Dipartimento di Fisica e Scienze della Terra, Università di Ferrarab, I-44122 Ferrara, Italy
E. LuppiabAffiliation: INFN Sezione di Ferraraa; Dipartimento di Fisica e Scienze della Terra, Università di Ferrarab, I-44122 Ferrara, Italy
L. PiemonteseaAffiliation: INFN Sezione di Ferraraa; Dipartimento di Fisica e Scienze della Terra, Università di Ferrarab, I-44122 Ferrara, Italy
V. SantoroaAffiliation: INFN Sezione di Ferraraa; Dipartimento di Fisica e Scienze della Terra, Università di Ferrarab, I-44122 Ferrara, Italy
R. Baldini-Ferroli
Affiliation: Also with Università di Perugia, Dipartimento di Fisica, Perugia, Italy
A. Calcaterra
Affiliation: Also with Università di Perugia, Dipartimento di Fisica, Perugia, Italy
R. de Sangro
Affiliation: Also with Università di Perugia, Dipartimento di Fisica, Perugia, Italy
G. Finocchiaro
Affiliation: Also with Università di Perugia, Dipartimento di Fisica, Perugia, Italy
S. Martellotti
Affiliation: Also with Università di Perugia, Dipartimento di Fisica, Perugia, Italy
P. Patteri
Affiliation: Also with Università di Perugia, Dipartimento di Fisica, Perugia, Italy
I. M. Peruzzi
Affiliation: Also with Università di Perugia, Dipartimento di Fisica, Perugia, Italy
M. Piccolo
Affiliation: INFN Laboratori Nazionali di Frascati, I-00044 Frascati, Italy
M. Rama
Affiliation: INFN Laboratori Nazionali di Frascati, I-00044 Frascati, Italy
A. Zallo
Affiliation: INFN Laboratori Nazionali di Frascati, I-00044 Frascati, Italy
R. ContriabAffiliation: INFN Sezione di Genovaa; Dipartimento di Fisica, Università di Genovab, I-16146 Genova, Italy
E. GuidoabAffiliation: INFN Sezione di Genovaa; Dipartimento di Fisica, Università di Genovab, I-16146 Genova, Italy
M. Lo VetereabAffiliation: INFN Sezione di Genovaa; Dipartimento di Fisica, Università di Genovab, I-16146 Genova, Italy
M. R. MongeabAffiliation: INFN Sezione di Genovaa; Dipartimento di Fisica, Università di Genovab, I-16146 Genova, Italy
S. PassaggioaAffiliation: INFN Sezione di Genovaa; Dipartimento di Fisica, Università di Genovab, I-16146 Genova, Italy
C. PatrignaniabAffiliation: INFN Sezione di Genovaa; Dipartimento di Fisica, Università di Genovab, I-16146 Genova, Italy
E. RobuttiaAffiliation: INFN Sezione di Genovaa; Dipartimento di Fisica, Università di Genovab, I-16146 Genova, Italy
B. Bhuyan
Affiliation: Indian Institute of Technology Guwahati, Guwahati, Assam, 781 039, India
V. Prasad
Affiliation: Indian Institute of Technology Guwahati, Guwahati, Assam, 781 039, India
M. Morii
Affiliation: Harvard University, Cambridge, Massachusetts 02138, USA
A. Adametz
Affiliation: Universität Heidelberg, Physikalisches Institut, Philosophenweg 12, D-69120 Heidelberg, Germany
U. Uwer
Affiliation: Universität Heidelberg, Physikalisches Institut, Philosophenweg 12, D-69120 Heidelberg, Germany
H. M. Lacker
Affiliation: Humboldt-Universität zu Berlin, Institut für Physik, Newtonstr. 15, D-12489 Berlin, Germany
P. D. Dauncey
Affiliation: Imperial College London, London, SW7 2AZ, United Kingdom
U. Mallik
Affiliation: University of Iowa, Iowa City, Iowa 52242, USA
C. Chen
Affiliation: Iowa State University, Ames, Iowa 50011-3160, USA
J. Cochran
Affiliation: Iowa State University, Ames, Iowa 50011-3160, USA
W. T. Meyer
Affiliation: Iowa State University, Ames, Iowa 50011-3160, USA
S. Prell
Affiliation: Iowa State University, Ames, Iowa 50011-3160, USA
A. E. Rubin
Affiliation: Iowa State University, Ames, Iowa 50011-3160, USA
A. V. Gritsan
Affiliation: Johns Hopkins University, Baltimore, Maryland 21218, USA
N. Arnaud
Affiliation: Laboratoire de l’Accélérateur Linéaire, IN2P3/CNRS et Université Paris-Sud 11, Centre Scientifique d’Orsay, B. P. 34, F-91898 Orsay Cedex, France
M. Davier
Affiliation: Laboratoire de l’Accélérateur Linéaire, IN2P3/CNRS et Université Paris-Sud 11, Centre Scientifique d’Orsay, B. P. 34, F-91898 Orsay Cedex, France
D. Derkach
Affiliation: Laboratoire de l’Accélérateur Linéaire, IN2P3/CNRS et Université Paris-Sud 11, Centre Scientifique d’Orsay, B. P. 34, F-91898 Orsay Cedex, France
G. Grosdidier
Affiliation: Laboratoire de l’Accélérateur Linéaire, IN2P3/CNRS et Université Paris-Sud 11, Centre Scientifique d’Orsay, B. P. 34, F-91898 Orsay Cedex, France
F. Le Diberder
Affiliation: Laboratoire de l’Accélérateur Linéaire, IN2P3/CNRS et Université Paris-Sud 11, Centre Scientifique d’Orsay, B. P. 34, F-91898 Orsay Cedex, France
A. M. Lutz
Affiliation: Laboratoire de l’Accélérateur Linéaire, IN2P3/CNRS et Université Paris-Sud 11, Centre Scientifique d’Orsay, B. P. 34, F-91898 Orsay Cedex, France
B. Malaescu
Affiliation: Laboratoire de l’Accélérateur Linéaire, IN2P3/CNRS et Université Paris-Sud 11, Centre Scientifique d’Orsay, B. P. 34, F-91898 Orsay Cedex, France
P. Roudeau
Affiliation: Laboratoire de l’Accélérateur Linéaire, IN2P3/CNRS et Université Paris-Sud 11, Centre Scientifique d’Orsay, B. P. 34, F-91898 Orsay Cedex, France
A. Stocchi
Affiliation: Laboratoire de l’Accélérateur Linéaire, IN2P3/CNRS et Université Paris-Sud 11, Centre Scientifique d’Orsay, B. P. 34, F-91898 Orsay Cedex, France
G. Wormser
Affiliation: Laboratoire de l’Accélérateur Linéaire, IN2P3/CNRS et Université Paris-Sud 11, Centre Scientifique d’Orsay, B. P. 34, F-91898 Orsay Cedex, France
D. J. Lange
Affiliation: Lawrence Livermore National Laboratory, Livermore, California 94550, USA
D. M. Wright
Affiliation: Lawrence Livermore National Laboratory, Livermore, California 94550, USA
J. P. Coleman
Affiliation: University of Liverpool, Liverpool L69 7ZE, United Kingdom
J. R. Fry
Affiliation: University of Liverpool, Liverpool L69 7ZE, United Kingdom
E. Gabathuler
Affiliation: University of Liverpool, Liverpool L69 7ZE, United Kingdom
D. E. Hutchcroft
Affiliation: University of Liverpool, Liverpool L69 7ZE, United Kingdom
D. J. Payne
Affiliation: University of Liverpool, Liverpool L69 7ZE, United Kingdom
C. Touramanis
Affiliation: University of Liverpool, Liverpool L69 7ZE, United Kingdom
A. J. Bevan
Affiliation: Queen Mary, University of London, London, E1 4NS, United Kingdom
F. Di Lodovico
Affiliation: Queen Mary, University of London, London, E1 4NS, United Kingdom
R. Sacco
Affiliation: Queen Mary, University of London, London, E1 4NS, United Kingdom
G. Cowan
Affiliation: University of London, Royal Holloway and Bedford New College, Egham, Surrey TW20 0EX, United Kingdom
J. Bougher
Affiliation: University of Louisville, Louisville, Kentucky 40292, USA
D. N. Brown
Affiliation: University of Louisville, Louisville, Kentucky 40292, USA
C. L. Davis
Affiliation: University of Louisville, Louisville, Kentucky 40292, USA
A. G. Denig
Affiliation: Johannes Gutenberg-Universität Mainz, Institut für Kernphysik, D-55099 Mainz, Germany
M. Fritsch
Affiliation: Johannes Gutenberg-Universität Mainz, Institut für Kernphysik, D-55099 Mainz, Germany
W. Gradl
Affiliation: Johannes Gutenberg-Universität Mainz, Institut für Kernphysik, D-55099 Mainz, Germany
K. Griessinger
Affiliation: Johannes Gutenberg-Universität Mainz, Institut für Kernphysik, D-55099 Mainz, Germany
A. Hafner
Affiliation: Johannes Gutenberg-Universität Mainz, Institut für Kernphysik, D-55099 Mainz, Germany
E. Prencipe
Affiliation: Johannes Gutenberg-Universität Mainz, Institut für Kernphysik, D-55099 Mainz, Germany
R. J. Barlow
Affiliation: Now at the University of Huddersfield, Huddersfield HD1 3DH, UK
G. D. Lafferty
Affiliation: University of Manchester, Manchester M13 9PL, United Kingdom
E. Behn
Affiliation: University of Maryland, College Park, Maryland 20742, USA
R. Cenci
Affiliation: University of Maryland, College Park, Maryland 20742, USA
B. Hamilton
Affiliation: University of Maryland, College Park, Maryland 20742, USA
A. Jawahery
Affiliation: University of Maryland, College Park, Maryland 20742, USA
D. A. Roberts
Affiliation: University of Maryland, College Park, Maryland 20742, USA
R. Cowan
Affiliation: Massachusetts Institute of Technology, Laboratory for Nuclear Science, Cambridge, Massachusetts 02139, USA
D. Dujmic
Affiliation: Massachusetts Institute of Technology, Laboratory for Nuclear Science, Cambridge, Massachusetts 02139, USA
G. Sciolla
Affiliation: Massachusetts Institute of Technology, Laboratory for Nuclear Science, Cambridge, Massachusetts 02139, USA
R. Cheaib
Affiliation: McGill University, Montréal, Québec, Canada H3A 2T8
P. M. Patel
Thanks: Deceased
Affiliation: McGill University, Montréal, Québec, Canada H3A 2T8
S. H. Robertson
Affiliation: McGill University, Montréal, Québec, Canada H3A 2T8
P. BiassoniabAffiliation: INFN Sezione di Milanoa; Dipartimento di Fisica, Università di Milanob, I-20133 Milano, Italy
N. NeriaAffiliation: INFN Sezione di Milanoa; Dipartimento di Fisica, Università di Milanob, I-20133 Milano, Italy
F. PalomboabAffiliation: INFN Sezione di Milanoa; Dipartimento di Fisica, Università di Milanob, I-20133 Milano, Italy
L. Cremaldi
Affiliation: Now at University of South Alabama, Mobile, Alabama 36688, USA
R. Godang
Affiliation: Now at University of South Alabama, Mobile, Alabama 36688, USA
P. Sonnek
Affiliation: University of Mississippi, University, Mississippi 38677, USA
D. J. Summers
Affiliation: University of Mississippi, University, Mississippi 38677, USA
X. Nguyen
Affiliation: Université de Montréal, Physique des Particules, Montréal, Québec, Canada H3C 3J7
M. Simard
Affiliation: Université de Montréal, Physique des Particules, Montréal, Québec, Canada H3C 3J7
P. Taras
Affiliation: Université de Montréal, Physique des Particules, Montréal, Québec, Canada H3C 3J7
G. De NardoabAffiliation: INFN Sezione di Napolia; Dipartimento di Scienze Fisiche, Università di Napoli Federico IIb, I-80126 Napoli, Italy
D. MonorchioabAffiliation: INFN Sezione di Napolia; Dipartimento di Scienze Fisiche, Università di Napoli Federico IIb, I-80126 Napoli, Italy
G. OnoratoabAffiliation: INFN Sezione di Napolia; Dipartimento di Scienze Fisiche, Università di Napoli Federico IIb, I-80126 Napoli, Italy
C. SciaccaabAffiliation: INFN Sezione di Napolia; Dipartimento di Scienze Fisiche, Università di Napoli Federico IIb, I-80126 Napoli, Italy
M. Martinelli
Affiliation: NIKHEF, National Institute for Nuclear Physics and High Energy Physics, NL-1009 DB Amsterdam, Netherlands
G. Raven
Affiliation: NIKHEF, National Institute for Nuclear Physics and High Energy Physics, NL-1009 DB Amsterdam, Netherlands
C. P. Jessop
Affiliation: University of Notre Dame, Notre Dame, Indiana 46556, USA
J. M. LoSecco
Affiliation: University of Notre Dame, Notre Dame, Indiana 46556, USA
K. Honscheid
Affiliation: Ohio State University, Columbus, Ohio 43210, USA
R. Kass
Affiliation: Ohio State University, Columbus, Ohio 43210, USA
J. Brau
Affiliation: University of Oregon, Eugene, Oregon 97403, USA
R. Frey
Affiliation: University of Oregon, Eugene, Oregon 97403, USA
N. B. Sinev
Affiliation: University of Oregon, Eugene, Oregon 97403, USA
D. Strom
Affiliation: University of Oregon, Eugene, Oregon 97403, USA
E. Torrence
Affiliation: University of Oregon, Eugene, Oregon 97403, USA
E. FeltresiabAffiliation: INFN Sezione di Padovaa; Dipartimento di Fisica, Università di Padovab, I-35131 Padova, Italy
M. MargoniabAffiliation: INFN Sezione di Padovaa; Dipartimento di Fisica, Università di Padovab, I-35131 Padova, Italy
M. MorandinaAffiliation: INFN Sezione di Padovaa; Dipartimento di Fisica, Università di Padovab, I-35131 Padova, Italy
M. PosoccoaAffiliation: INFN Sezione di Padovaa; Dipartimento di Fisica, Università di Padovab, I-35131 Padova, Italy
M. RotondoaAffiliation: INFN Sezione di Padovaa; Dipartimento di Fisica, Università di Padovab, I-35131 Padova, Italy
G. SimiaAffiliation: INFN Sezione di Padovaa; Dipartimento di Fisica, Università di Padovab, I-35131 Padova, Italy
F. SimonettoabAffiliation: INFN Sezione di Padovaa; Dipartimento di Fisica, Università di Padovab, I-35131 Padova, Italy
R. StroiliabAffiliation: INFN Sezione di Padovaa; Dipartimento di Fisica, Università di Padovab, I-35131 Padova, Italy
S. Akar
Affiliation: Laboratoire de Physique Nucléaire et de Hautes Energies, IN2P3/CNRS, Université Pierre et Marie Curie-Paris6, Université Denis Diderot-Paris7, F-75252 Paris, France
E. Ben-Haim
Affiliation: Laboratoire de Physique Nucléaire et de Hautes Energies, IN2P3/CNRS, Université Pierre et Marie Curie-Paris6, Université Denis Diderot-Paris7, F-75252 Paris, France
M. Bomben
Affiliation: Laboratoire de Physique Nucléaire et de Hautes Energies, IN2P3/CNRS, Université Pierre et Marie Curie-Paris6, Université Denis Diderot-Paris7, F-75252 Paris, France
G. R. Bonneaud
Affiliation: Laboratoire de Physique Nucléaire et de Hautes Energies, IN2P3/CNRS, Université Pierre et Marie Curie-Paris6, Université Denis Diderot-Paris7, F-75252 Paris, France
H. Briand
Affiliation: Laboratoire de Physique Nucléaire et de Hautes Energies, IN2P3/CNRS, Université Pierre et Marie Curie-Paris6, Université Denis Diderot-Paris7, F-75252 Paris, France
G. Calderini
Affiliation: Laboratoire de Physique Nucléaire et de Hautes Energies, IN2P3/CNRS, Université Pierre et Marie Curie-Paris6, Université Denis Diderot-Paris7, F-75252 Paris, France
J. Chauveau
Affiliation: Laboratoire de Physique Nucléaire et de Hautes Energies, IN2P3/CNRS, Université Pierre et Marie Curie-Paris6, Université Denis Diderot-Paris7, F-75252 Paris, France
Ph. Leruste
Affiliation: Laboratoire de Physique Nucléaire et de Hautes Energies, IN2P3/CNRS, Université Pierre et Marie Curie-Paris6, Université Denis Diderot-Paris7, F-75252 Paris, France
G. Marchiori
Affiliation: Laboratoire de Physique Nucléaire et de Hautes Energies, IN2P3/CNRS, Université Pierre et Marie Curie-Paris6, Université Denis Diderot-Paris7, F-75252 Paris, France
J. Ocariz
Affiliation: Laboratoire de Physique Nucléaire et de Hautes Energies, IN2P3/CNRS, Université Pierre et Marie Curie-Paris6, Université Denis Diderot-Paris7, F-75252 Paris, France
S. Sitt
Affiliation: Laboratoire de Physique Nucléaire et de Hautes Energies, IN2P3/CNRS, Université Pierre et Marie Curie-Paris6, Université Denis Diderot-Paris7, F-75252 Paris, France
M. BiasiniabAffiliation: INFN Sezione di Perugiaa; Dipartimento di Fisica, Università di Perugiab, I-06100 Perugia, Italy
E. ManoniaAffiliation: INFN Sezione di Perugiaa; Dipartimento di Fisica, Università di Perugiab, I-06100 Perugia, Italy
S. PacettiabAffiliation: INFN Sezione di Perugiaa; Dipartimento di Fisica, Università di Perugiab, I-06100 Perugia, Italy
A. RossiabAffiliation: INFN Sezione di Perugiaa; Dipartimento di Fisica, Università di Perugiab, I-06100 Perugia, Italy
C. AngeliniabAffiliation: Also with Università di Sassari, Sassari, Italy
G. BatignaniabAffiliation: Also with Università di Sassari, Sassari, Italy
S. BettariniabAffiliation: Also with Università di Sassari, Sassari, Italy
M. CarpinelliabAffiliation: Also with Università di Sassari, Sassari, Italy
G. CasarosaabAffiliation: INFN Sezione di Pisaa; Dipartimento di Fisica, Università di Pisab; Scuola Normale Superiore di Pisac, I-56127 Pisa, Italy
A. CervelliabAffiliation: INFN Sezione di Pisaa; Dipartimento di Fisica, Università di Pisab; Scuola Normale Superiore di Pisac, I-56127 Pisa, Italy
F. FortiabAffiliation: INFN Sezione di Pisaa; Dipartimento di Fisica, Università di Pisab; Scuola Normale Superiore di Pisac, I-56127 Pisa, Italy
M. A. GiorgiabAffiliation: INFN Sezione di Pisaa; Dipartimento di Fisica, Università di Pisab; Scuola Normale Superiore di Pisac, I-56127 Pisa, Italy
A. LusianiacAffiliation: INFN Sezione di Pisaa; Dipartimento di Fisica, Università di Pisab; Scuola Normale Superiore di Pisac, I-56127 Pisa, Italy
B. OberhofabAffiliation: INFN Sezione di Pisaa; Dipartimento di Fisica, Università di Pisab; Scuola Normale Superiore di Pisac, I-56127 Pisa, Italy
E. PaoloniabAffiliation: INFN Sezione di Pisaa; Dipartimento di Fisica, Università di Pisab; Scuola Normale Superiore di Pisac, I-56127 Pisa, Italy
A. PerezaAffiliation: INFN Sezione di Pisaa; Dipartimento di Fisica, Università di Pisab; Scuola Normale Superiore di Pisac, I-56127 Pisa, Italy
G. RizzoabAffiliation: INFN Sezione di Pisaa; Dipartimento di Fisica, Università di Pisab; Scuola Normale Superiore di Pisac, I-56127 Pisa, Italy
J. J. WalshaAffiliation: INFN Sezione di Pisaa; Dipartimento di Fisica, Università di Pisab; Scuola Normale Superiore di Pisac, I-56127 Pisa, Italy
D. Lopes Pegna
Affiliation: Princeton University, Princeton, New Jersey 08544, USA
J. Olsen
Affiliation: Princeton University, Princeton, New Jersey 08544, USA
A. J. S. Smith
Affiliation: Princeton University, Princeton, New Jersey 08544, USA
R. FacciniabAffiliation: INFN Sezione di Romaa; Dipartimento di Fisica, Università di Roma La Sapienzab, I-00185 Roma, Italy
F. FerrarottoaAffiliation: INFN Sezione di Romaa; Dipartimento di Fisica, Università di Roma La Sapienzab, I-00185 Roma, Italy
F. FerroniabAffiliation: INFN Sezione di Romaa; Dipartimento di Fisica, Università di Roma La Sapienzab, I-00185 Roma, Italy
M. GasperoabAffiliation: INFN Sezione di Romaa; Dipartimento di Fisica, Università di Roma La Sapienzab, I-00185 Roma, Italy
L. Li GioiaAffiliation: INFN Sezione di Romaa; Dipartimento di Fisica, Università di Roma La Sapienzab, I-00185 Roma, Italy
G. PireddaaAffiliation: INFN Sezione di Romaa; Dipartimento di Fisica, Università di Roma La Sapienzab, I-00185 Roma, Italy
C. Bünger
Affiliation: Universität Rostock, D-18051 Rostock, Germany
O. Grünberg
Affiliation: Universität Rostock, D-18051 Rostock, Germany
T. Hartmann
Affiliation: Universität Rostock, D-18051 Rostock, Germany
T. Leddig
Affiliation: Universität Rostock, D-18051 Rostock, Germany
C. Voß
Affiliation: Universität Rostock, D-18051 Rostock, Germany
R. Waldi
Affiliation: Universität Rostock, D-18051 Rostock, Germany
T. Adye
Affiliation: Rutherford Appleton Laboratory, Chilton, Didcot, Oxon, OX11 0QX, United Kingdom
E. O. Olaiya
Affiliation: Rutherford Appleton Laboratory, Chilton, Didcot, Oxon, OX11 0QX, United Kingdom
F. F. Wilson
Affiliation: Rutherford Appleton Laboratory, Chilton, Didcot, Oxon, OX11 0QX, United Kingdom
S. Emery
Affiliation: CEA, Irfu, SPP, Centre de Saclay, F-91191 Gif-sur-Yvette, France
G. Hamel de Monchenault
Affiliation: CEA, Irfu, SPP, Centre de Saclay, F-91191 Gif-sur-Yvette, France
G. Vasseur
Affiliation: CEA, Irfu, SPP, Centre de Saclay, F-91191 Gif-sur-Yvette, France
Ch. Yèche
Affiliation: CEA, Irfu, SPP, Centre de Saclay, F-91191 Gif-sur-Yvette, France
F. AnulliaAffiliation: SLAC National Accelerator Laboratory, Stanford, California 94309 USA
D. Aston
Affiliation: SLAC National Accelerator Laboratory, Stanford, California 94309 USA
D. J. Bard
Affiliation: SLAC National Accelerator Laboratory, Stanford, California 94309 USA
J. F. Benitez
Affiliation: SLAC National Accelerator Laboratory, Stanford, California 94309 USA
C. Cartaro
Affiliation: SLAC National Accelerator Laboratory, Stanford, California 94309 USA
M. R. Convery
Affiliation: SLAC National Accelerator Laboratory, Stanford, California 94309 USA
J. Dorfan
Affiliation: SLAC National Accelerator Laboratory, Stanford, California 94309 USA
G. P. Dubois-Felsmann
Affiliation: SLAC National Accelerator Laboratory, Stanford, California 94309 USA
W. Dunwoodie
Affiliation: SLAC National Accelerator Laboratory, Stanford, California 94309 USA
M. Ebert
Affiliation: SLAC National Accelerator Laboratory, Stanford, California 94309 USA
R. C. Field
Affiliation: SLAC National Accelerator Laboratory, Stanford, California 94309 USA
B. G. Fulsom
Affiliation: SLAC National Accelerator Laboratory, Stanford, California 94309 USA
A. M. Gabareen
Affiliation: SLAC National Accelerator Laboratory, Stanford, California 94309 USA
M. T. Graham
Affiliation: SLAC National Accelerator Laboratory, Stanford, California 94309 USA
C. Hast
Affiliation: SLAC National Accelerator Laboratory, Stanford, California 94309 USA
W. R. Innes
Affiliation: SLAC National Accelerator Laboratory, Stanford, California 94309 USA
P. Kim
Affiliation: SLAC National Accelerator Laboratory, Stanford, California 94309 USA
M. L. Kocian
Affiliation: SLAC National Accelerator Laboratory, Stanford, California 94309 USA
D. W. G. S. Leith
Affiliation: SLAC National Accelerator Laboratory, Stanford, California 94309 USA
P. Lewis
Affiliation: SLAC National Accelerator Laboratory, Stanford, California 94309 USA
D. Lindemann
Affiliation: SLAC National Accelerator Laboratory, Stanford, California 94309 USA
B. Lindquist
Affiliation: SLAC National Accelerator Laboratory, Stanford, California 94309 USA
S. Luitz
Affiliation: SLAC National Accelerator Laboratory, Stanford, California 94309 USA
V. Luth
Affiliation: SLAC National Accelerator Laboratory, Stanford, California 94309 USA
H. L. Lynch
Affiliation: SLAC National Accelerator Laboratory, Stanford, California 94309 USA
D. B. MacFarlane
Affiliation: SLAC National Accelerator Laboratory, Stanford, California 94309 USA
D. R. Muller
Affiliation: SLAC National Accelerator Laboratory, Stanford, California 94309 USA
H. Neal
Affiliation: SLAC National Accelerator Laboratory, Stanford, California 94309 USA
S. Nelson
Affiliation: SLAC National Accelerator Laboratory, Stanford, California 94309 USA
M. Perl
Affiliation: SLAC National Accelerator Laboratory, Stanford, California 94309 USA
T. Pulliam
Affiliation: SLAC National Accelerator Laboratory, Stanford, California 94309 USA
B. N. Ratcliff
Affiliation: SLAC National Accelerator Laboratory, Stanford, California 94309 USA
A. Roodman
Affiliation: SLAC National Accelerator Laboratory, Stanford, California 94309 USA
A. A. Salnikov
Affiliation: SLAC National Accelerator Laboratory, Stanford, California 94309 USA
R. H. Schindler
Affiliation: SLAC National Accelerator Laboratory, Stanford, California 94309 USA
A. Snyder
Affiliation: SLAC National Accelerator Laboratory, Stanford, California 94309 USA
D. Su
Affiliation: SLAC National Accelerator Laboratory, Stanford, California 94309 USA
M. K. Sullivan
Affiliation: SLAC National Accelerator Laboratory, Stanford, California 94309 USA
J. Va’vra
Affiliation: SLAC National Accelerator Laboratory, Stanford, California 94309 USA
A. P. Wagner
Affiliation: SLAC National Accelerator Laboratory, Stanford, California 94309 USA
W. F. Wang
Affiliation: SLAC National Accelerator Laboratory, Stanford, California 94309 USA
W. J. Wisniewski
Affiliation: SLAC National Accelerator Laboratory, Stanford, California 94309 USA
M. Wittgen
Affiliation: SLAC National Accelerator Laboratory, Stanford, California 94309 USA
D. H. Wright
Affiliation: SLAC National Accelerator Laboratory, Stanford, California 94309 USA
H. W. Wulsin
Affiliation: SLAC National Accelerator Laboratory, Stanford, California 94309 USA
V. Ziegler
Affiliation: SLAC National Accelerator Laboratory, Stanford, California 94309 USA
W. Park
Affiliation: Now at Universidad Técnica Federico Santa Maria, Valparaiso, Chile 2390123
M. V. Purohit
Affiliation: Now at Universidad Técnica Federico Santa Maria, Valparaiso, Chile 2390123
R. M. White
Affiliation: Now at Universidad Técnica Federico Santa Maria, Valparaiso, Chile 2390123
J. R. Wilson
Affiliation: University of South Carolina, Columbia, South Carolina 29208, USA
A. Randle-Conde
Affiliation: Southern Methodist University, Dallas, Texas 75275, USA
S. J. Sekula
Affiliation: Southern Methodist University, Dallas, Texas 75275, USA
M. Bellis
Affiliation: Stanford University, Stanford, California 94305-4060, USA
P. R. Burchat
Affiliation: Stanford University, Stanford, California 94305-4060, USA
T. S. Miyashita
Affiliation: Stanford University, Stanford, California 94305-4060, USA
E. M. T. Puccio
Affiliation: Stanford University, Stanford, California 94305-4060, USA
M. S. Alam
Affiliation: State University of New York, Albany, New York 12222, USA
J. A. Ernst
Affiliation: State University of New York, Albany, New York 12222, USA
R. Gorodeisky
Affiliation: Tel Aviv University, School of Physics and Astronomy, Tel Aviv, 69978, Israel
N. Guttman
Affiliation: Tel Aviv University, School of Physics and Astronomy, Tel Aviv, 69978, Israel
D. R. Peimer
Affiliation: Tel Aviv University, School of Physics and Astronomy, Tel Aviv, 69978, Israel
A. Soffer
Affiliation: Tel Aviv University, School of Physics and Astronomy, Tel Aviv, 69978, Israel
S. M. Spanier
Affiliation: University of Tennessee, Knoxville, Tennessee 37996, USA
J. L. Ritchie
Affiliation: University of Texas at Austin, Austin, Texas 78712, USA
A. M. Ruland
Affiliation: University of Texas at Austin, Austin, Texas 78712, USA
R. F. Schwitters
Affiliation: University of Texas at Austin, Austin, Texas 78712, USA
B. C. Wray
Affiliation: University of Texas at Austin, Austin, Texas 78712, USA
J. M. Izen
Affiliation: University of Texas at Dallas, Richardson, Texas 75083, USA
X. C. Lou
Affiliation: University of Texas at Dallas, Richardson, Texas 75083, USA
F. BianchiabAffiliation: INFN Sezione di Torinoa; Dipartimento di Fisica Sperimentale, Università di Torinob, I-10125 Torino, Italy
F. De MoriabAffiliation: INFN Sezione di Torinoa; Dipartimento di Fisica Sperimentale, Università di Torinob, I-10125 Torino, Italy
A. FilippiaAffiliation: INFN Sezione di Torinoa; Dipartimento di Fisica Sperimentale, Università di Torinob, I-10125 Torino, Italy
D. GambaabAffiliation: INFN Sezione di Torinoa; Dipartimento di Fisica Sperimentale, Università di Torinob, I-10125 Torino, Italy
S. ZambitoabAffiliation: INFN Sezione di Torinoa; Dipartimento di Fisica Sperimentale, Università di Torinob, I-10125 Torino, Italy
L. LanceriabAffiliation: INFN Sezione di Triestea; Dipartimento di Fisica, Università di Triesteb, I-34127 Trieste, Italy
L. VitaleabAffiliation: INFN Sezione di Triestea; Dipartimento di Fisica, Università di Triesteb, I-34127 Trieste, Italy
F. Martinez-Vidal
Affiliation: IFIC, Universitat de Valencia-CSIC, E-46071 Valencia, Spain
A. Oyanguren
Affiliation: IFIC, Universitat de Valencia-CSIC, E-46071 Valencia, Spain
P. Villanueva-Perez
Affiliation: IFIC, Universitat de Valencia-CSIC, E-46071 Valencia, Spain
H. Ahmed
Affiliation: University of Victoria, Victoria, British Columbia, Canada V8W 3P6
J. Albert
Affiliation: University of Victoria, Victoria, British Columbia, Canada V8W 3P6
Sw. Banerjee
Affiliation: University of Victoria, Victoria, British Columbia, Canada V8W 3P6
F. U. Bernlochner
Affiliation: University of Victoria, Victoria, British Columbia, Canada V8W 3P6
H. H. F. Choi
Affiliation: University of Victoria, Victoria, British Columbia, Canada V8W 3P6
G. J. King
Affiliation: University of Victoria, Victoria, British Columbia, Canada V8W 3P6
R. Kowalewski
Affiliation: University of Victoria, Victoria, British Columbia, Canada V8W 3P6
M. J. Lewczuk
Affiliation: University of Victoria, Victoria, British Columbia, Canada V8W 3P6
T. Lueck
Affiliation: University of Victoria, Victoria, British Columbia, Canada V8W 3P6
I. M. Nugent
Affiliation: University of Victoria, Victoria, British Columbia, Canada V8W 3P6
J. M. Roney
Affiliation: University of Victoria, Victoria, British Columbia, Canada V8W 3P6
R. J. Sobie
Affiliation: University of Victoria, Victoria, British Columbia, Canada V8W 3P6
N. Tasneem
Affiliation: University of Victoria, Victoria, British Columbia, Canada V8W 3P6
T. J. Gershon
Affiliation: Department of Physics, University of Warwick, Coventry CV4 7AL, United Kingdom
P. F. Harrison
Affiliation: Department of Physics, University of Warwick, Coventry CV4 7AL, United Kingdom
T. E. Latham
Affiliation: Department of Physics, University of Warwick, Coventry CV4 7AL, United Kingdom
H. R. Band
Affiliation: University of Wisconsin, Madison, Wisconsin 53706, USA
S. Dasu
Affiliation: University of Wisconsin, Madison, Wisconsin 53706, USA
Y. Pan
Affiliation: University of Wisconsin, Madison, Wisconsin 53706, USA
R. Prepost
Affiliation: University of Wisconsin, Madison, Wisconsin 53706, USA
S. L. Wu
Affiliation: University of Wisconsin, Madison, Wisconsin 53706, USA
The BABAR Collaboration
Affiliation:
March 2, 2013
Abstract
Based on the full BABAR data sample, we report improved measurements of the ratios
and ,
where refers to either an electron or muon.
These ratios are sensitive to new physics contributions in the form of a charged Higgs boson.
We measure and ,
which exceed the Standard Model expectations by and , respectively.
Taken together, the results disagree with these expectations at
the level. This excess cannot be explained by a charged Higgs boson in the
type II two-Higgs-doublet model.
Kinematic distributions presented here exclude large portions of the more general
type III two-Higgs-doublet model, but there are solutions within this model compatible
with the results.
pacs
13.20.He, 14.40.Nd, 14.80.Da
I Introduction
In the Standard Model (SM), semileptonic decays of mesons proceed via first-order
electroweak interactions and are mediated by the boson
[1, 2, 3].
Decays involving electrons and muons are expected to be insensitive to non-SM contributions
and therefore have been the bases of the determination of the Cabibbo-Kobayashi-Maskawa (CKM)
matrix elements and [4].
Decays involving the higher-mass lepton provide additional information on SM processes and
are sensitive to additional amplitudes, such as those involving an intermediate charged Higgs boson [5, 6, 7, 8, 9].
Thus, they offer an excellent opportunity to search for this and other non-SM contributions.
Over the past two decades,
the development of heavy-quark effective theory (HQET) and precise measurements of
decays [10] at the factories [11, 12]
have greatly improved our understanding of exclusive semileptonic decays.
The relative rates
(1)
are independent of the CKM element
and also, to a large extent, of the parameterization of the hadronic matrix elements.
SM expectations [9] for the ratios
and have uncertainties of less than 6% and 2%, respectively.
Calculations [5, 6, 7, 8, 9]
based on two-Higgs-doublet models predict a
substantial impact on the ratio , and a smaller effect on due to the spin of the meson.
The decay was first observed in 2007 by the Belle Collaboration [13].
Since then, both BABAR and Belle have published improved measurements,
and have found evidence for decays [14, 15, 16].
Up to now, the measured values for and have consistently exceeded the
SM expectations, though the significance of the excess is low due to the large statistical uncertainties.
We recently presented an update of the earlier measurement [14] based on the full
BABAR data sample [17]. This update included improvements to the event reconstruction
that increased the signal efficiency by more than a factor of 3. In the following, we describe
the analysis in greater detail, present the distributions of some important
kinematic variables, and expand the interpretation of the results.
We choose to reconstruct only the purely leptonic decays of the lepton,
and , so that and decays are identified by the same particles in the final
state. This leads to the cancellation of various detection efficiencies and the reduction of
related uncertainties on the ratios .
Candidate events originating from decays
are selected by fully reconstructing the hadronic decay of one of the mesons (), and
identifying the semileptonic decay of the other by a charm meson
(charged or neutral or meson),
a charged lepton (either or ) and the missing momentum and energy in the whole event.
Yields for the signal decays and the normalization decays are extracted
by an unbinned maximum-likelihood fit to the two-dimensional distributions of the invariant mass
of the undetected particles
(where , , , and refer to the four-momenta of the colliding beams, the , the , and the charged lepton, respectively)
versus the lepton three-momentum in the rest frame, .
The distribution for decays with a single missing neutrino peaks at zero, whereas signal
events, which have three missing neutrinos,
have a broad distribution that extends to about .
The observed lepton in signal events is a secondary particle from the decay, so its
spectrum is softer than for primary leptons in normalization decays.
The principal sources of background originate from decays and
from continuum events, i.e., pair production,
where . The yields and distributions of these two background sources
are derived from selected data control samples. The background decays that are most difficult
to separate from signal decays come from semileptonic decays to higher-mass, excited charm mesons,
since they can produce similar and values to signal decays and their branching fractions
and decay properties are not well known.
Thus, their impact on the signal yield is examined in detail.
The choice of the selection criteria and fit configuration are based on samples of simulated and data
events. To avoid bias in the determination of the signal yield, the signal region was blinded
for data until the analysis procedure was settled.
II Theory of Decays
II.1 Standard Model
Given that leptons are not affected by
quantum chromodynamic (QCD) interactions (see Fig. 1),
the matrix element of decays can be factorized in the form [5]
(2)
where and are the leptonic and
hadronic currents defined as
(3)
(4)
Here, the indices refer to the helicities of the , , and ,
is the four-momentum of the virtual , and is the angle between the
and the three-momenta measured in the rest frame of the virtual .
The metric factor in Eq. 2 is ,
where , 0, and refer to the four helicity states of the virtual boson ( is the
scalar state which, of course, has helicity 0).
Figure 1: Parton level diagram for decays. The gluon lines illustrate the QCD interactions that
affect the hadronic part of the amplitude.
The leptonic currents can be calculated analytically with the standard framework of electroweak interactions.
In the rest frame of the virtual (), they take the form [18]:
(5)
(6)
(7)
with
(8)
Given that the average in decays is about 8 , the fraction of leptons with positive helicity is about 30% in the SM.
Due to the nonperturbative nature of the QCD interaction at this energy scale,
the hadronic currents cannot be calculated analytically. They are
expressed in terms of form factors (FF) as functions of (see Secs. II.1.1
and II.1.2).
The differential decay rate, integrated over angles,
is derived from Eq. 2 and Eqs..5–7 [2]:
(9)
where is the three-momentum of the meson in the rest frame. For simplicity, the helicities of
the meson and the dependence of the hadron helicity amplitudes have been
omitted. The assignment is unambiguous because in decays,
only receive contributions from
, while require . In
decays, only is possible, which implies .
II.1.1 Form factor parameterization of decays
Four independent FFs, , , , and , describe the non-perturbative
QCD interactions in decays. Based on the FF convention of Ref. [9],
the hadronic currents take the following form:
(10)
In this analysis, we use an HQET-based parameterizations for the FFs that is expressed in
terms of the scalar product of the and four-velocities
(11)
Its minimum value corresponds to .
The maximum value is obtained for the lowest possible value of , which is the square of the
mass of the lepton.
Thus, for decays and for decays.
In this framework, the FFs are usually expressed in terms of a
universal form factor and ratios :
where . Using dispersion relations and analyticity constraints
[19, 9], the universal FF and the ratios can be expressed in terms
of just five parameters:
Here, .
The factor only affects the overall
normalization, so it cancels in the ratio .
Three of the remaining four FF parameters, , , and
, have been measured in analyses of decays.
The most recent averages by the Heavy Quark Averaging Group (HFAG) [4]
and their correlations are:
affects the decay rate only via the scalar hadronic amplitude . The corresponding leptonic amplitude is helicity suppressed,
i.e., its rate is proportional to the mass of the lepton (Eq. 6).
As a result, decays are not sensitive to this FF, and has not been measured.
We therefore rely on a theoretical estimate, , based on HQET [9].
II.1.2 Form factor parameterization of decays
The non-perturbative QCD interactions in decays are described by two independent
FFs, referred to as and [8].
The helicity amplitudes take the form:
(12)
(13)
The amplitudes corresponding to the helicities
vanish because the meson has spin 0. For this decay mode, the variable is defined as in
Eq. 11, except that the meson mass is replaced by the meson
mass .
Taking into account dispersion relations [19], can be expressed as
(14)
where and are FF parameters.
The normalization cancels in the ratio . Based on
decays, the average value of the shape parameter is [4].
As for decays, the scalar hadronic amplitude is helicity suppressed and as a result,
cannot be measured with decays.
We use instead the following estimate based on HQET [8]:
(15)
with .
We have employed this FF parameterization to generate and decays, as described in Sec. III.3.2. Though we used the same
FF definitions and parameters, we found a difference of 1% between the value of
that we obtained by integrating Eq. 9 and the value quoted in Ref. [8].
On the other hand, if we adopt the FF parameters of Ref. [20], we perfectly
reproduce the predictions presented there.
The translation of the FF parameterization of Ref. [20] into standard
hadronic amplitudes is not straightforward, so we do not use
these FFs in the Monte Carlo simulation. Since both parameterizations
yield essentially identical spectra, they are equivalent with respect to Monte Carlo generation,
which is not sensitive to differences in normalization.
II.1.3 SM calculation of and spectrum
We determine the SM predictions for the
ratios integrating the expression for the differential decay rate (Eq. 9) as follows:
(16)
with .
The uncertainty of this calculation is determined by generating one million random sets of
values for all the FF parameters assuming Gaussian distributions for the uncertainties and including
their correlations. We calculate with each set of values, and assign the root mean square (RMS) of
its distribution as the uncertainty. We apply this procedure for and decays, and for
and , and average the four results to arrive at the following predictions,
(17)
(18)
Additional uncertainties that have not been taken into account could contribute at
the percent level. For instance, some electromagnetic corrections could affect and decays differently [9].
The experimental uncertainty on is expected to be considerably larger.
The spectra for decays in Fig. 2 clearly show the threshold
at , while for decays .
We take advantage of this difference in the signal selection by imposing .
The spectra for and are almost identical, except for .
Figure 2: (Color online). Predicted spectra for (a) and decays
for and (b) and decays for
[4].
II.2 Two-Higgs-Doublet Model Type II
As we noted in the introduction, decays are potentially sensitive to
new physics (NP) processes.
Of particular interest is the two-Higgs-doublet model (2HDM) of type II, which describes the
Higgs sector of the Minimal Supersymmetric model at tree level.
In this model, one of the two Higgs doublets couples to up-type quarks,
while the other doublet couples to down-type quarks and leptons.
The contributions of the charged Higgs to decays can be encapsulated in the scalar helicity
amplitude in the following way [5, 20]:
(19)
Here, is the ratio of the vacuum expectation values of the two Higgs doublets,
is the
mass of the charged Higgs, and [21] is the ratio of
the - and -quark masses at a common mass scale.
The negative sign in Eq. 19 applies to decays and the positive sign
applies to decays.
This expression is accurate to 1% for larger than .
The region for has already been excluded by
measurements [22].
The dependence of the ratios in the type II 2HDM can be studied by substituting
for in Eq. 9.
Given that charged Higgs bosons are not expected to contribute significantly to decays,
can be described by a parabola
in the variable ,
(20)
Table 1 lists the values of and , which are determined
by averaging over and decays.
The uncertainty estimation includes the uncertainties on the mass ratio
and the FF parameters, as well as their correlations.
Table 1: Dependence of on in the 2HDM according to Eq. 20 for and decays: the values of , the parameters A and B with their uncertainties, and correlations .
0.297
0.017
0.252
0.003
(GeV2)
0.32
0.029
(GeV4)
16.9
2.0
0.643
0.085
Due to the destructive interference between the SM and 2HDM amplitudes in Eq. 19,
charged Higgs contributions depress the ratios for low values of .
For larger values of , the Higgs contributions dominate and and increase rapidly.
As the coefficients of Table 1 show, the 2HDM impact is expected to be
larger for than
for . This is because charged Higgs contributions only affect the scalar amplitude , but
decays also receive contributions from , diluting the effect on the total rate.
Figure 3 shows the impact of the 2HDM on the spectrum. Given that
the and mesons have spin , the SM decays proceed via -wave for
, and via -wave for . For the -wave decay, which accounts for about
96% of the total amplitude, the decay rate receives an additional factor , which suppresses the
spectrum at high values.
Since charged Higgs bosons have , their contributions proceed via -wave, and, thus,
have a larger average than the SM contributions.
As a result, for low values of where the negative interference depresses ,
the spectrum shifts to lower values.
For large values of , the Higgs contributions dominate the decay rate and
the average significantly exceeds that of the SM.
Figure 3: (Color online). Predicted distributions for (a) and (b) decays for different values
of . All curves are normalized to unit area.
The situation is different for decays because the meson has spin . The SM decays can proceed via , , or -waves, while
the decay via an intermediate Higgs boson must proceed via -wave,
suppressing the rate at high .
When searching for charged Higgs contributions, it is important to account for the
changes in the spectrum. This distribution has a significant impact on the analysis due to the
close relation between and , one of the fit variables.
Charged Higgs contributions also affect the distribution.
Given the spin 0 of the Higgs boson and the positive helicity (right-handedness) of the anti-neutrino,
the decays always produce leptons with positive helicities ().
As a result, the fraction of right-handed leptons produced in decays changes from
30% in the SM, to close to 100% when the 2HDM contributions dominate.
The lepton spectrum of polarized decays is well known [23].
For leptons with , the is emitted preferentially in the
direction, while the opposite is true for positive helicities.
In the rest frame, leptons of a certain momentum in the rest frame have larger momentum
if they are emitted in the direction of the momentum than in the opposite direction.
As a result, the spectrum for SM decays is harder than
for Higgs dominated decays.
For low values of for which the destructive interference depresses the rate,
the proportion of left-handed leptons increases, and therefore, the
spectrum is harder than in the SM.
,
III Data Sample, Detector and Simulation
III.1 Data Sample
This analysis is based on the full data sample recorded with the BABAR detector [24]
at the PEP-II energy-asymmetric storage rings [25].
It operated at a center-of-mass (c.m.) energy of 10.58 , equal to the mass of the resonance.
This resonance decays almost exclusively to pairs.
The collected data sample of 471 million events (on-peak data),
corresponds to an integrated luminosity of 426 [26].
To study continuum background,
an additional sample of (off-peak data) was recorded approximately 40 below the
resonance, i.e., below the threshold for production.
III.2 The BABAR Detector and Single Particle Reconstruction
The BABAR detector and event reconstruction have been described in
detail elsewhere [24]. The momentum and angles of charged particles
were measured in a tracking system consisting of a 5-layer, double-sided silicon-strip
detector (SVT) and a 40-layer, small-cell drift chamber (DCH) filled with a helium-isobutane
gas mixture. Charged particles of different masses were distinguished by their
ionization energy loss in the tracking devices and by a ring-imaging Cerenkov
detector (DIRC). A finely segmented CsI(Tl) calorimeter (EMC) measured the energy and position
of electromagnetic showers generated by electrons and photons. The EMC was surrounded by
a superconducting solenoid providing a 1.5-T magnetic field and by a segmented flux return with
a hexagonal barrel section and two endcaps.
The steel of the flux return was instrumented (IFR) with resistive plate chambers and limited
streamer tubes to detect particles penetrating the magnet coil and steel.
Within the polar angle acceptance of the SVT and DCH ()
the efficiency for the reconstruction of charged particles exceeds 99% for momenta above 1 .
For low momentum pions, especially from decays, the efficiency drops to
about 90% at 0.4 and to 50% at 0.1 .
The electron and muon identification efficiencies and the probabilities to misidentify a pion, a kaon,
or a proton as an electron or a muon are measured as a function of the laboratory momentum and
angles using high-purity data samples.
Electrons are separated from charged hadrons primarily on the basis of the ratio of the energy
deposited in the EMC to the track momentum. A special algorithm has been developed to identify
photons from bremsstrahlung in the inner detector, and to correct the electron momentum for the
energy loss. Within the polar angle acceptance, the average electron efficiency for laboratory
momenta above 0.5 is 97%, largely independent of momentum. The average pion
misidentification rate is less than 0.5%.
Muon identification relies on a new multivariate algorithm that significantly increases the
reconstruction efficiency at low muon momenta, .
This algorithm combines information on the
measured DCH track, the track segments in the IFR, and the energy deposited in the EMC.
The average muon efficiency is close to 90% independent of momentum, except in the forward
endcap, where it decreases for laboratory momenta below 1 . The average pion
misidentification rate is about 2%
above 1.2 , rising at lower momenta and reaching a maximum of 9% at 0.8 .
By choosing a fairly loose selection of charged leptons and taking advantage of improved PID algorithms,
we increased the lepton efficiencies by 6% for electrons and 50% for muons compared to the previous BABAR analysis [14].
Charged kaons are identified up to 4 on the basis of information from the DIRC, SVT, and DCH.
The efficiency exceeds 80% over most of the momentum range and varies with polar angle.
The probability that a pion is misidentified as a kaon is close to 2%, varying by about 1% as
a function of momentum and polar angle.
The decays are reconstructed as pairs of tracks of opposite charge originating
from a displaced vertex. The invariant mass of the pair is required to be in the range
.
No attempt is made to identify interactions of in the EMC or IFR.
To remove beam-generated background in the EMC and electronic noise, photon candidates are
required to have a minimum energy of 30 and a shower shape that is consistent with
that of an electromagnetic shower.
Neutral pions are reconstructed from pairs of photon candidates
with an invariant mass in the range .
III.3 Monte Carlo Simulation
III.3.1 Simulated Samples
This analysis relies on Monte Carlo (MC) techniques to simulate the production
and decay of continuum and events. The simulation is based on the EvtGen generator [27].
The fragmentation is performed by Jetset [28], and the detector response
by Geant4 [29]. Radiative effects such as bremsstrahlung in the detector material
and initial-state and final-state radiation [30] are included.
We derive predictions for the distributions and efficiencies of the signal and backgrounds from the simulation.
The size of the simulated sample of generic events exceeds that of the data sample by
about a factor of ten, while the sample for events corresponds to twice the size of the
off-peak data sample.
We assume that the resonance decays exclusively to pairs and use recent
measurements of branching fractions [12] for all produced particles. The
impact of their uncertainties on the final results is assessed as a systematic uncertainty.
Information extracted from studies of selected data control samples is used to improve the accuracy of
the simulation. Specifically, we reweight simulated events to account for small differences
observed in comparisons of data and simulation (Sec. V).
III.3.2 Implementation of the Form Factor Parameterizations
For reasons of simplicity, the simulation of and decays is based on the
ISGW2 model [31], and decays are generated using an HQET-based
parameterization [32].
A change to a different FF parameterization is implemented by reweighting the generated events
with the weights
(21)
Here, refers to the matrix element for the FF parameterizations
described in Secs. II.1.1 and II.1.2, and
is the matrix element employed in the MC generation. The matrix element of decays involving the
scalar meson depends on one angular variable, the lepton helicity angle
, with . In addition to , the matrix element of decays
involving the vector meson is sensitive to two additional angular variables describing the decay.
The ratio of the branching fractions ensures that the sum of
all weights equals the number of generated events.
In the SM, this reweighting results in a small shift of the distribution to higher values, while the
changes in the helicity angle and the polarization are negligible.
Therefore, the distributions of the secondary charged lepton are not affected.
In the presence of a charged Higgs boson, however, the polarization can change substantially,
affecting the momentum of the secondary lepton originating from the decays.
We account for the potential presence of a charged Higgs of 2HDM type II by reweighting
the simulation with the following weights,
(22)
where refers again to the angular variables.
The second factor represents the ratio of the distributions in the 2HDM
parameterization and in the MC simulation. This factorization is necessary because in the MC
generation the polarization is handled in a probabilistic manner, so it cannot be corrected on an
event-per-event basis. It is only applicable if
is uncorrelated with and the angular variables, which is largely the case.
In some regions of phase space, the 2HDM weights have a much larger dispersion than the weights
applied in the SM reweighting, leading to larger statistical uncertainties for the simulation of the
Higgs boson contributions.
III.3.3 Simulation of decays
By we refer to excited charm resonances heavier than the meson.
We include in the simulation the and decays that involve the four states
with that have been measured [4].
This simulation takes into account their helicities [33] and the following decay modes:
and .
Three-body decays are not included in the nominal fit
for lack of reliable measurements.
To estimate the rate of decays, we rely on ratios of the available
phase space ,
(23)
The value of this ratio depends on the mass of the state involved in the decay.
We use the largest of the four possible choices, .
Possible contributions from non-resonant decays
and semileptonic decays involving higher-mass excited charm mesons are not included in the nominal fit,
and will be treated as a systematic uncertainty.
IV Event selection
The event selection proceeds in two steps. First, we select events in which one of the mesons, the , is fully reconstructed in a hadronic decay,
while the other meson decays semileptonically.
To increase the event selection efficiency compared to earlier analyses, we have added
more decay chains to the selection and have chosen a looser charged lepton selection.
This leads to significantly higher backgrounds, primarily combinatorial background from and
continuum events, and charge-crossfeed events. Charge-crossfeed events are
decays in which the charge of the reconstructed
and mesons are wrong, primarily because of an
incorrectly assigned low-momentum .
Semileptonic decays to higher mass charm mesons have a signature similar to that of signal events and
their composition is not well measured.
This background is fitted in selected control samples that are enriched with these decays.
As the second step in the event selection, we introduce kinematic criteria that increase the fraction
of selected signal events with respect to normalization and background decays.
We also apply a multivariate algorithm to further improve the signal-to-background ratio.
IV.1 Selection of Events with a and a
Semileptonic Decay
events are tagged by the hadronic decay of
one of the mesons.
We use a semi-exclusive algorithm which includes additional decay chains and enhances
the efficiency by a factor of 2 compared to the earlier version employed by BABAR [14].
We look for decays of the type , where refers to a seed meson
and is a charged state comprising of up to five hadrons, pions or kaons, among them up
to two neutral mesons, or .
The seed mesons, , , , , and , are reconstructed in 56 decay modes.
As a result, the is reconstructed in 1,680 different decay chains, which are further subdivided into
2,968 kinematic modes.
To isolate the true tag decays from combinatorial background,
we use two kinematic variables: the energy substituted mass
and the energy difference . Here
and refer to the c.m. momentum and energy of the , and
is the c.m. energy of a single beam particle.
These variables make optimum use of the precisely known energies of the colliding beams.
For correctly reconstructed decays, the distribution is centered at the -meson
mass with a resolution of 2.5 , while is centered at zero with a resolution of
18 which is dominated by the detector resolution. We require and
.
For each candidate in a selected event, we look for the signature of the semileptonic
decay of the second meson, a or meson and a charged lepton .
We combine charged candidates with systems and neutral candidates
with both and systems, where the inclusion of both charge combinations
allows for neutral mixing.
We require all charged particles to be associated with the candidate,
but we allow for any number of additional photons in the event.
The laboratory momentum of the electron
or muon is required to exceed 300 or 200 , respectively.
For mesons, we reconstruct the following decay modes:
, , , , ,
and ,
, , , with .
The reconstructed invariant mass of candidates is required to be consistent with the
nominal mass to within four standard deviations ().
The combined reconstructed branching fractions are 35.8% and 27.3% for and , respectively.
We identify mesons by their decays ,
and . For these decays, the c.m. momentum of the pion or
the c.m. energy of the photon are required to be less than
400 . Furthermore, the mass difference is required to differ by
less than 4 from the expected value [12].
To further reduce the combinatorial background, we perform a kinematic fit to the event,
constraining tracks of secondary charged particles to the appropriate , , or decay vertices.
The fit also constrains the reconstructed masses of the , , and mesons to their nominal values.
The vertex of the decay has to be compatible with a beam-beam interaction.
Candidates for which this fit does not converge are rejected.
The resolution improves by about 25% and becomes more symmetric for the remaining candidates.
To select a single candidate, we determine ,
the sum of the energies of all photons that are not associated with the reconstructed pair.
We only include photons of more than 50 , thereby eliminating about of the
beam-generated background. We retain the candidate with the lowest value of ,
and if more than one candidate survives, we select the one with the smallest .
This procedure preferentially selects candidates over
candidates. Thus, we reduce the fraction of misreconstructed
events with a decay for which the pion or
photon is not properly assigned to the meson.
As a consequence of the rather loose lepton selection criteria and the addition of decay modes with
multiple neutral pions and for the selection, the number of
candidates per event is very large. To address this problem, we identify
the decay modes that contribute primarily to the combinatorial background.
Specifically, we determine for each of the 2,968 kinematic modes ,
the fraction of events for which all charged particles in the final state are correctly reconstructed
and associated with the tag decay.
This assessment is based on a large sample of simulated events equivalent to 700 .
We observe that for decay chains with low multiplicity final states and no neutral hadrons the
signal-to-background ratio () is very high.
For instance, for the decay, we obtain
, whereas for the decay
this
ratio is . For this decay mode, typically 3.5 of the 8 final state particles
are incorrectly associated with the second decay in the event or otherwise misidentified.
Based on this study, we only retain decay chains with . With this criterion,
we remove 2100 kinematic modes, eliminate 2/3 of the combinatorial background,
and retain 85% of the signal decays.
Thanks to this procedure, the average number of candidates per event before single candidate selection
is reduced to 1.8 for the and samples, and 3.1 and 4.8 for the and samples, respectively.
IV.2 Selection of the Control Samples
To constrain the background, we select four control samples, identical to the samples
except for an additional reconstructed . The is selected in the mass range
.
Decays of the form peak at in these samples.
As a result, we can extract their yields together with the signal and normalization yields by
fitting the and samples simultaneously.
More than half of the events in these control samples originate from continuum
events. Since the fragmentation of light quarks leads to a
two-jet event topology, this background is very effectively suppressed by the requirement
, where is the angle between the
thrust axes of the and of the rest of the event.
Since mesons originating from decays are produced just above threshold,
their final state particles are emitted almost isotropically, and, therefore, the
distribution is uniform. As a result, the loss of decays
due to this restriction is significantly smaller than the amount of continuum events rejected.
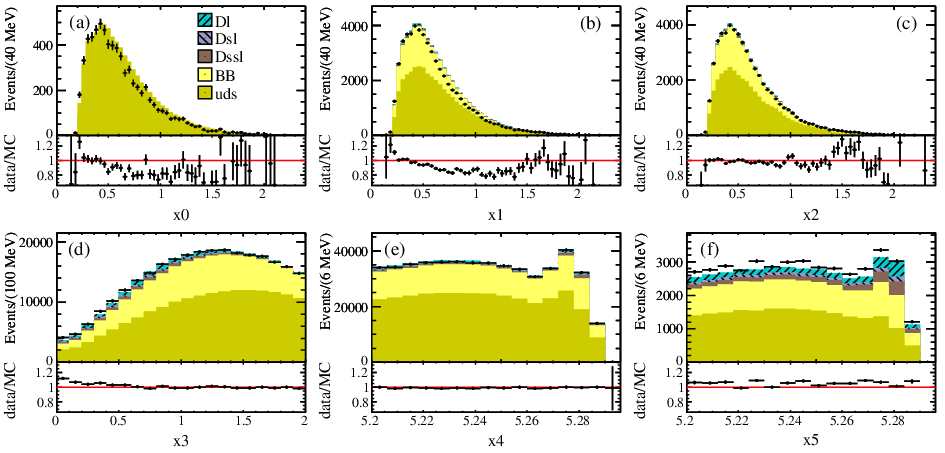
Figure 4: (Color online). Input variables for the BDT selector trained on the sample.
Histograms are normalized to 1000 entries.
IV.3 Optimization of the Signal Selection
We introduce criteria that discriminate signal from background, and also differentiate between
signal and decays.
For semileptonic decays the minimum momentum transfer is largely determined by the mass
of the charged lepton. For decays involving leptons,
. Thus the
selection retains 98% of the decays and rejects more that 30%
of the decays. The event sample with
is dominated by and serves as a very clean data sample for
comparisons with the MC simulation.
To reject background from hadronic decays in which a pion is misidentified as muon,
we require , where
is the missing momentum in the c.m. frame.
Figure 5: (Color online). Comparison of data control samples (data points) with MC simulated
samples (histograms) of
the distributions for
(a) off-peak data prior to reweighting,
(b) the intermediate sample prior to reweighting, and
(c) the intermediate sample after reweighting;
(d) the distribution for the combinatorial background;
and the distributions for
(e) the intermediate sample, and
(f) the low sample.
The results are shown for the four samples combined.
To further improve the separation of well-reconstructed signal and normalization
decays from various backgrounds, we employ a boosted
decision tree (BDT) multivariate method [34].
This method relies on simple classifiers which determine signal and background regions
by using binary selections on various input distributions.
For each of the four samples, we train a BDT to select
signal and normalization events and reject and charge cross-feed backgrounds.
Each BDT selector relies on the simulated distributions of the following variables:
(a) ;
(b) ;
(c) the reconstructed mass of the signal meson;
(d) the mass difference for the reconstructed signal : ;
(e) the reconstructed mass of the seed meson of the ;
(f) the mass difference for a originating from the , ;
(g) the charged particle multiplicity of the candidate; and
(h) .
The input distributions for one of the BDT selectors are shown in Fig. 4.
For the samples, we use similar BDT selectors that are trained to reject continuum,
, and other background.
After the BDT requirements are applied, the fraction of events attributed to signal in the
region, which excludes most of the
normalization decays, increases from 2% to 39%.
The background remaining in that region is composed of normalization events (10%),
continuum (19%), events (13%), and other
events (19%), primarily from decays with .
V Correction and Validation of the MC Simulation
The simulation of the full reconstruction of high-multiplicity events, including
the veto of events with extra tracks or higher values of is a rather challenging task.
To validate the simulation, we compare simulated distributions with data control samples,
and, when necessary, correct the MC simulations for the observed differences.
The figures shown in this section combine events from all four channels (, , , and );
the observed differences are similar in the individual samples.
The control samples are selected to have little or no contamination from signal decays.
Specifically we select,
•
Continuum events: off-peak data.
•
Normalization decays: .
•
Combinatorial and continuum backgrounds: .
•
Incorrectly reconstructed events: events in
three intervals, high (), intermediate
(), and low ( for events that fail the
BDT selection).
N.B. the BDT selection results in the elimination of all events with .
The off-peak data sample confirms the distribution of simulated continuum events, but
shows discrepancies in the spectrum and overall normalization of the simulation
[Fig. 5(a)]. These features are also observed in other control samples,
such as on-peak data with high [Fig. 5(b)].
We correct the simulated spectrum and yield of the continuum contribution by reweighting it to match
off-peak data, on an event-by-event basis.
After this correction, the distributions of the expected backgrounds agree well
in independent control samples down to low lepton momenta where the misidentification
rates are significant [Fig. 5(c)].
We observe that in the high region, the simulation exceeds data yield by %.
This small excess is corrected by decreasing the expected background yield by .
After this correction, the simulation provides accurate yield predictions for the backgrounds
at intermediate and high . For instance, the ratio of the expected to observed yield
of events with is .
The distributions of the continuum and backgrounds are described well in all control samples.
The region of low , which includes the signal region, is more difficult to model,
primarily due to low energy photons and mesons interacting in the EMC.
Figure 5(d) shows that the data in the sideband agree well
with the combinatorial background predictions for ,
but are underestimated for low .
This, and small differences in the other BDT input distributions,
result in a underestimation of the combinatorial background when the BDT requirements are applied.
Based on the sideband, we find scale factors of
and for the combinatorial background in the and
samples, respectively. The uncertainties are given by the statistics of the data
and simulated samples.
The ratio between the observed and expected distribution is independent of [Figs. 5(e,f)], so we apply these corrections to the continuum and
backgrounds in the signal region.
The same correction is applied to events, which cannot be easily isolated, because
their simulated distributions are very similar to those of combinatorial background.
These corrections affect the fixed and continuum yields in the fit, as well as the relative
efficiency of events in the and samples. As a result, these corrections are the
source of the dominant systematic uncertainties.
Relying on the control sample, where decays account for 96% of the events,
we correct the distribution and an 8.5% overestimation of the simulated
normalization events.
We apply the same correction to simulated signal events
which are expected to have a similar distribution.
This procedure does not affect the relative efficiency of signal to normalization events,
so it has a very small impact on the measurements.
We use the same control sample to compare and validate the distributions
of events. We observe that the resolution of the narrow peaks at
is slightly underestimated by the simulation.
This effect is corrected by convolving the simulated distributions with a Gaussian
resolution function, for which the width is adjusted by iteration.
Table 2: Contributions to the four samples. The expected relative abundance of events
in each data sample is represented by . The columns labeled Yield
indicate whether the contribution is free in the fit, fixed, or linked to another component
through a cross-feed
constraint. The charged cross-feed components, marked with Fix./It., are fixed in the
fit, but updated in the iterative process.
Source
(%)
Yield
(%)
Yield
(%)
Yield
(%)
Yield
signal
2.6
Free
4.9
Free
4.3
Free
5.0
Free
signal feed-down/up
2.8
0.4
1.8
0.1
normalization
24.5
Free
80.7
Free
37.3
Free
88.0
Free
norm. feed-down/up
53.5
Free
2.7
35.0
Free
0.3
background
4.3
3.6
6.6
3.0
Cross-feed background
3.8
Fix./It.
1.3
Fix./It.
2.1
Fix./It.
0.4
Fix./It.
background
4.1
Fixed
3.7
Fixed
7.1
Fixed
2.8
Fixed
Continuum background
4.4
Fixed
2.6
Fixed
5.9
Fixed
0.5
Fixed
Table 3: Contributions to the four samples. The expected relative abundance of events
in each data sample is represented by . The columns labeled Yield
indicate whether the contribution is free in the fit, fixed, or linked to another component
through a cross-feed constraint. The components are linked to the
components, and the cross-feed constraint is updated in the iteration.
The charged cross-feed components, marked with Fix./It., are fixed in the
fit, but updated in the iterative process.
Source
(%)
Yield
(%)
Yield
(%)
Yield
(%)
Yield
background
20.1
Free
16.4
Free
19.9
Free
22.1
Free
feed-up
19.1
Free
20.6
Free
10.0
Free
25.2
Free
feed-up
6.4
2.3
4.7
0.8
Cross-feed background
4.9
Fix./It.
3.6
Fix./It.
4.4
Fix./It.
2.5
Fix./It.
background
28.4
Free
36.4
Free
38.7
Free
37.4
Free
Continuum background
21.0
Fixed
20.8
Fixed
22.2
Fixed
12.0
Fixed
VI Fit procedure and results
VI.1 Overview
We extract the signal and normalization yields from an extended, unbinned maximum-likelihood fit
to two-dimensional – distributions.
The fit is performed simultaneously to the four samples and the four samples.
The distribution of each and sample is fit to the sum of eight or six
contributions, respectively. Each of the contributions is described by
a probability density function (PDF). Their relative scale factor determines the number
of events from each source.
Tables 2 and 3 summarize
the contributions to the fit for the four sample and the four samples.
These tables also list the relative yield for each contribution
as estimated from MC simulation (for SM signal), and specify whether the yield is free, fixed, or constrained
in the fit.
We introduce the following notation to uniquely identify each contribution to the fit:
sourcesample. For instance,
refers to signal decays that are correctly reconstructed in the sample,
while
refers to the same decays, but incorrectly reconstructed in the sample.
We refer to the latter as feed-down.
Contributions of the form and
are referred to as feed-up.
The contributions from the continuum, , and cross-feed backgrounds, with the
exception of background in the samples, are fixed to the
yields determined by MC simulation after small adjustments based on data control regions.
The yields of the remaining 36 contributions are determined in the fit.
Some of these contributions share the same source and therefore the
ratio of their yields is constrained to the expected value,
e.g.,
and .
Of special importance are the constraints linking the yields in the samples
() to the yields in the
samples (),
(24)
Given that these constraints share the same source, is equivalent
to the ratio of the reconstruction efficiencies for the two samples.
Table 4: Number of free parameters in the isospin-unconstrained () and
constrained () fits.
Sample
Contribution
signal
4
2
normalization
4
2
norm. feed-down
2
1
background
4
4
norm. feed-up
4
4
background
4
4
Taking into account the constraints imposed on event yields from a common source,
there are 22 free parameters in the standard fit, as listed in Table 4.
In addition, we perform a fit in which we
impose the isospin relations
and .
We choose not to impose isospin relations for the samples.
Consequently, this fit has a total of 17 free parameters.
The following inputs are updated by iterating the fit:
•
The eight PDFs are recalculated taking into account
the fitted and contributions to the samples.
•
The fixed charge cross-feed yields are updated
based on the deviation of the fitted yields from the expected values.
•
The continuum, , and background corrections are recalculated.
They have a slight dependence on the fitted events because some of these events
extend into the sideband.
•
The correction to the resolution of the normalization contributions is readjusted.
•
The two feed-down constraints for are updated using the fitted
feed-down constraints for the normalization contributions in the following way:
(25)
The iterations continue until the change on the values of is less than 0.01%.
The update of the feed-down rates has a significant impact on the fits to the and samples because of the large signal feed-down.
The other iterative updates have only a marginal impact.
VI.2 Probability Density Functions and Validation
The fit relies on 56 PDFs, which are derived
from MC samples of continuum and events equivalent to 2 and 9 times the size of the
data sample, respectively. The two-dimensional – distributions for each of the 56 contributions to the fit are described by smooth
non-parametric kernel estimators [35].
These estimators enter a two-dimensional Gaussian function centered at the and
values of each simulated event. The width of the Gaussian function determines
the smoothness of the PDF. We find the optimum level of global smoothing with a
cross-validation algorithm [36]. For PDFs that have variations in shape that require more
than one level of smoothing, we combine estimators with different Gaussian widths in up to
four areas in the – space. For instance,
we use different levels of smoothing in the contribution
for the narrow peak at and the smooth tail that extends up to .
Figure 6 shows one-dimensional projections of five two-dimensional PDFs.
The bands indicate the statistical uncertainty on the PDFs estimated with a bootstrap
algorithm [36].
The distributions of signal and normalization are very distinct due to the
different number of neutrinos in the final state. The distributions of the backgrounds
resemble those of the signal, and therefore these contributions to the fit are either fixed or
constrained by the samples.
Figure 6: (Color online) Projections of the simulated and distributions and the PDFs
for the following contributions to the sample:
(a), (b) ; (c), (d) ; (e), (f) ; (g), (h) , and (i), (j) background.
The light and dark blue (gray) bands mark the and envelopes of the
variations of the PDF projections due to their statistical uncertainty.
To validate the PDFs and the fit procedure, we divide the large sample of simulated events
into two: sample A with about events, and sample B with
events.
We determine the PDFs with sample A, and create histograms by integrating the PDFs in bins of
their and projections. We compare the resulting histograms with the events in sample A,
and derive a based on the statistical significance of the difference for each bin. The distribution
of the corresponding values for these PDFs is uniform, as expected for an unbiased estimation.
As another test, we extract the signal and normalization yields
from fits to the events of sample B, using the PDFs obtained from sample A.
Again, the results are compatible with an unbiased fit.
Furthermore, we validate the fit procedure based on a large number of pseudo experiments
generated from these PDFs.
Fits to these samples also show no bias in the extracted signal and normalization yields.
VI.3 Fit Results
Figures 7 and 8 show the and projections of the
fits to the samples.
In Fig. 7, the projections do not include events with , i.e.,
most of the signal events. In Fig. 8, the vertical scale is enlarged and the horizontal
axis is extended for the projection to reveal the signal and background contributions.
The projections emphasize the signal events by excluding events with .
Both figures demonstrate that
the fit describes the data well and the observed differences are consistent with the statistical
and systematic uncertainties on the PDFs and the background contributions.
Figure 7: (Color online). Comparison of the and distributions of the samples (data points)
with the projections of the results of the isospin-unconstrained fit (stacked colored distributions).
The distributions show the normalization-enriched region with ,
thus excluding most of the signal events in these samples.
Figure 8: (Color online). Comparison of the and distributions of the samples (data points)
with the projections of the results of the isospin-unconstrained fit (stacked colored distributions).
The region above the dashed line of the background component corresponds to background
and the region below corresponds to continuum. The peak at in the
background component is due to charge cross-feed events.
The distributions show the signal-enriched region with ,
thus excluding most of the normalization events in these samples.
Figure 9 shows the and projections of the fit
to the four samples.
The narrow peak is described well by the fit. It tightly constrains contributions from
decays, including the nonresonant states as well as decays of
states, narrow or wide.
There appears to be a small excess of events in the data for .
This might be an indication for an underestimation of the background.
The impact of this effect is assessed as a systematic uncertainty.
Figure 9: (Color online). Comparison of the and distributions of the samples
(data points) with the projections of the results of the isospin-unconstrained fit (stacked colored distributions).
The region above the dashed line of the background component corresponds to background
and the region below corresponds to continuum.
The fit determines, for each signal decay mode, the number of signal events in the data sample,
, and the corresponding number of normalization events, .
We derive the ratios
of branching fractions as
(26)
where is the ratio of
efficiencies (including the branching fractions) taken from MC simulation.
These relative efficiencies are larger for than for , because
the requirement rejects a larger fraction of decays than of
decays, while keeping almost 100% of decays..
The results of the fits in terms of the number of events, the efficiency ratios,
and are listed in Table 8, for both the standard and the
isospin-constrained fits.
Due to the large signal feed-down, there are significant negative correlations between
the fits to the and samples.
The statistical correlations are for and ,
for and , and for and .
VII Systematic uncertainties
Table 5 lists the systematic uncertainties considered in this analysis, as well
as their correlations in the measurements of and .
We distinguish two kinds of uncertainties that affect the measurement of :
additive uncertainties which impact the signal and background yields
and thereby the significance of the results, and multiplicative uncertainties that affect
the ratios and, thus, do not change the significance.
The limited size of the simulated signal and background samples impact both
additive and multiplicative uncertainties.
Table 5: Systematic uncertainties and correlations on for the isospin-unconstrained (columns 1–4 and 7–8) and isospin-constrained (columns 5–6 and 9) fits. The total uncertainties and correlations are calculated based on
Eq. 27.
Fractional uncertainty (%)
Correlation
Source of uncertainty
Additive uncertainties
PDFs
MC statistics
6.5
2.9
5.7
2.7
4.4
2.0
FFs
0.3
0.2
0.2
0.1
0.2
0.2
0.7
0.5
0.7
0.5
0.7
0.5
0.22
0.40
0.53
1.0
0.4
1.0
0.4
0.8
0.3
1.2
2.0
2.1
1.6
1.8
1.7
1.00
1.00
1.00
2.1
2.6
2.1
2.6
2.1
2.6
0.22
0.40
0.53
Cross-feed constraints
MC statistics
2.6
0.9
2.1
0.9
2.4
1.5
0.02
6.2
2.6
5.3
1.8
5.0
2.0
0.22
0.40
0.53
Feed-up/feed-down
1.9
0.5
1.6
0.2
1.3
0.4
0.29
0.51
0.47
Isospin constraints
–
–
–
–
1.2
0.3
–
–
Fixed backgrounds
MC statistics
4.3
2.3
4.3
1.8
3.1
1.5
Efficiency corrections
4.8
3.0
4.5
2.3
3.9
2.3
0.20
Multiplicative uncertainties
MC statistics
2.3
1.4
3.0
2.2
1.8
1.2
0.00
0.00
0.00
FFs
1.6
0.4
1.6
0.3
1.6
0.4
0.00
0.00
0.00
Lepton PID
0.6
0.6
0.6
0.5
0.6
0.6
1.00
1.00
1.00
/ from
0.1
0.1
0.0
0.0
0.1
0.1
1.00
1.00
1.00
Detection/Reconstruction
0.7
0.7
0.7
0.7
0.7
0.7
1.00
1.00
1.00
0.2
0.2
0.2
0.2
0.2
0.2
1.00
1.00
1.00
Total syst. uncertainty
12.2
6.7
11.4
6.0
9.6
5.5
0.10
0.05
Total stat. uncertainty
19.2
9.8
18.0
11.0
13.1
7.1
Total uncertainty
22.7
11.9
21.3
12.5
16.2
9.0
VII.1 Additive uncertainties:
Additive uncertainties affect the results of the fit. To asses their impact,
we vary the source of uncertainty 1000 times following a given distribution,
and repeat the fit for each variation. We adopt as the uncertainty the
standard deviation of the distribution of the resulting values.
From this ensemble of fits, we also estimate the
correlation between the uncertainties of and .
VII.1.1 PDF Estimation
MC statistics:
We employ a bootstrap algorithm [36] to estimate the uncertainty
due to the limited size of the simulated event samples
on which we base the 56 PDFs.
We generate 1000 samples of simulated events by sampling the original MC sample with
replacement [37]. The PDFs are recalculated with each bootstrapped sample, and the fit
is repeated for each set of PDFs.
Figure 6 shows the and bands for the projections
of five selected PDFs. The impact on the final result is 4.4% for and 2.0% for .
Form factors for :
We estimate the impact on the signal and normalization PDFs due to the
uncertainties on the FF parameters,
, , , , , and ,
taking into account their uncertainties and correlations.
We recalculate the and PDFs with each set of 1000
Gaussian variations of the parameter values, and repeat the fit with each
set of PDFs to determine the impact on .
fraction:
The simulation of decays only includes
the two-body decays of the four charm meson states.
The ratio of decays to decays which is fixed by isospin relations
has a significant impact on the PDFs, because decays result in a sharply peaked distribution for the samples. The measured uncertainty on the detection efficiency is 3%.
We assume a 4% uncertainty to the probability that a low momentum charged pion from
decays is misassigned to the decay.
Combining these two uncertainties, we arrive at an uncertainty on the relative
proportion of the two-body decays of of 5%. We repeat the fit increasing and decreasing
this ratio by 5%, and adopt the largest variation of the isospin-constrained fit results as the systematic uncertainty.
branching fractions:
Since decays to the four states are combined in the samples, the PDFs depend on the
relative branching fractions for the four states [4].
The impact of the branching fraction uncertainties is assessed
by recalculating the PDFs and adopting the variation of the fit results
from the ensemble of PDFs as the uncertainty.
branching fractions:
As noted above,
the sharp peak in the distribution of the samples
constrains contributions from decays. Events with additional
unreconstructed particles contribute to the tail of the distribution and,
thus, are more difficult to separate from other backgrounds and signal events.
This is the case for decays, which are combined with
decays in the PDFs with the relative proportion .
This value has been derived from the ratio of the available phase space.
The same estimate applied to decays results in
and ,
values that are 58% and 32% smaller than the measured values.
Taking this comparison as guidance for the error on , we increase
by 50%, recalculate the PDFs, and repeat the fit. As a result,
the values of and decrease by 1.8% and 1.7%, respectively.
The impact is relatively small, because contributions are
small with respect to signal decays, which have much higher reconstruction
efficiencies.
Unmeasured decays:
To assess the impact of other potential contributions,
we modify the standard fit by adding an additional component. Out of the four
contributions listed in Table 6,
the three-body decays of the states with give the best
agreement in the fits to the samples. For this decay chain,
the distribution has a long tail due to an additional undetected pion.
This could account for some of the observed excess at
in Fig. 9.
We assign the observed change in as a systematic uncertainty.
Table 6: Additional decays and the MC model implemented for their decays.
The fourth decay mode refers to three-body decay of the four states.
Constraints on the efficiency ratios that link contributions from the same source
are taken from MC simulation.
The impact of their statistical uncertainty is assessed by varying
the simulated event yields assuming Poisson errors.
The ratios :
We assess the uncertainty on , the constraints linking the yields in the and samples, by estimating the relative efficiencies of the selection criteria that differ in
the two samples.
The main differences in the selection of these samples are due to differences in
the and BDTs.
In the samples, we observed that differences between data and simulation cause a
5%-10% underestimation of the continuum and backgrounds after the BDT requirements
are applied.
Since the contributions have similar distributions, and these distributions are
the key inputs to the BDTs, we applied the same 5%-10% corrections to these contributions.
We conservatively assign 100% of
this correction as the systematic uncertainty on the efficiency in the samples.
Since decays are difficult to isolate in samples other than the control samples,
we estimate the uncertainty on the efficiency due to the BDT selection by relying
on the observed data-MC difference of the BDT selection efficiency for the sample.
We assign the full 8.5% overestimate of the contribution as the
systematic uncertainty on the efficiency in the samples.
The constraints also depend on the relative branching fractions of the four decays that
are combined in the contributions. We estimate their impact on from
the branching fraction variations observed in the evaluation of the PDF uncertainty.
The largest standard deviation for the four distributions is 1.8%.
By adding the uncertainties on described above in quadrature, we obtain total uncertainties of
13.2% for the samples, and 10.0% for the samples.
Given that there are similarities between the BDT selections applied to the and samples,
we adopt a 50% correlation between their uncertainties.
With these uncertainties and correlations, we derive the total impact on the results,
5.0% for and 2.0% for .
Feed-down constraints:
The feed-down constraints of the signal yields are corrected as part of the iteration of the fit.
The uncertainties on these corrections are given by the statistical uncertainty on the ratios of the fitted
and yields.
They are 2.4% and 4.4% on the and
feed-down constraints, respectively.
Feed-up constraints:
We estimate the uncertainty on the and feed-up
constraints as 100% of the corrections on the feed-down constraints. This results in 6.8% on the
feed-up and 9.9% on the feed-up. These two effects combined
lead to an uncertainty of 1.3% on and 0.4% on .
Isospin constraints:
In the isospin-constrained fit, we employ five additional constraints to link the signal and normalization
yields of the samples corresponding to and decays.
Since we reweight these contributions with the
control sample, the uncertainty on the isospin constraints is given by the statistical uncertainty on
the ratios of the yields. This uncertainty is 3.4% in the samples and
3.6% in the samples. This translates into uncertainties of 1.2% on and 0.3% on .
VII.1.3 Fixed Background Contributions
MC statistics:
The yields of the continuum, , and cross-feed backgrounds are fixed in the fit.
The uncertainty due to the limited size of the MC samples is estimated
generating Poisson variations of these yields, and repeating the fit with each set of values.
A significant part of this uncertainty is due to the continuum yields,
since the size of simulated continuum sample is equivalent to only twice the data sample,
Efficiency corrections:
To account for the correlations among the various corrections applied to the continuum
and backgrounds, we follow this multi-step procedure:
•
We vary the continuum corrections within their statistical uncertainties of 3%–9% ,
given by the number of events in the off-peak data control samples.
•
The branching fractions of the most abundant decays in the background are varied within
their uncertainties [12].
•
The correction is reestimated in the high control sample, and varied
within the statistical uncertainty of 1.9%.
•
The BDT bias corrections are reestimated in the sideband, and
varied within their statistical uncertainties, 2.1% in the samples
and 3.6% in the samples.
•
The background PDFs are recalculated.
•
The fit is repeated for each set of PDF and yield variations.
Table 7 shows the size of the continuum and backgrounds and their uncertainties
due to the limited size of the MC samples and the various corrections implemented by comparisons with
control samples.
Table 7: Continuum and other background yields; the first uncertainty is
due to MC statistics, the second to efficiency corrections, and refers to the
total uncertainty.
Sample
Continuum
(%)
(%)
355
13
12
4.9
330
6
17
5.3
132
8
6
7.6
188
4
10
5.9
157
9
6
6.9
191
5
9
5.5
12
3
1
23.6
72
3
4
6.9
VII.2 Multiplicative Uncertainties
MC statistics:
The relative efficiency is estimated as the ratio of expected
yields, so the limited size of the MC samples contributes to its uncertainty. We estimate it assuming
Poisson errors on the MC yields.
Form factors for :
The requirement introduces some dependence on the FF parameterization. This uncertainty
is assessed based on the effect of the FF variations calculated for the uncertainty on the PDFs.
/ from :
There is a significant momentum-dependent uncertainty on the reconstruction
efficiency of soft pions originating from decays. However, the
momentum spectra of soft pions in signal and normalization decays are rather
similar, see Fig. 10. As a result,
the uncertainty on is less than 0.1%.
Detection and Reconstruction:
Given that signal and normalization decays are reconstructed by the same particles in
the final state, many of the uncertainties that impact their efficiencies cancel in
the ratios .
Uncertainties due to final-state radiation,
soft-pion reconstruction, and others related to the detector performance
contribute less than 1%.
Similarly, the tagging efficiency for events with signal and normalization decays show
only very small differences.
Figure 10: (Color online). Pion momentum in the laboratory from and decays:
(a) , and (b) decays.
Histograms are normalized to 1000 entries.
VII.3 Correlations
Even though several of the uncertainties listed in Table 5 have the same source,
their impact on is largely uncorrelated, i.e., the correlation between uncertainties in different
rows of Table 5 is negligible.
However, the correlation between the uncertainties on and (different columns) is significant, and
important for the comparison of these measurements with theoretical predictions.
For most of the additive systematic uncertainties, we estimate the correlation from the
two-dimensional – distribution resulting from the fit variations.
This is not possible for the and uncertainties.
These uncertainties affect the size of the background in the
samples in the same way that as does. Thus, we derive their correlations from
the correlations.
Since the signal and PDFs are very similar, we assign a 100% correlation
on .
The multiplicative uncertainties on the efficiency due to the MC statistics are
uncorrelated. The FFs for and decays are measured separately, so their uncertainties
are also not correlated. The uncertainty on affects
all channels equally.
We assume that the remaining small uncertainties
on the efficiencies due to detector effects are 100% correlated as well.
The uncertainties and their correlations are listed in Table 5.
We combine these correlations and the uncertainties by adding their covariance matrices,
(27)
Here, and refer to the uncertainties on and , respectively.
VIII Stability checks and Kinematic Distributions
VIII.1 Stability tests
We have checked the stability of the fit results for different data subsamples and different
levels of background suppression.
To look for possible dependence of the results
on the data taking periods, we divide the data sample into four periods
corresponding to approximately equal luminosity, and fit each sample separately.
The results are presented in Fig. 11.
The eight measurements each for and , separately for and , are compared
to the isospin-constrained fit results obtained from the complete data sample.
Based on the values of for 7 degrees of freedom, we conclude that
the results of these fits are statistically consistent with the fit to the whole data sample.
A similar test is performed for two samples identified by the final state lepton,
an electron or a muon.
This test includes the uncertainties on the background corrections that affect
the electron and muon samples differently. These uncertainties are statistically dominated and, thus,
independent for both samples.
The results are presented in the bottom panels of Fig. 11. The tests
confirm the stability of these measurements within the uncertainties.
Figure 11: (Color online). Measurements of and for
different data subsamples. Top: for four run periods with statistical uncertainties only.
Bottom: for electrons and muons with statistical and uncorrelated systematic uncertainties.
The vertical bands labeled “SM” and “All data” mark the SM predictions and the results of
the fits to the whole data sample, respectively.
To assess the sensitivity of the fit results on the purity of the data sample
and the BDT selection,
we perform fits for samples selected with different BDT requirements.
We identify each sample by the relative number of events in the signal region
() with respect to the nominal sample, which is labeled as the 100% sample.
The ratio of the number of fitted signal events to the number of background events varies from
in the 30% sample, to in the 300% sample, while the backgrounds
increase by a factor of 18.
The BDT bias correction and the PDFs are recalculated for each sample.
Figure 12 shows the results of fits to the different samples
with tighter and looser BDT requirements.
We take into account the large correlations between these nested samples
and conclude that the results are stable for the very large variations
of the BDT requirements.
Figure 12: (Color online). Measurements of and for different BDT requirements, impacting the
signal/background ratio.
The horizontal bands mark the and results for the isospin-constrained
fit to the nominal (100%) sample.
The data points represent the results of the fits for and mesons with their statistical uncertainties.
VIII.2 Gaussian Uncertainties
For a maximum likelihood fit with Gaussian uncertainties, the logarithm of the likelihood is
described by the parabola ,
where is the fitted yield and is the uncertainty on .
Figure 13 compares the likelihood scan of the signal yields for the isospin-constrained
fit with the parabola that results from the fitted yields, presented in Table 8.
There is a slight asymmetry in the likelihood function, but good agreement overall.
Thus, we conclude that the statistical uncertainty on and may be considered Gaussian.
Figure 13: (Color online). Likelihood scan for the two signal yields compared to a parabola.
The dashed lines indicate the number of standard deviations () away from the fit result.
Figure 14 shows the effect on
and from variations on , the largest source of systematic uncertainty.
The distributions are well described by a Gaussian function.
This is also the case for the other major sources of systematic uncertainty.
Figure 14: (Color online). Histograms: distributions resulting from 1000 variations of .
Solid curves: Gaussian fits to the distributions.
VIII.3 Kinematic Distributions
We further study the results of the fit by comparing the kinematic distributions of data events with
the SM expectations.
Specifically, we focus on the signal-enriched region with
and scale each component in the simulation by the results of the fits.
To compare the data and MC distributions we calculate a per degree of freedom
which only includes the statistical uncertainty of bins with 8 or more events.
The number of degrees of freedom is given by the number of bins minus the number of fitted signal yields.
Figure 15: (Color online). distributions for events with scaled to the results of the
isospin-unconstrained (first two columns) and isospin-contrained (last column) fits.
The region above the dashed line of the background component corresponds to background
and the region below corresponds to continuum. In the third column, the and samples are combined,
and the normalization and background events are subtracted. Figure 16: (Color online). distributions before (left) and after (center) subtraction of normalization of background events,
and lepton momentum distributions after this subtraction (right) for events with
scaled to the results of the isospin-constrained fit.
The and samples are combined. See Fig. 15 for a legend.
Figure 15 shows the distribution of events in the samples.
This variable is key in the BDT selection and overall background suppression.
There is a clear enhancement of signal events at in all four samples. The
background contributions, which are significantly more uniform in
than those of signal, appear to be well reproduced.
We conclude that the simulation agrees well with the data distribution.
Figure 16 also shows clear signal enhancements in the
and distributions of events in the region.
The data and simulation agree well within the limited statistics.
IX Results
IX.1 Comparison with SM expectations
Table 8 shows the results of the measurement of and extracted from the fit without and with isospin constraints linking and decays.
Table 8: Results of the isospin-unconstrained (top four rows) and isospin-constrained fits
(last two rows). The columns show the
signal and normalization yields, the ratio of their efficiencies, , the signal branching fractions,
and and ,
the statistical and total significances of the measured signal yields.
Where two uncertainties are given, the first is statistical and the second is systematic. The second
and third uncertainties on the branching fractions
correspond to the systematic uncertainties due to and ,
respectively. The stated branching fractions for the isospin-constrained fit refer to decays.
Decay
314
60
1995
55
0.367
0.011
0.429
0.082
0.052
0.99
0.19
0.12
0.04
5.5
4.7
639
62
8766
104
0.227
0.004
0.322
0.032
0.022
1.71
0.17
0.11
0.06
11.3
9.4
177
31
986
35
0.384
0.014
0.469
0.084
0.053
1.01
0.18
0.11
0.04
6.1
5.2
245
27
3186
61
0.217
0.005
0.355
0.039
0.021
1.74
0.19
0.10
0.06
11.6
10.4
489
63
2981
65
0.372
0.010
0.440
0.058
0.042
1.02
0.13
0.10
0.04
8.4
6.8
888
63
11953
122
0.224
0.004
0.332
0.024
0.018
1.76
0.13
0.10
0.06
16.4
13.2
The branching fractions are calculated from the measured values of ,
(28)
For , we use the average branching fractions measured by
BABAR [39, 40, 41],
and for , the corresponding branching fractions related by isospin.
We estimate the statistical significance of the measured signal branching fractions as
,
where is the increase in log-likelihood
for the nominal fit relative to the no-signal hypothesis. The total significance
is determined as
(29)
In this expression, the statistical significance is scaled by the sum of the statistical
uncertainty and the additive systematic uncertainty .
The significance of the signal is , the first such measurement exceeding .
We compare the measured to the calculations based on the SM,
and observe an excess over the SM predictions for and of and
, respectively. We combine these two measurements in the following way
(30)
where , and is the total correlation between the
two measurements, .
Since the total uncertainty is dominated by the experimental uncertainty,
the expression in Eq. 30 is expected to be distributed as a
distribution for two degrees of freedom.
Figure 17 shows this distribution
in the – plane. The contours are ellipses
slightly rotated with respect to the – axes, due to the non-zero correlation.
Figure 17: (Color online). Representation of (Eq. 30) in the – plane.
The white cross corresponds to the measured , and the black cross to the SM predictions.
The shaded bands represent one standard deviation each.
For the assumption that , we obtain ,
which corresponds to a probability of . This means that the possibility
that the measured and both agree with the SM predictions is excluded at the
level 111
In this paper, the significance of an observation with
probability is expressed by the number of standard deviations
of a one-dimensional Gaussian function for this probability. The
shaded bands in Figs. 17, 21,
and 22
correspond to values of 0.683, 0.955, 0.997 and so on..
Recent calculations [7, 8, 43, 44] have
resulted in values of
that slightly exceed our estimate. For the largest of those values, the
significance of the observed excess decreases to .
IX.2 Search for a charged Higgs
To examine whether the excess in can be explained by contributions from a charged Higgs boson
in the type II 2HDM, we study the dependence of the fit results on .
Figure 18: (Color online). and projections of the PDF for various
values of . Figure 19: (Color online). Left: Variation of the (top) and (bottom) efficiency in the 2HDM
with respect to the SM efficiency. The band indicates the increase on statistical uncertainty
with respect to the SM value.
Right: Variation of the fitted (top) and (bottom) yields as a function
of . The band indicates the statistical uncertainty of the fit.
For 20 values of , equally spaced in the range, we recalculate
the eight signal PDFs, accounting for the charged Higgs contributions as described in
Sec. II. Figure 18 shows the and projections of the
PDF for four values of . The impact of charged Higgs contributions on the
distribution mirrors those in the distribution, see Fig. 3,
because of the relation
The changes in the distribution are due to the change in the polarization.
We recalculate the value of the efficiency ratio as a function
of (see Fig. 19). The efficiency increases up to 8%
for large values of , and, as we noted earlier, its uncertainty increases
due to the larger dispersion of the weights in the 2HDM reweighting.
The variation of the fitted signal yields as a function of is also shown in Fig. 19.
The sharp drop in the yield at is due to the large shift
in the distribution which occurs when the Higgs contribution begins to dominate the total rate.
This shift is also reflected in the distribution and, as we will see in the next section, the data
do not support it.
The change of the yield, mostly caused by the correlation with the sample,
is much smaller.
Figure 20 compares the measured values of and in the context of the type II 2HDM to the theoretical predictions as a function of .
The increase in the uncertainty on the signal PDFs and the efficiency ratio as a function
of are taken into account. Other sources of systematic uncertainty are kept constant
in relative terms.
The measured values of and match the predictions of this particular Higgs model
for and , respectively.
However, the combination of and excludes the type II 2HDM charged Higgs boson
at 99.8% confidence level for any value of , as illustrated in
Fig. 21.
This calculation is only valid for values of greater than [5, 8].
The region for has already been excluded by
measurements [22], and therefore, the type II 2HDM is excluded
in the full – parameter space.
Figure 20: (Color online). Comparison of the results of this analysis (light band, blue)
with predictions that include a charged Higgs boson of type II 2HDM (dark band, red).
The widths of the two bands represent the uncertainties.
The SM corresponds to . Figure 21: (Color online). Level of disagreement between this measurement of and the type II 2HDM
predictions for all values in the – parameter space.
The excess in both and can be explained in more general charged Higgs
models [45, 46, 47, 44].
The effective Hamiltonian for a type III 2HDM is
(31)
where and are independent complex parameters, and .
This Hamiltonian describes the most general type of 2HDM for which .
In this context, the ratios take the form
The sign difference arises because decays probe
scalar operators, while decays are sensitive to pseudo-scalar operators.
Figure 22: (Color online). Favored regions for real values of the type III 2HDM parameters and
given by the measured values of . The bottom two solutions are excluded by the
measured spectra.
The type II 2HDM corresponds to the subset of the type III 2HDM parameter space
for which and .
The measurements in the type II 2HDM context correspond to values of in the
range . Given that the amplitude impacted by NP contributions takes the form
(32)
we can extend the type II results to the full
type III parameter space by using the values of obtained
with for . Given the small dependence of (Fig. 20), this is a good approximation for decays.
For decays, this is also true when the decay amplitude is dominated
either by SM or NP contributions, that is, for small or large values of .
The shift in the and spectra, which results in the 40% drop on the value
of shown in Fig. 20, occurs in the intermediate region where
SM and NP contributions are comparable. In this region,
, and, as a result, the large drop in
is somewhat shifted. However, given that the asymptotic values of are correctly
extrapolated, is monotonous, and the measured value of is fairly constant,
the overall picture is well described by the
extrapolation.
Figure 22 shows that for real values of and ,
there are four regions in
the type III parameter space that can explain the excess in both and .
In addition, a range of complex values of the parameters are also compatible with
this measurement.
Figure 23: (Color online) Efficiency corrected distributions for (top)
and (bottom) events with scaled to the results of the
isospin-constrained fit. The points and the shaded histograms correspond to the measured
and expected distributions, respectively.
Left: SM. Center: . Right:
. The and samples are combined and the normalization
and background events are subtracted. The distributions are normalized to the number of
detected events.
The uncertainty on the data points includes the statistical uncertainties of data and simulation.
The values of are based on this uncertainty.
IX.3 Study of the spectra
As shown in Sec. II.2, the spectrum of decays could be
significantly impacted by charged Higgs contributions.
Figure 23 compares the distribution of background subtracted
data, corrected for detector efficiency, with the expectations of three different scenarios.
Due to the subtraction of the large feed-down in the samples, the measured
spectrum of decays depends on the signal hypothesis. This dependence is very small,
however, because the spectrum of decays is largely independent of .
The measured spectra agree with the SM expectations within the statistical uncertainties.
For decays, there might be a small shift to lower values, which is indicated by the
increase in the value for .
As we showed in Sec. II.2, the average for shifts
to lower values because the charged Higgs contribution to decays,
which always proceeds via an -wave, interferes destructively with the SM -wave.
As a result, the decay proceeds via an almost pure -wave and
is suppressed at large by a factor of , thus improving the agreement with data.
The negative interference suppresses the expected value of as well, however,
so the region with small is excluded by the measured .
The two favored regions in Fig. 22 with correspond
to for decays.
However, as we saw in Fig. 3, the charged Higgs contributions dominate
decays for values of and the spectrum shifts significantly to
larger values.
The data do not appear to support this expected shift to larger values of .
Table 9: Maximum value for the distributions in Fig. 23 corresponding to the variations
due to the systematic uncertainties.
SM
83.1%
98.8%
95.7%
98.9%
0.4%
97.9%
To quantify the disagreement between the measured and expected spectra,
we conservatively estimate the systematic uncertainties
that impact the distributions shown in Fig. 23 (Appendix).
Within these uncertainties, we find the variation that minimizes the value
of those distributions. Table 9 shows that, as expected,
the conservative uncertainties give rise to large values in most cases.
However, the value is only 0.4% for decays and .
Given that this value of corresponds to , we exclude the two solutions at the bottom of
Fig. 22 with a significance of at least .
The other two solutions corresponding to do not impact the distributions of
to the same large degree, and, thus, we cannot exclude them with the current
level of uncertainty.
However, these solutions also shift the spectra to larger values due to the -wave
contributions from the charged Higgs boson, so the agreement with the measured spectra
is worse than in the case of the SM. This is also true for any other solutions corresponding
to complex values of and .
On the other hand, contributions to decays proceeding via -wave tend to shift the
expected spectra to lower values.
Thus, NP processes with spin 1 could simultaneously explain the excess in
[45, 44] and improve the agreement
with the measured distributions.
,
X Conclusions
In summary, we have measured the ratios based
on the full BABAR data sample, resulting in
where the first uncertainty is statistical and the second is systematic.
These results supersede the previous BABAR measurements [14].
Improvements of the event selection have increased
the reconstruction efficiency of signal events by more than a factor of 3, and the overall
statistical uncertainty has been reduced by more than a factor of 2.
Table 10 shows the results of previous analyses.
In 2007 and 2010, the Belle collaboration measured the absolute branching fractions
which we translate to with
[12]
and [48].
For the translation of , we choose Belle’s measurement of the branching fraction, instead of the
world average, because of the current large spread of measured values.
For Belle 2009, we average the results for and decays.
The values measured in this analysis are compatible with those measured by the Belle Collaboration,
as illustrated in Fig. 24.
Figure 24: (Color online). Comparison of the previous measurements of with statistical and total uncertainties
(Table 10) with this
measurement (BABAR 2012).
The vertical bands represent the average of the previous measurements (light shading) and SM predictions (dark shading), separately for and . The widths of the bands
represents the uncertainties.
The results presented here exceed the SM predictions of
and
by and , respectively.
The combined significance of this disagreement, including the negative correlation
between and , is .
Together with the measurements by the Belle Collaboration, which also exceed the SM expectations,
this could be an indication of
NP processes affecting decays.
These results are not compatible with a charged Higgs boson in the type II 2HDM,
and, together with measurements, exclude this model in the full – parameter space.
More general charged Higgs models, or NP contributions with nonzero spin, are compatible with the
measurements presented here.
An analysis of the efficiency corrected spectra of and decays shows
good agreement with the SM expectations, within the estimated uncertainties.
The combination of the measured values of and the spectra exclude a
significant portion of the
type III 2HDM parameter space.
Charged Higgs contributions with small scalar terms, ,
are compatible with the measured and distributions, but NP contributions with spin 1
are favored by data.
Acknowledgements.
The concept for this analysis is to a large degree based on earlier BABAR work and we acknowledge the guidance provided by M. Mazur. The authors
consulted with theorists A. Datta, S. Westhoff, S. Fajfer, J. Kamenik, and I. Nišandžić
on the calculations of the charged Higgs contributions to the decay rates.
We are grateful for the
extraordinary contributions of our PEP-II colleagues in
achieving the excellent luminosity and machine conditions
that have made this work possible.
The success of this project also relied critically on the
expertise and dedication of the computing organizations that
support BABAR.
The collaborating institutions wish to thank
SLAC for its support and the kind hospitality extended to them.
This work is supported by the
US Department of Energy
and National Science Foundation, the
Natural Sciences and Engineering Research Council (Canada),
the Commissariat à l’Energie Atomique and
Institut National de Physique Nucléaire et de Physique des Particules
(France), the
Bundesministerium für Bildung und Forschung and
Deutsche Forschungsgemeinschaft
(Germany), the
Istituto Nazionale di Fisica Nucleare (Italy),
the Foundation for Fundamental Research on Matter (Netherlands),
the Research Council of Norway, the
Ministry of Education and Science of the Russian Federation,
Ministerio de Economía y Competitividad (Spain), and the
Science and Technology Facilities Council (United Kingdom).
Individuals have received support from
the Marie-Curie IEF program (European Union) and the A. P. Sloan Foundation (USA).
Figure 25: (Color online). Assessment of the uncertainties on the distributions of background events
with .
Left: results of the isospin-constrained fit for the SM.
Center: sample with
and . Right: sample satisfying the
BDT requirements in the region.
The data/MC plots show a fourth order polynomial fit and the total systematic
uncertainty considered.
The simulation in the control samples is normalized to the number of events in data.
See Fig. 15 for a legend.Figure 26: (Color online). Left: distributions for the different contributions, all normalized to 100 events.
Center: distributions for events with scaled to the results of the
isospin-constrained fit for the SM.
See Fig. 15 for a legend.
Right: dependence of the efficiency.
The scale for the efficiency of the normalization decays is chosen so that the maximum value is 1.
The efficiency data for the signal are adjusted so that they overlap with the data for normalization
decays in the central part of the range.
The signal efficiencies with and without the selection have the same scale.
APPENDIX: SYSTEMATIC UNCERTAINTIES ON THE SPECTRA
To assess the systematic uncertainty on the measured distributions of
decays, we examine their sensitivity to the estimated contributions
from background and normalization events.
The distributions of signal and the various backgrounds are presented in
Fig. 25 (left). There is good agreement between the data and
the background contributions as derived
from the isospin-constrained fit. To further examine the shape of the fixed contributions from and continuum background, we show two comparisons with data control samples:
one for medium values of in the peak regions without the BDT requirements
imposed, and the other for the sidebands with the BDT requirements. While the first
sample shows excellent agreement over the full range, the smaller second sample shows
some deviations at low and high .
We approximate the deviation of the data from the simulation by a fourth order polynomial,
and we adopt this difference plus the statistical uncertainty of each bin
as the overall uncertainty of the
and continuum backgrounds. We conservatively consider it uniformly distributed
between the limits of the band shown in Fig. 25 and uncorrelated
between different bins.
The systematic uncertainty on the shape of the distribution of decays is estimated by varying
the relative abundance of the contributions shown in Fig. 26.
We allow a variation of , the ratio of
decays to decays, between and . We also allow a contribution
of up to 30% of decays with the decaying into .
In addition, we assume a variation of the total yield.
The spectrum of normalization decays, both well reconstructed and cross-feed decays,
is well described by the simulation, see Fig. 26.
Given that the normalization decays are well understood theoretically, we adopt the statistical
uncertainty of the simulated distributions as the overall uncertainty of this contribution.
Except for , where the rate of signal decays is highly suppressed,
the efficiency and detector effects are very similar for signal and normalization. Thus, we also derive
the overall uncertainty from the statistical uncertainty of the
simulated signal distributions.
Since it is not feasible to repeat the – fit for each variation of the background contributions,
we adopt the following procedure to account for the impact of these changes
on the : for each of the three distributions in Fig. 23 and each variation
of the background components, we determine the
and yields by a fit that minimizes the of those distributions.
[25]J. Seeman, “Last Year of PEP-II
B-Factory Operation,” (2008), presented at the 11th European Particle Accelerator Conference (EPAC 2008),
Genoa, Italy, 23-28 June 2008.
[42]In this paper, the significance of an observation with
probability is expressed by the number of standard deviations
of a one-dimensional Gaussian function for this probability. The shaded bands
in Figs. 17, 21, and
22 correspond to values of 0.683, 0.955, 0.997
and so on.