SMU-HEP-12-21 Strange Quark PDF Uncertainty and its Implications for W/Z Production at the LHCThanks: Presented by A. Kusina at Light Cone 2012, 8-13 July 2012.
Abstract
We investigate the impact of parton distribution functions (PDFs) uncertainties on production at the LHC, concentrating on the strange quark PDF. Additionally we examine the extent to which precise measurements at the LHC can provide additional information on the proton flavor structure.
12.38.-t, 13.60.Hb, 14.70.-e
1 Introduction
Parton distribution functions provide the essential link between the theoretically calculated partonic cross-sections, and the experimentally measured physical cross-sections involving hadrons and mesons. This link is crucial if we are to make incisive tests of the Standard Model (SM), and search for subtle deviations which might signal new physics.
We show that despite recent advances in the precision data and theoretical predictions [1, 2, 3, 4, 5], the relative uncertainty on the heavier flavors remains large. We will focus on the strange quark and show the impact of these uncertainties on the production of bosons at the LHC
This work is based on Ref. [6], and further details can be found therein.
2 Extracting the Strange Quark PDF
In previous global analyses, the predominant information on the strange quark PDF came from the difference of (large) inclusive cross sections for Neutral Current (NC) and Charged Current (CC) DIS. For example, at leading-order (LO) the difference between the NC and CC DIS structure function is proportional to the strange PDF. Because the strange distributions are small compared to the up and down PDFs, the extracted from this measurement has large uncertainties. Lacking better information, it was commonly assumed the distribution was of the form
| (1) |
with . This approach was used, for example, in the CTEQ6.1 PDFs [7], but it does not reflect the true uncertainty of , in fact it reflects the uncertainty on the up and down sea which is well constrained by DIS measurements.
Beginning with CTEQ6.6 PDFs [8] the neutrino--nucleon dimuon data was included in the global fits to more directly constrain the strange quark;11 1 For a detailed review of experimental constraints of strange PDF see ref. [6]. thus, Eq. (1) was not used, and two additional fitting parameters were introduced to allow the strange quark to vary independently of the and sea.
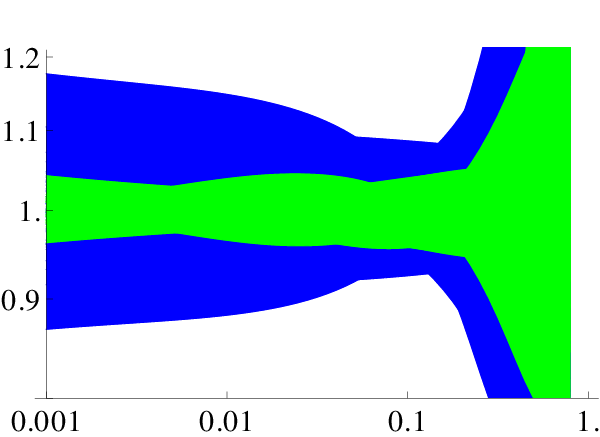
In Fig. 1 we show the relative uncertainty bands for the CTEQ6.6 PDF error sets (outer, blue), and for CTEQ6.1 sets (inner, green). We observe that in case of CTEQ6.6 the relative error on the strange quark is much larger than for the CTEQ6.1 set, particularly for , where the neutrino–nucleon dimuon data do not provide any constraints. We expect this is a more accurate representation of the true uncertainty.
3 Implications for Drell-Yan W/Z Production at the LHC


The Drell-Yan production of and bosons at hadron colliders can provide precise measurements for electroweak observables, which can measure fundamental parameters of the SM. Furthermore, the boson cross section “benchmark” processes are intended to be used for detector calibration and luminosity monitoring; to perform these tasks it is essential that we know the impact of the PDF uncertainties on these measurements. In the following, we will investigate the influence of the PDFs on the rapidity distributions of the Drell-Yan production process.
3.1 Strange Contribution to Production


Because the LHC has a different initial state and a higher CMS energy than the Tevatron, the relative contributions of the partonic subprocesses of the production change significantly. At the LHC, the contributions of the second generation quarks are greatly enhanced. In Fig. 2 we display how the different partonic cross sections contribute to production at LO. In Tevatron the channel contributes of the cross section, while contributions from strange quarks are comparably small . At the LHC, subprocesses containing strange quarks are considerably more important. The channel contributes only , while the channel yields .
We also note the LHC explores a much larger rapidity range. For channels containing strange quarks, can be measured up to 4.5 at the LHC, compared to 2.5 at the Tevatron; therefore smaller values of of the strange quark distribution can be probed.
While the LO illustration of Fig. 2 provides a useful guide, in Fig. 3 we display the strange quark contribution to the differential cross section of on-shell production computed at NNLO using [13]. The (yellow) band represents the strange-quark initiated contributions.
The figures impressively highlight the large contribution of the and quark subprocesses at the LHC. Consequently it is essential to constrain the strange PDF if we are to make accurate predictions and to perform precision measurements. Figure 3 also shows the very different rapidity profiles of the strange quark and valence quark terms. This property is most evident for the case of production. Here, the dominant contribution has a twin-peak structure, while the distribution has a single-peak centered at . The total distribution is then a linear combination of the twin-peak and single-peak distributions, and these are weighted by the corresponding PDF.
Therefore, a detailed measurement of the rapidity distribution of the bosons can yield information about the contributions of the quark relative to the quarks. As this is a relative measurement it is reasonable to expect that this could be achieved with high precision once sufficient statistics are collected. Consequently, this is an ideal measurement where the LHC data could lead to stronger constraints on the PDFs.
Note, that ATLAS has already used production to infer constraints on the strange quark distribution, and they measured at GeV2 and [14].
3.2 PDF Uncertainty of the rapidity distributions


In Fig. 4a, we display the differential cross section for production at the LHC ( TeV) using the 44 CTEQ6.6 error PDFs calculated at NNLO [13]. To better resolve these PDF uncertainties, in Fig. 4b we plot the ratio of the differential cross section compared to the central value. We observe that the uncertainty due to the PDFs as measured by this band is about for central boson rapidities.
For comparison, in Fig. 4c we display the (yellow) band of CTEQ6.6 error PDFs of Fig. 4b together with the results using a selection of contemporary PDFs, all scaled by the central value of CTEQ6.6 set.22 2 For details on the used PDFs see ref. [6]. We observe that the choice of PDF sets can result in differences ranging to about , which is well beyond the displayed in Fig. 4b.
While the band of error PDFs provides an efficient method to quantify the uncertainty, the range spanned by the different PDF sets illustrates that there are other important factors which should be considered.
3.3 Correlations of the rapidity distributions


The leptonic decay modes of the bosons provide a powerful tool for precision measurements of electroweak parameters such as the boson mass. As the leptonic decay of the boson contains a neutrino (), the boson production process () is used to calibrate the leptonic process. This method works to the extent the production processes of the and bosons are correlated.
One possible measure to gauge the correlation of the PDF uncertainty is the ratio of the sum of the differential and cross sections with respect to the differential boson cross section, normalized to the distribution of the central PDF set. We define:
| (2) |
In Fig. 5 we plot for the CTEQ6.5 and CTEQ6.6 PDF sets.
We observe that the uncertainty band in double ratios of Fig. 5 are much smaller than for single ratio of Fig. 4, which reflects the fact that and processes are correlated. We also observe that the band for CTEQ6.5 (Fig. 5a) is much smaller than for CTEQ6.6 (Fig. 5b), meaning that correlation between and processes is bigger when we use CTEQ6.5 PDFs.
The primary difference that is driving this result is the different strange PDF. For CTEQ6.5 the strange quark was defined by Eq. (1) while CTEQ6.6 introduced two extra fitting parameters which allowed the strange PDF to vary independently from the up and down sea. Thus, the uncertainty of the CTEQ6.6 distributions more accurately reflects the true uncertainty.
4 Conclusion
We have investigated the constraints of the strange PDFs and their impact on the boson production at the LHC.
We observe that the strange quark is rather poorly constrained, particularly in the low region which is sensitive to production at the LHC. Improved analyses from neutrino DIS measurements could help reduce this uncertainty. Conversely, precision measurements of production at the LHC may provide input to the global PDF analyses which could further constrain these distributions.
Acknowledgments
This work was partially supported by the U.S. Department of Energy under grant DE-FG02-04ER41299, and the Lightner-Sams Foundation.
References
- [1] H. Abramowicz et al., Z. Phys. C25 (1984) 29.
- [2] J. P. Berge et al., Z. Phys. C35 (1987) 443.
- [3] CCFR Collaboration Collaboration, A. Bazarko et al., Z.Phys. C65 (1995) 189–198, hep-ex/9406007.
- [4] S. Kretzer, H. L. Lai, F. I. Olness, and W. K. Tung, Phys. Rev. D69 (2004) 114005, hep-ph/0307022.
- [5] NuTeV Collaboration, M. Tzanov et al., Phys. Rev. D74 (2006) 012008, hep-ex/0509010.
- [6] A. Kusina, T. Stavreva, S. Berge, F. Olness, I. Schienbein, et al., Phys.Rev. D85 (2012) 094028, 1203.1290.
- [7] D. Stump, J. Huston, J. Pumplin, W.-K. Tung, H. Lai, et al., JHEP 0310 (2003) 046, hep-ph/0303013.
- [8] P. M. Nadolsky, H.-L. Lai, Q.-H. Cao, J. Huston, J. Pumplin, et al., Phys.Rev. D78 (2008) 013004, 0802.0007.
- [9] A. Martin, W. Stirling, R. Thorne, and G. Watt, Eur.Phys.J. C63 (2009) 189–285, 0901.0002.
- [10] R. D. Ball et al., Nucl. Phys. B838 (2010) 136–206, 1002.4407.
- [11] S. Alekhin, J. Blumlein, S. Klein, and S. Moch, Phys.Rev. D81 (2010) 014032, 0908.2766.
- [12] P. Jimenez-Delgado and E. Reya, Phys.Rev. D79 (2009) 074023, 0810.4274.
- [13] C. Anastasiou, L. J. Dixon, K. Melnikov, and F. Petriello, Phys.Rev. D69 (2004) 094008, hep-ph/0312266.
- [14] ATLAS Collaboration, G. Aad et al., Phys.Rev.Lett. 109 (2012) 012001, 1203.4051.