Hadron Collider Physics symposium 2012
Single Top Physics at Hadron Colliders
Abstract
The production of top quark in electroweak processes was first observed in 2010 at the Tevatron. Since then it has been carefully studied at both LHC and Tevatron. Single top production proceeds through different channels and allows a direct determination of Cabibbo-Kobayashi-Maskawa matrix element . We will present the current status of searches and observation and discuss the results obtained so far and perspectives at hadron machines.
1 Introduction
Top quark is produced in pair in strong interactions but can also be produced in electroweak interactions. In the latter processes only one top quark appears in the final state. Therefore this set of processes is generically dubbed single top. Formally the single top production proceeds by different Feynman diagrams and you can distinguish in figure 1 production through (a), (b) and (c) channels.

At hadron colliders (see table 1) the three processes have quite different cross sections strongly dependent by the center of mass energy and the PDF of the incoming partons. Going from 2 to 7 and 8 TeV, and production increases by factor while channel only increases by a factor 4. We will discuss later the implications of this effect, due to the different ( versus ) initial state.
Historically, while top quark was discovered in 1995 [1] in process, due to the very low signal(S)-over-background(B) ratio it took 14 more years to see single top at the Tevatron [2], [3]. ATLAS and CMS, instead, thanks to the much larger cross sections and better S/B available at the LHC, already saw single top in the channel in 2011 and measured its cross section in 2012 [4], [5].
channel, completely impossible to identify at the Tevatron, was explored and recently evidence was reported by both ATLAS [6] and CMS [7].
1.1 Physics interest
The main interest in measuring single top properties is, set aside comparison to prediction, that its production cross section is proportional to the CKM matrix element under the assumption that . Actually you measure where within the Standard Model. In other words, directly measuring we can test models with more than three generations, anomalous couplings in top sector and other new physics scenarios.
2 Signal and Background
The single top final state is characterized by at least a and 2 or 3 jets. One jet and the come from the top decay, while the other jets are related to the production channel. Therefore in channel the final state has 2 or 3 jets (one, not coming from top, mostly in the forward region), in the channel two jets from fragmentation. Finally the channel has two s and one jet in the final state. The topology for and channel strongly resembles the associate production making the observation of this process important for SM Higgs studies as well as for searches of new bosons (, ). Due to the need to suppress background, events are collected using high- lepton triggers, therefore the final states that will be used always contain s decaying into leptons.
| Energy | channel | channel | channel |
|---|---|---|---|
| Tevatron (1.96 TeV) | |||
| LHC (7 TeV) | |||
| LHC (8 TeV) |
From the topologies described it is obvious that any experiment looking for single top must identify charged (, , ) and neutral leptons, latter through measurement of missing transverse energy (from now on MET). It must also be able to reconstruct jets and tag the ones containing heavy flavour. Since the last decade of the past century any experiment at hadron colliders has such capabilities.
2.1 Backgrounds
In a final state containing a and two or three jets, the background is composed of:
- •
events from strong interactions, , , events, heavy flavours (), light flavour () estimated using MC simulations;
- •
multijet ("QCD") events where one jet fakes a lepton and a mismeasurement of transverse energy generates a fake neutrino signal;
- •
(+heavy flavour jets), (+light flavour jets).
Multijet contribution, being due to a combination of very low probability topology of events with large yield together with non-well modeled detector features, is measured in data. This procedure, however, carries a large uncertainty (usually ). and contributions are computed by algorithms that use a mixture of data-driven and Monte Carlo estimates.
In absence of a final state containing any heavy flavour, a tag can be faked by failure of tracking and/or pattern recognition algorithms. Fakes are parametrized as a function of jet and event characteristics using control data samples.
3 Selection
After requiring a high charged lepton, large MET, and two high jets, all experiments apply specific requirements to suppress multijet background. Useful quantities are the angular distance () between physics objects, the scalar sum of the of the visible objects (), the transverse mass () between the charged and the neutral leptons and of course the MET.
CDF, ATLAS and CMS directly use a cut in the MET- plane, D0 applies a cut in and in . No attempt is made to optimize rejection of this background using multivariate techniques employed in other analyses.
Furthermore ATLAS and CMS exploit the fraction of jet tracks pointing to the primary vertex to reject background events due to pileup.
4 Signal Extraction
After all requirements the situation in the two accelerators is quite different. At the Tevatron the signal is still swamped by background (see table 2) while at the LHC, signal is of the background ( channel). channel is only 5% of the -channel signal while is of the -channel (see for example table 3). Therefore the strategies followed by the Tevatron experiments are different from the ones at the LHC.
4.1 CDF and D0
Due to the tiny yields and low S/B historically Tevatron experiments did not attempt to distinguish between and contributions but rather to establish the existence of the signal.
| Source | 2-jets | 3-jets | 4-jets |
|---|---|---|---|
| ,multiboson | |||
| Multijet | |||
| Total expectation | |||
| Data | 4881 | 2307 | 1283 |
For that reason the analyses we present here follow the same strategy: first measure the cross section combined and then attempt to determine and channels separately. The low S/B () makes mandatory the use of multivariate analysis tools to identify the single top contribution.
D0 uses three different multivariate techniques (Bayesian Neural Network, Boosted Decision Tree, NEAT). Each algorithm is trained and optimized for and channel separately. Their output is fed to a final Bayesian Neural Network (BNN) discriminant. The output of the BNN is shown in figure 2 for the signal rich (>0.8) region.

By fitting the various components of the BNN output, D0 measures, with an integrated luminosity of 5.4 , a cross section of pb.
As a next step one can fix the ratio to its Standard Model value and find a value for the cross section of pb and pb. In turn this result can be used to set a limit at 95 %C.L. [9].
By leaving the two cross section free D0 measures pb and [10]. Obviously the latter result does not represent an evidence for production.
After presenting the first observation using a data set corresponding to 3.4 and three different analysis techniques, CDF updated one of these analyses, based on the use of a set of Artificial Neural Networks (ANN) discriminants separately optimized for the and channel and for samples with 2 and 3 jets using a data set of 7.5 . With respect to the original analysis several improvements were applied: increased acceptance for and , use of additional trigger paths, a new QCD background suppression technique. Finally an improved simulation of the signal (using POWHEG generator) [11]). After selection, the outputs of the different discriminants are used as input to a final ANN optimized for [2].
The result is , and at 95 % C.L. Finally CDF fits the two channels simultaneously and obtains (see figure 3) pb and pb [12]. This result is in agreement with SM expectations at the level.

4.2 ATLAS and CMS
The large amount of data available at the LHC, combined with the increase in cross section, allow a thorough study of many top properties and production mechanisms. However, as already mentioned, the increase in background makes the channel very difficult to observe. Therefore both Collaborations, so far, concentrated on the and channel.
For channel the strategy (common to both experiments) is to split the lepton+jets sample by jet number (2,3) and number of -tags (0,1,2). The signal region is the one with two jets and one tag, the other two are used as control regions. Table 3 shows, as an example, the sample composition after all requirements in the 8 TeV ATLAS data. In the 2 jet bin channel is 12 % of the total number of events, 4 % and channel is less than 1 %.
| Source | 2-jets | 3-jets |
|---|---|---|
| -channel | ||
| -channel | ||
| ,multiboson | ||
| Multijet | ||
| Total expectation | ||
| Data | 40663 | 23697 |

CMS explored the data set collected in 2011 at 7 TeV searching for top produced in channel using three different techniques. One (dubbed "") exploits a characteristic feature of -channel single top events: the forward pseudorapidity of the light jet recoiling against the top. The other two (Neural Network and BDT) are multivariate techniques that compare signal expectation with observation. The aim of the multivariate analyses is to combine the information contained in the signal enriched and signal depleted regions to obtain a precision measurement of the single top cross section. The luminosity used is fb-1 for electrons(muons).
In the analysis CMS exploits the different kinematical properties of signal and jets background to further split the signal region (2 jet, 1 tag) into signal rich and background enriched regions. In figure 4 you can see the mass distribution for the system [13]. After requiring GeV/c2 the S/B reaches . This provides enough separation that a simple fit to the distribution of the most forward jets is sufficient to measure the single top cross section (see figure 5).

The results of the three analyses are the following: : pb; NN: pb; BDT: pb.
All results are consistent with SM expectations and among each other.
By combining the three measurements, the overall result is pb and or at 95 % C.L. [5].
In the 8 TeV sample more stringent requirements are applied in order to deal with the pile-up. While at 7 TeV the typical number was events per crossing, the increase in luminosity brought this number in 2012 up to well above 20 events/crossing (with a recording by CMS of 78 events in a given crossing) [15]. Despite this additional challenge CMS measures, using just the technique, pb and or at 95 % C.L. [14].
Production through channel was successfully observed at 7 TeV also by ATLAS. Key is, again, the selection of events where a is produced in association with 2 or 3 jets and one -tag (signal region) or no tag (control region). After selection S/B and an Artificial Neural Net is used. In figure 6 the distribution (one of the input to the ANN) is shown for the 2 jet events sample. Signal is clearly visible.

Fitting the output discriminant, ATLAS measures pb and or at 95 % C.L. [4]. Splitting the sample in and , ATLAS measures pb and pb in agreement with SM prediction. The ratio of these two cross sections can be used to constrain the ratio of PDFs. ATLAS measures in agreement with predictions [16].
At 8 TeV the signal growth by 35 % is matched by increase (40 %) and ( %). What is most challenging is, as already mentioned, the pileup. The growing number of overlapping events requires harder lepton isolation cuts, and re-tune dedicated requirements in order to keep it under control. In the end S/B (see table 3) and, applying the same analysis technique used for the 7 TeV data set, ATLAS measures pb and at 95 % C.L. [17].

5 Single top in channel
While production has a negligible cross section at the Tevatron,its yield at the LHC allows to look for it. Both experiments searched for in the 7 TeV data using the dilepton channel (when both the primary and the one from decay leptonically).
In table 4 we show the ATLAS sample composition in the sample (with ). Despite the large background, the bin shows a S/B 18 %. Therefore ATLAS, using a BDT with 22 input variables, is able to see an evidence with a significance of (3.4 expected) in a data sample at 7 TeV corresponding to an integrated luminosity of 2.05 fb-1 (see figure 7). The cross section is pb from which [6].
| Source | 1-jet | 2-jet | 3-jet |
|---|---|---|---|
| Diboson | |||
| Fake dileptons | negl. | ||
| Total backg. | |||
| Total expectation | |||
| Data Observed | 934 | 1300 | 825 |
CMS follows the same strategy. The signal region is defined by one jet, 1 b-tag while control regions are defined as 2 jets, 1 or 2 b-tags. S/B is 24 % in the signal region. Input to a BDT are four variables: (scalar sum of the transverse energy of the visible objects), the of the leading jet, the angular distance between the MET and the closest lepton and the of the system composed by the two leptons, MET and the jet (signal region) (shown in fig. 8).
CMS obtains an evidence of 4 and measures, in a data set of 4.9 fb-1, pb and extracts [7].

6 Conclusion
By Fall 2012 the production of single top is definitively well established at least in two of the three channels.
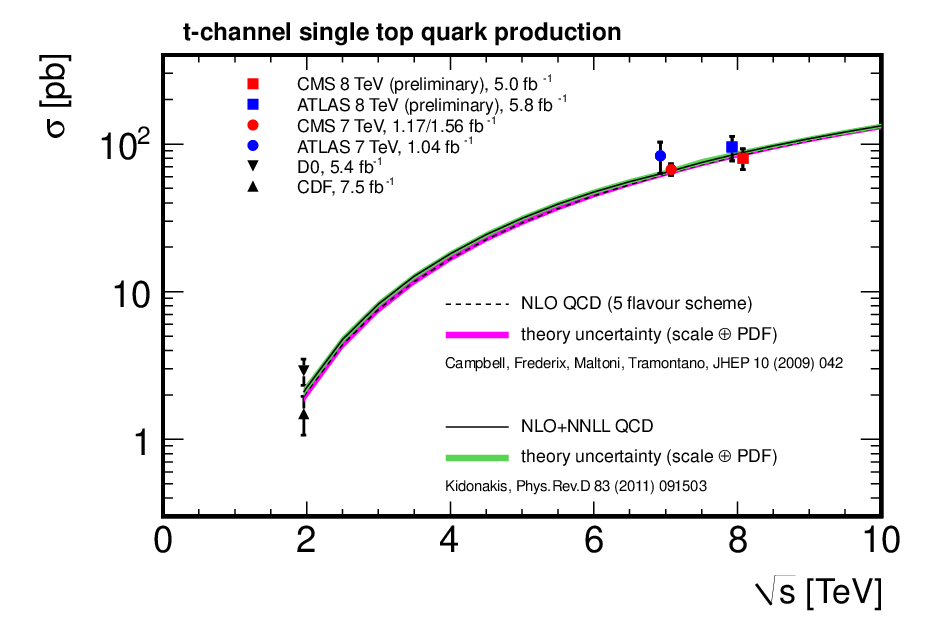
Figure 9 summarizes the channel measurements at different energies and different colliders. The agreement with theoretical prediction is striking.
Production through , thanks to the large statistics accumulated at the LHC, is established at the 4 level. Given that the measurement is by far statistics limited, the expectation is that will reach the 5 level for a full "observation" by Winter 2013 once the 8 TeV data set are analyzed.
Production through channel, however, is not yet fully established. CDF measures with two-third of its data set. While the Tevatron is by now closed, analyses are in progress to update single top cross section measurements with the whole data set. Besides, channel specific strategies and the use of new tagging tools are being pursued.
At the LHC, despite the large statistics, currently the very low S/B makes channel a process difficult to observe. Dedicated strategies must still be developed. In general the increase of luminosity comes with a dear price of a very large amount of pile-up. While the Collaborations have shown their capability to deal with this new challenge, its impact on the accuracy of future measurements cannot be underestimated.
Using the current single top cross section measurements, one can compile (see figure 10) a list of the direct determination of . The situation is far from being satisfying. While the CMS 7 TeV measurement [5] has an uncertainty of 5 %, all the other results (including the most recent one by CMS at 8 TeV) have uncertainties at the level of 10%, too large to challenge the SM. As the LHC has already large statistics, these measurements are (mostly) systematics limited. It is a challenge to tackle in order to use this process as a tool to search for new physics in the top sector.

7 Acknowledgments
I would like to thanks the Organizers for inviting me and my colleagues of the different experiments for the useful information. Finally I would like to remember late Kuni Kondo, my colleague for many years who first introduced me to Japan at the PPbar workshop held in KEK in 1993.
References
- (1) F. Abe et al., CDF Collaboration, Phys. Rev. Lett. 74,2626 (1995); S. Abachi et al., D0 Collaboration, Phys. Rev. Lett. 74,2632 (1995).
- (2) T. Aaltonen et al., CDF Collaboration, Phys. Rev. Lett. 103,092002 (2009).
- (3) V. M. Abazov et al., D0 Collaboration, Phys. Rev. Lett. 103,092001 (2009).
- (4) ATLAS Collaboration, Phys. Lett. B 717,330-350 (2012);
- (5) CMS Collaboration, arXiv:1209.4533 (2012), to appear in JHEP
- (6) ATLAS Collaboration, Phys. Lett. B 716, 142-159 (2012).
- (7) CMS Collaboration, Phys. Rev. Lett.110, 022003 (2013).
- (8) N. Kidonakis Phys. Rev. D 74, 114012 (2006); N. Kidonakis Phys. Rev. D 82, 054018 (2010); N. Kidonakis Phys. Rev. D 83, 091503 (2011).
- (9) V. M. Abazov et al., D0 Collaboration, Phys. Rev. D 84, 112001 (2011).
- (10) V. M. Abazov et al., D0 Collaboration, Phys. Lett. B 703,313 (2011).
- (11) M. Ronzani, University of Pisa Thesis (Pisa, 2012), available at http://etd.adm.unipi.it/theses/available/etd-08012012-101339/
- (12) The CDF Collaboration, public note CDF-10793.
- (13) Figure is courtesy of J. Wagner-Kuhr.
- (14) CMS Collaboration, CMS-PAS-TOP-12-011 http://cds.cern.ch/record/1478935.
- (15) C. Neu, these Proceedings.
- (16) ATLAS Collaboration, CONF-2012-056 http://cds.cern.ch/record/1453783.
- (17) ATLAS Collaboration, CONF-2012-132 http://cds.cern.ch/record/1478371.