Unveiling The -Discrepancy II:
Revisiting the Evolution of ULIRGs & The Origin of Quasars
Abstract
We present the first central velocity dispersion (∘) measured from the 0.85 Calcium II Triplet (CaT) for 8 advanced (i.e. single nuclei) local (z 0.15) Ultraluminous Infrared Galaxies (ULIRGs). First, these measurements are used to test the prediction that the “-Discrepancy,” in which the CaT ∘ is systematically larger than the ∘ obtained from the 1.6 or 2.3 stellar CO band-heads, extends to ULIRG luminosities. Next, we combine the CaT data with rest-frame I-band photometry obtained from archival Hubble Space Telescope data and the Sloan Digital Sky Survey (SDSS) to derive dynamical properties for the 8 ULIRGs. These are then compared to the dynamical properties of 9,255 elliptical galaxies from the SDSS within the same redshift volume and of a relatively nearby (z 0.4) sample of 53 QSO host galaxies. A comparison is also made between the I-band and H-band dynamical properties of the ULIRGs. We find four key results: 1) the -Discrepancy extends to ULIRG luminosities; 2) at I-band ULIRGs lie on the Fundamental Plane (FP) in a region consistent with the most massive elliptical galaxies and not low-intermediate mass ellipticals as previously reported in the near-infrared; 3) the I-band M/L of ULIRGs are consistent with an old stellar population, while at H-band ULIRGs appear significantly younger and less massive; and 4) we derive an I-band Kormendy Relation from the SDSS ellipticals and demonstrate that ULIRGs and QSO host galaxies are dynamically similar.
Subject headings
galaxies: evolution—galaxies: formation—galaxies: interactions— galaxies: peculiar—galaxies: kinematics and dynamics—quasars:generalI. Introduction
Questions about the formation and evolution of galaxies are as challenging today
as when the 3rd Earl of Rosse first sketched his observations of “external nebulae”
(Rosse 1850). Referring to M51, he remarked that their
complexity and striking beauty could hardly be the result of static processes. Objects
like M51 and the Antennae (NGC 4038/39) have been the focus of astronomical investigations
since their appearance in Herschel’s Catalogues of Nebulae and Clusters
(Herschel 1786). As photographic plates replaced pencil and paper, surveys
continued to catalog peculiar “external nebulae” with ever increasing speculation about
their origins
(Pease 1917; Pease 1920; Perrine 1922; Redman & Shirley 1938, e.g.).
Observational work, including morphological classification and measurement of dynamical
properties (Hubble 1930; Zwicky 1956, e.g.),
the first N-body simulations (Holmberg 1941, e.g.)
and subsequent numerical simulations (Alladin 1965; Wright 1972)
explored the possibility that peculiar galaxies represented the
transformation of galaxies from one form into another by means of interaction.
These earlier works all led directly to the Toomre Hypothesis
(Toomre & Toomre 1972; Toomre 1977) which posits that when gas-rich spirals
collide and merge together they form a new, more massive elliptical galaxy and that this
process is responsible for the formation of all or most ellipticals in the Universe.
The gravitational interaction between the two spirals rearranges the
stellar orbits from circular to random via violent relaxation
(Lynden-Bell 1967; Hjorth & Madsen 1991, e.g.,). The process of gaseous
dissipation funnels gas into the common gravitational center of the coalescing system,
which triggers intense star-formation deep within molecular clouds and adds substantial
mass to the final remnant
(Barnes & Hernquist 1991; Mihos & Hernquist 1994a; Mihos & Hernquist 1996, e.g.,).
The most intense mergers are Ultraluminous Infrared Galaxies (ULIRGs), systems with
LIR (8-1000 ) 1012 L⊙
(e.g. see Sanders & Mirabel 1996; Sanders 1999; Joseph 1999, for a review).
The hypothesis that there is a natural evolution from ULIRG to QSO is based on the idea
that gaseous dissipation fuels more than a nuclear starburst. The accretion of
both gas clouds and stellar remnants fuels the formation of an active galactic nucleus
or AGN (Sanders et al. 1988, hereafter S88). This was further supported by
the similarity between the observed bolometric (LBol) luminosities and
space-densities of ULIRGs and QSOs out to at least z0.4
(Soifer et al. 1986; Canalizo & Stockton 2001). Only after the obscuring medium in the ULIRG is cleared by
(presumably) radiation pressure and supernovae explosions does the
QSO become visible (Hopkins et al. 2006, e.g.).
Photometric observations of spiral-spiral mergers, including ULIRGs and
their lower luminosity (1011 L⊙ LIR
1012 L⊙) counterparts, Luminous Infrared Galaxies (LIRGs),
demonstrated strong evidence supporting the Toomre Hypothesis. This includes confirmation
from optical to near-IR wavelengths that the global surface brightness (SB) profiles
of advanced mergers follow the same de Vaucouleurs r1/4 stellar light profile
(de Vaucouleurs 1953) that characterizes elliptical galaxies
(e.g., Schweizer 1982; Wright et al. 1990; Lutz 1991; Schweizer 1996; Hibbard & van Gorkom 1996; Veilleux et al. 2002; Rothberg & Joseph 2004; Veilleux et al. 2006; Rothberg & Fischer 2010b, hereafter Paper I),
in line with predictions from numerical simulations (Barnes 1988; Barnes 1992, e.g.,).
Moreover, numerical simulations show that gaseous dissipation during the merger
will form a rotating gas disk which undergoes a strong starburst and transforms into a
rotating stellar disk
(Barnes & Hernquist 1991; Mihos & Hernquist 1994b; Barnes & Hernquist 1996; Mihos & Hernquist 1996; Barnes 2002; Hopkins et al. 2008, e.g.).
The starburst generates a luminosity spike at small radii, r 1-2 kiloparsecs (kpc),
in the surface brightness profiles of mergers
(Mihos & Hernquist 1994a; Springel 2000). This excess light was first directly
detected in the K-band SB profiles of mergers, including (U)LIRGs, and found to have
LK 109.5-10.5 L⊙
(Rothberg & Joseph 2004, hereafter RJ04).
Hopkins et al. (2008) modeled the same sample and demonstrated that the excess light
from younger stars alone could account for 30 of the total stellar mass.
(Haan et al. 2011) detected similar excess light at H-band using
HST for a larger sample of (U)LIRGs spanning a wider range of merger stages.
Their Figure 14 appears to show an evolution of the excess light as a function
of the merger stage including what could be peaks at first passage and final coalescence.
These properties, taken together with the observed vast quantities
(109-10 M⊙) of cold molecular gas
(Solomon et al. 1992; Bryant & Scoville 1996; Solomon et al. 1997; Scoville et al. 1997; Downes & Solomon 1998; Iono et al. 2005; Greve et al. 2009, e.g.)
and vigorous star-formation rates (e.g., Prestwich et al. 1994; Anantharamaiah et al. 2000, SFR),
make ULIRGs prime candidates for the progenitors of giant ellipticals (gEs) and QSO hosts.
However, a significant challenge arose for the Toomre Hypothesis and the S88
scenario when dynamical masses (MDyn) obtained from central velocity
dispersions (∘) using the 1.6 or 2.3 CO band-heads
(hereafter denoted as ∘,CO) and imaging at H (1.6 ) or
K-band (2.2 ) implied that (U)LIRGs were the progenitors of low to
intermediate mass ellipticals
(Shier et al. 1996; Shier & Fischer 1998; James et al. 1999; Genzel et al. 2001; Tacconi et al. 2002; Dasyra et al. 2006, e.g.,).
The near-infrared was used because it is less affected by the presence of dust than
optical wavelengths. Dunlop et al. (2003) (hereafter D03) compared
near-IR photometry, by assuming
a fiducial transformation, with optical imaging of nearby (z 0.4) radio
loud and radio quiet QSOs (RLQ and RQQ, respectively)11
1
The dividing line between
radio loud and quiet at 6 cm is 1024 W Hz-1 Sr-1
(Miller et al. 1990; Stocke et al. 1992; Hooper et al. 1995). D03 concluded that
the small half-light radii of ULIRGs precluded them as candidates for the progenitors of
QSO host galaxies. Veilleux et al. (2006) made a similar comparison using
Hubble Space Telescope (HST) imaging obtained with the Near Infrared Camera and
Multi-Object Spectrometer (NICMOS) at F160W ( H-band) of ULIRGs and
Palomar Green (PG) QSOs, along with QSOs from D03
(transformed from R-band to F160W),
and relatively nearby ellipticals. They concluded that ULIRGs were the progenitors
of 1-2 L∗ ellipticals or S0s.
Interestingly, when the Calcium II Triplet stellar absorption lines
( 0.85 ) were used to measure ∘
(hereafter ∘,CaT) a very different picture emerged. A comparison
between ∘,CaT and ∘,CO in the same set of LIRGs
systematically showed ∘,CaT ∘,CO
(Rothberg & Joseph 2006a, hereafter RJ06a). Moreover, the ∘,CaT
values were consistent with ellipticals over a large mass range, including gEs.
Recent work by (Rothberg 2009; Rothberg & Fischer 2010b, hereafter Paper I)
has effectively explained this -Discrepancy. Paper I compared
∘,CaT with ∘,CO and I-band photometry with
K-band photometry in advanced LIRG and non-LIRG mergers as well as elliptical
galaxies. No -Discrepancy was found for elliptical galaxies, a result
subsequently confirmed by Vanderbeke et al. (2011). Paper I also showed that in
advanced mergers (Log LIR 11.99), the -Discrepancy strongly
correlated with Log LIR and dust mass. Although Paper I did not include
any ULIRGs in the sample, the results were extrapolated to brighter LIR.
Paper I concluded that in IR-luminous mergers the near-IR observations are dominated by
the presence of a luminous, rotating young central stellar disk (YCSD) which contains a
population of Red Supergiant (RSG) or Asymptotic Giant Branch (AGB) stars. Stellar disks
have been directly detected in Hubble Space Telescope (HST) observations of
the archetypal merger NGC 7252 (Whitmore et al. 1993) and the LIRG merger NGC 34
(Schweizer & Seitzer 2007), with diameters ranging from 2-6 kpc. These are consistent with
the extent of the excess light at K and H-band (Haan et al. 2011, RJ04,);
the observed size of rotating molecular gas disks in mergers
(Dupraz et al. 1990; Wang et al. 1991; Downes & Solomon 1998, e.g.)
and numerical simulations (Barnes 2002; Hopkins et al. 2008, e.g.).
The rotating YCSD affects
the ∘,CO measured in the centers of
IR-luminous galaxies, which in turn affects the derived values of
MDyn.
However, at I-band, the presence of dust, which is more centrally concentrated
due to the starburst, behaves like a coronagraph. It masks the bright YCSD so that
∘,CaT reflects only the random motions of the old stellar
population, probing the galaxy’s true MDyn. Figures 13-15 in Paper I
demonstrated that the red colors
within the central 1.53 kpc could be best explained by many magnitudes of extinction.
While at larger radii the colors (Figure 13 and 14 in Paper I) were consistent
with the average colors observed in elliptical galaxies, supporting the proposition that
dust is centrally concentrated in IR-luminous mergers.
Thus, when viewed at near-IR wavelengths LIRG mergers appear to have young
stellar populations with MDyn m∗,
where m∗ is the stellar (not dynamical) mass
31010 M⊙ (Blanton et al. 2003; Bell et al. 2003).
While at I-band they appear to have older stellar
populations and MDyn m∗.
The results in Paper I provide strong motivation for revisiting the S88 paradigm
of whether ULIRGs are massive enough to form gEs and host QSOs.
This paper presents the first results for 8 ULIRGs (part of a larger survey)
using ∘ from the CaT stellar
absorption lines in conjunction with rest-frame I-band imaging. We probe two
important questions: 1) Does the -Discrepancy extend to the more luminous
ULIRG population? and 2) At I-band are the dynamical properties of advanced ULIRGs
consistent with gEs, including the host galaxies of QSOs?
All data and calculations in this paper assume
H∘ 75 km s-1 Mpc-1 and a cosmology of
M 0.3, λ 0.7 (q∘ -0.55). All
photometric results are in VEGA magnitudes. In this work, ULIRGs are strictly defined as
LIR 1012.0L⊙. LIRGs are
strictly defined as
1011.0L⊙ LIR 1011.99L⊙.
II. Samples
II.1. ULIRG Sample
The 8 ULIRGs analyzed in this paper were randomly selected (based on observability and available rest-frame I-band imaging only) from a larger, complete, volume limited (z 0.15) sample of 40 advanced objects taken from the Infrared Astronomical Satellite (IRAS) 1 Jy Survey (Kim & Sanders 1998) and the IRAS Revised Bright Galaxy Sample (Sanders et al. 2003). The IRAS 1 Jy survey is a complete sample of 118 ULIRGs down to flux levels of fν 1 Jy with Galactic latitude b 30∘, declination -40∘ and 0.02 z 0.27. The Revised Bright Galaxy Sample is a flux-limited survey of galaxies with a 60 flux density 5.24 Jy covering the entire sky surveyed by IRAS. Late-stage ULIRGs were selected because ∘ is unlikely to change substantially once the nuclei coalesce (Mihos 1999). Based on numerical simulations and observations it marks the point at which the merger should exhibit properties in common with elliptical galaxies. HST F160W NICMOS2 images were used to confirm the presence of a single nucleus in each system (within the resolution limits of 59-182 pc). Six of the eight ULIRGs were observed with HST using either the Advanced Camera for Surveys Wide Field Camera (ACS/WFC) or the Wide Field Planetary Camera 2 (WFPC2). Photometric data for the remaining two were obtained from the Seventh Release of the Sloan Digital Sky Survey (York 2000; Abazajian 2009, hereafter SDSS DR7). Optical images of the ULIRGs are shown in Figure 1 of Appendix C. Table 1 lists the basic information: Names, Right Ascension (R.A.), Declination (Dec.), redshift (z), Log LIR, and Galactic Reddening E. LIR is defined as the total flux from 8-1000 (Sanders & Mirabel 1996) using the four IRAS passbands (12, 25, 60 and 100 ). However, supplemental 12 or 22 photometry from the Wide-Field Infrared Survey Explorer was used in several cases where IRAS did not detect the ULIRG (see notes in Table 1).
II.2. Comparison Samples
II.2.1 SDSS i-band DR7 Elliptical Sample
In order to assess the significance of the optically measured values of ∘,CaT and masses of ULIRGs, a comparison sample of elliptical galaxies was assembled from the SDSS DR7 which offers larger spectroscopic and photometric coverage over earlier releases and improvements in photometric and spectroscopic measurements. The comparison sample was selected to be volume limited (z 0.15) to match the ULIRG sample. A total of 9,255 elliptical galaxies were extracted from the SDSS using the selection criteria detailed in Appendix A. The selection criteria required that the elliptical galaxy must be present in both the photometric and spectroscopic databases.
II.2.2 Radio Loud and Radio Quiet QSOs
A relatively nearby (0.08 z 0.46) comparison sample of 28 RLQ and 25 RQQ host galaxies was compiled from available photometry obtained with WFPC2 on HST and ground-based kinematic data. Only QSOs with confirmed elliptical host morphology were selected from the samples of Bahcall et al. (1997); Hamilton et al. (2002); Dunlop et al. (2003); Floyd et al. (2004); Hamilton et al. (2008). The source papers all note that their samples were designed so that: 1) the RLQ and RQQ subsamples are matched in terms of optical luminosity; 2) MV -23, representing L L∗ galaxies and ensuring that QSOs were selected; and 3) at z 0.4 the resolution of the WFPC2 cameras were sufficient to separate host from nucleus. In all cases the authors of the source papers performed extensive point spread function (PSF) modeling using separate stellar observations to properly subtract the nucleus from the host. Although the assembled comparison sample of QSO host galaxies is heterogeneous, each of the source papers have demonstrated that their samples are statistically representative of the local QSO host galaxy populations. Moreover, the selection criteria employed by the source papers are remarkably similar with significant overlap. The D03 and Floyd et al. (2004) (hereafter F04) samples are sub-samples from McLure et al. (1999) at 0.1 z 0.35, while the sample from Hamilton includes nearly all of the D03 sources, selected so that 0.06 z 0.4. The total integration times of all of the QSO observations were checked with the latest version of the WFPC2 exposure time calculator to ensure they were sufficiently deep to properly sample the underlying host galaxy. The basic information for the comparison sample of RLQs and RQQs are listed in Columns 1-6 of Table B1 in Appendix B.
III. Observations and Data Reduction
III.1. Optical F814W Images
The optical F814W filter was selected because the same filter was used
for the I-band study in Paper I. That paper demonstrated that the F814W
filter is the best compromise between observing the old stellar population, which is used
to probe the total MDyn, and avoiding light produced by RSG and AGB stars.
Here, and in Paper I the F814W filter is simply referred to as I-band. The
the mean differences among the ACS F814W, the WFPC2 F814W, and the Cousins
I-band filters are less than a few hundredths of a magnitude.
F814W images of 6 ULIRGs were obtained from the public
HST archives (see Table 2 for more information).
Five of the ULIRGs were observed with ACS/WFC as part of the Great Observatories
All-Sky LIRG Survey (Armus et al. 2009). ACS/WFC is comprised of two
40962048 pixel CCDs, each with a platescale of 0″.049 pixel-1,
providing a field of view (FOV) 202″ 202″. This FOV is large
enough to observe each of the 5 ULIRGs completely. There is a gap of 50 pixels
(2″.45) between the two CCDs. The observations employed a two position dither
to fill the chip gap rather than the more common CR-SPLIT (two images taken at the
same position) which is better for cosmic ray (CR) removal but leaves the gap with no data.
As in Paper I, the ACS/WFC data were processed manually using the Image Reduction and
Analysis Facility 22
2
IRAF is distributed by the National Optical Astronomy
Observatory, which is operated by the Association of Universities for Research in
Astronomy, Inc., under cooperative agreement with the National Science Foundation.
(IRAF) and The Space Telescope Science Data Analysis System (STSDAS), which is a software
package designed specifically for the reduction and analysis of HST data that works with
IRAF. Individual exposures which have been calibrated and flat field corrected
were obtained from the archives for the 5 ULIRGs observed with ACS/WFC. For each ULIRG,
the STSDAS task MULTIDRIZZLE was used to assemble individual dithered frames into a
final mosaic image corrected for: geometric distortions and CRs; bad pixels set to a
value of zero; and rotated to a position angle (P.A.) of 0∘. This
differs from the final drizzled image produced by the archive pipeline. Three bad pixels
were found in the center of IRAS 05189-2524 due to CR hits and warm pixels, and not due
to saturation from over-exposure. The IRAF pixel editing task IMEDIT was used to
replace the zeroed pixels with the values interpolated from the surrounding pixels. The
central region of IRAS 12540+5708 was found to be saturated. Both the diffraction spike
generated from the bright core and a 1214 pixel rectangle in the center of
IRAS 12540+5708 were saturated. These were flagged by MULTIDRIZZLE and set to a
value of zero. No images with shorter exposures were available to replace the flagged
pixels and they were ignored in the subsequent analysis. Due to the two position
dithering scheme used, MULTIDRIZZLE was unable to flag and remove a large number
of CRs, particularly within the chip gap. Because the targets were centered in the
ACS/WFC FOV, the chip gap runs through or close to the outer regions of the ULIRGs.
As a result an algorithm was developed to remove CRs and is detailed in Appendix D.
One ULIRG, IRAS F02021-2103, was observed with WFPC2,
which is comprised of four 800800 pixel CCDs. Three of the chips
(WF2, WF3, and WF4) have a platescale of 0″.099 and the fourth (PC)
0″.046. This creates a non-symmetric FOV with a gap in coverage in the upper
right quadrant.
The observations for IRAS F02021-2103 were centered on the WF3 chip.
The observations were reduced using calibrated and flat field corrected WFPC2 science images
obtained from the HST archives and processed with the STSDAS tasks WARMPIX,
which fixes hot pixels, and CRREJ, which removes CRs and combines multiple frames
into a single image. Geometric distortions were corrected by multiplying the
CR cleaned image with a correction image (Holtzman et al. 1995). Finally, the image
was trimmed to remove pixels vignetted by the pyramid shaped beam-splitter mirror.
III.2. Near-Infrared F160W Images
The F160W filter was selected because no similarly deep K-band
data were available (as used in Paper I) and because the CO band-heads at 1.6
were used for many objects to measure ∘,CO.
Published or archival data were used only for the 5 ULIRGs with published
values of ∘,CO. All observations used NICMOS with the NIC2 camera, a
256256 pixel HgCdTe array with 0″.075 pixel-1 platescale
(19″.2 FOV). Photometric data for 3/5 ULIRGs were obtained from the literature.
IRAS 17208-0014 and IRAS 23365+3604 were analyzed from HST archival data.
The NIC2 data were processed manually using IRAF and STSDAS.
The raw (data received directly from the spacecraft without processing) files
were used rather than the archive processed data
in order to properly account for: 1) the presence of the NIC2
coronagraph; 2) the presence of bias jumps between the quadrants; and 3) the presence
of electronic “bars” which appear as vertical stripes. The coronagraph shifts position
over time and the anomalies vary with time requiring the individual raw frames to be
processed manually. First, the STSDAS task CALNICA was used to subtract dark
current, correct for detector non-linearity, flatfield, convert to count rates, and
identify and reject CRs. Next, the STSDAS task PEDSUB was used to
correct for bias jumps between quadrants. This differs from the standard archival
pipeline reduction which uses PEDSKY to remove both bias jumps and sky background.
Because the objects fill most of the NIC2 array, using PEDSKY will result in
a non-uniform over-subtraction of the background. In cases where electronic bars and
other anomalies were found in individual raw frames, the STSDAS task NICPIPE was
used instead. It allows the user to apply some or all of the
steps from CALNICA. In this case, all steps except flat-fielding, conversion to
count-rates, and CR rejection were applied to the data. Next the data were
processed with BIASEQ, which corrects for drift in the bias levels during
the course of MultiAccum exposures. The data were then processed through NICPIPE
again, this time applying flatfields, conversion to count-rates and cosmic-ray
rejection. The position of the coronagraph was determined in each individual frame
and masked using the IRAF task IMEDIT. Other bad columns and hot
pixels not removed with CALNICA or NICPIPE were manually identified and
masked with the IRAF task IMEDIT. The frames were then processed with
MULTIDRIZZLE in the same manner as the ACS/WFC F814W data above, producing
geometrically corrected images rotated to a P.A. of 0∘.
A comparison between this method and data pre-processed through the standard
archive pipeline showed a significant improvement in signal to noise (S/N),
including the detection of faint tidal features which would otherwise not be visible.
III.3. Spectroscopy
The optical spectra for all of the ULIRGs presented here were obtained with the
Echellete Spectrograph and Imager (Sheinis et al. 2002, ESI) in echelle mode at the
W.M. Keck II 10m observatory. Echelle mode employs a 20″ long slit and
cross-dispersed spectra with simultaneous coverage of 0.3927-1.1068 projected
onto a 20484096 pixel CCD. ESI has a fixed spectral resolution of
11.5 km s-1 pixel-1. The final spectral resolution scales with slit width.
A 1″.0 slit width (6.49 pixels) was used for 7/8 ULIRGs. This corresponds to
R 4000 or 75 km s-1. A 0″.5 slit width (3.24 pixels)
was used for IRAS 12540+5708. This corresponds to R 8300 or
37 km s-1. In this paper only spectral orders containing the CaT stellar
absorption lines (order 6 or 7 depending on redshift) were used. The scale along the
spatial axis for order 6 and 7 are 0″.168 and 0″.163, respectively.
The integration time and P.A. for each ULIRG is listed in Table 2.
Calibrations, including internal flats and Hg-Ne, Xe, and CuAr arcs were taken at the
beginning and end of the night. No changes were detected between
flats and arcs taken at the start and end of night. ESI spectra for three ULIRGs
(IRAS 05189-2524, IRAS F10378+1108, and IRAS 11387+4116) were first presented in
Rupke et al. (2002) but did not include CaT measurements.
The data were reduced with IRAF. The reduction of the data and spectral
extraction method used are nearly the same as those described in Section 3.1 of Paper I
(e.g. correction to heliocentric rest velocities, spectrophotometric correction to remove
instrumental signature and provide approximate flux calibration, continuum normalization,
and generation of the error spectrum). The few differences with the methodology used in
Paper I are described here. Due to the redshifts of the ULIRGs the CaT lines lie at
wavelengths within a spectral region dominated by strong night-sky emission lines.
This was corrected using the IRAF task BACKGROUND which measures a sky spectrum
at both edges of the slit and fits it with a polynomial (in this case a 1st or 2nd order
Chebyshev polynomial) which is then subtracted from the spectrum. The polynomial
fitting and subtraction is carried out column by column. In one case, the
redshift of IRAS F02021-2103 placed the CaT absorption lines coincident with some
tellluric absorption lines. The IRAF task TELLURIC was used to correct for the
presence of the telluric absorption lines using a featureless spectrophotometric
standard star.
The spectra of 5/8 ULIRGs were extracted in a metric aperture of diameter
1.53 kpc (see Table 3). This size was selected to remain consistent with the literature
(e.g. Jorgensen et al. 1995; Smith et al. 1995; Pahre et al. 1998a; Pahre 1999; Rothberg & Joseph 2006a; Rothberg & Joseph 2006b, hereafter RJ06b, and Paper I.)
However, in order to maximize S/N, larger diameter
apertures of size 3.77 kpc and 4.05 kpc were used to extract the spectra of
IRAS F10378+1108 and IRAS 11387+4116, respectively. Due to the brightness of the
IRAS 12540+5708 nucleus, the spectrum was extracted in a 0.82 kpc diameter aperture
2.08 kpc northwest of the nucleus. This is several times
larger than the seeing of the observations, well within the region dominated by
stellar continuum (Davies et al. 2004), and the same method used by
Tacconi et al. (2002); Dasyra et al. (2006) to measure ∘,CO.
Finally, the IRAF task CONTINUUM was used to identify
and remove residual sky lines present from imperfect background subtraction in
IRAS 17208-0014, IRAS 19542+1110, and IRAS 23365+3604.
IV. Data Analysis
IV.1. Photometry
IV.1.1 Galactic Reddening
Photometry for all ULIRGs (HST and SDSS), comparison ellipticals and QSO host galaxies have been corrected for Galactic reddening using E values from Schlegel et al. (1998) as presented in NED33 3 The NASA/IPAC Extragalactic Database (NED) is operated by the Jet Propulsion Laboratory, California Institute of Technology, under contract with the National Aeronautics and Space Administration. and assume RV 3.1 (Fitzpatrick 1999). These values were then scaled to the appropriate photometric filters: F814W and z for the ULIRGs; and the native filters listed in Table B1 for the QSO host galaxies using values from (Schlafly & Finkbeiner 2011). Scaling factors for the F675W and F791W filters were computed using the York Extinction Solver (McCall 2004). The values used are listed in Tables 3, 4, and B1.
IV.1.2 Measured Global Photometric Parameters
Photometry was performed on the F814W images from ACS/WFC and WFPC2/WF3
and the F160W images from NIC2 to measure the global photometric parameters:
the effective (or half-light) radius Reff measured in metric units of kpc,
the mean surface brightness within the effective radius (eff),
and the total absolute magnitude (MI or MF160W).
The fluxes were measured in circular isophotes with fixed centers using the STSDAS task
ELLIPSE. The position of the galaxy centers in the F814W images were
determined from F160W NIC2 images. As in Paper I,
there were several cases where the nucleus was clearly visible in the F160W
images but obscured or partially obscured in the F814W images.
Foreground stars, bad pixels, artifacts or CRs missed by MULTIDRIZZLE were
masked with a bad pixel mask created using the technique described in Appendix D.
Masked items were set to a value of zero and ignored in the isophote fitting and flux
measurements. An r1/4 de Vaucouleurs profile
was fit to the isophotes produced by ELLIPSE for each galaxy. These
surface brightness profiles are plotted in Figure 2 of Appendix C. The angular effective
radius (in arcseconds) from the de Vaucouleurs profile was converted to Reff
using the angular diameter and co-moving distance for our preferred cosmology.
The values of eff were derived from the r1/4 profile
fits and were corrected for cosmological dimming (Tolman 1930).
The total MI or MF160W were computed by
extrapolating the best-fit de Vaucouleurs model beyond the measured data and using
the luminosity distance for our preferred cosmology.
Table 3 lists the MI, Reff and
Ieff values for the ULIRGs in the F814W filter.
Table 4 lists the measured values of Reff at F160W and
MF160W for IRAS 17208-0014 and IRAS 23365+3604.
F160W photometric results for IRAS F02021-2103, IRAS 05189-2524, and IRAS 12540+5708,
in Table 4 were obtained from Veilleux et al. (2006).
For each of these ULIRGs, the sources were checked to ensure that an
r1/4 profile was the better fit to the surface brightness profile.
The values of F160W Reff were converted to equivalent radii,
which is the equivalent circular radius for measurements originally made with elliptical
isophotes. The equivalent radii were computed using the semi-major and semi-minor axes,
or the semi-major axis and ellipticity (Milvang-Jensen & Jørgensen 1999, e.g.).
IV.1.3 Global Photometric Parameters of ULIRGs and Elliptical Galaxies from the SDSS
No data reduction was performed on the actual SDSS DR7 images.
Photometric data for IRAS F10378+1108 and IRAS 11387+4116 were
extracted from the SDSS DR7. The Sloan z-band filter was selected over
the Sloan i-band filter based on two factors:
1) At the redshifts of IRAS F10378+1108 and IRAS 11387+4116 the Sloan z
filter overlaps the rest-frame wavelength coverage of the F814W filter;
2) Because the wavelength coverage of the Sloan i-filter is bluer than
the Cousins I and F814W filters, at these redshifts flux from strong emission
lines of [OI], H, [NII], and [SII] could contribute significantly to the total
observed flux for each galaxy. At the same time, the observed wavelength
coverage of the z-band filter is now blue-ward of possible contamination from
[SIII] at 0.9069 and 0.9531 .
The metric equivalent radius for Reff was computed from the SDSS
parameters devRad, the half-light semi-major radius measured from a de Vaucouleurs
fit to the galaxy light; and devAB, the axis ratio from the de Vaucouleurs best
fit profile. Criteria 7 in Appendix A, that a galaxy is better represented by
a de Vaucouleurs profile rather than an exponential profile, was verified for the two
ULIRGs. Values of zeff were computed from
the SDSS parameters devMag, the total apparent magnitude measured
from the de Vaucouleurs fit to the galaxy light convolved with a double-Gaussian fit
to the PSF; and the angular equivalent radius reff
(e.g. equation 7 in Hyde & Bernardi 2009b, hereafter HB09) and includes corrections
for cosmological dimming. Mz was also computed from devMag using the
luminosity distance for our preferred cosmology.
The devMag fluxes were converted from AB magnitudes to VEGA magnitudes
using the task CALCPHOT which is a part of the SYNPHOT (synthetic photometry)
program in STSDAS
(Horne 1988; Koornneef et al. 1986; Laidler et al. 2005).
CALCPHOT calculates synthetic photometry for any input spectra or blackbody curves
using any filter transmission curve. It can be used to calculate k-corrections and
transformations between filters. A transformation value of
-0.51 was used. Due to large variations in
the rest-frame ultraviolet and optical spectral energy distributions (SEDs) the
k-corrections for ULIRGs at z 0.1 can vary by
0.01-0.09 mags (Surace et al. 1998; Trentham et al. 1999, e.g.).
Therefore, no k-corrections were applied to the two ULIRGs. Although the same
spectral regions are covered by the redshifted SDSS z filter and
the rest-frame F814W filter, the shape of the filter transmission curves for the two
filters are very different. To assess the impact of this, we tested CALCPHOT with
12 spectral templates: an elliptical, S0, Sa, and Sb galaxies (Kinney et al. 1996);
six different starburst galaxies with variations in the amount of extinction
(Calzetti et al. 1994), including extinction similar to those observed in ULIRGs;
and a composite spectrum of the Seyfert 2 NGC 1068, which includes ultraviolet and
optical lines, nebular and power-law continuum and cool stars
(Laidler et al. 2005). CALCPHOT yielded
0.19 0.01 and 0.18 0.01 for IRAS F10378+1108 and
IRAS 11387+4116, respectively. The small dispersion among the different templates is due
to the similarity of the spectral features within the rest-frame F814W wavelength
range. These additional transforms were also applied to the values of devMag.
For the remainder of the paper the observed Sloan z values for IRAS F10378+1108
and IRAS 11387+4116 will be referred to as I-band. Table 3 lists the
computed MI, Reff and Ieff
values for IRAS F10378+1108 and IRAS 11387+4116.
Global photometric parameters for the SDSS ellipticals were
computed in a similar fashion using the SDSS DR7 i-band values for devMag,
devRad, devAB, redshift, and extinction values.
k-corrections and a filter transformation from SDSS i-band to
F814W filter were computed using CALCPHOT and an elliptical galaxy template
spectrum (Kinney et al. 1996). The k-corrections ranged from 0.03-0.16 mags
with a filter transform of -0.59.
Due to the large size of the SDSS elliptical sample, the computed photometry is not
presented in the paper, but the selection criteria is provided in Appendix A and can be
used to retrieve the sample from the SDSS DR7.
IV.1.4 RLQ & RQQ Host Galaxies
The details of the data reduction methods used for these galaxies can be found in
Bahcall et al. (1997); Hamilton et al. (2002); Dunlop et al. (2003); Floyd et al. (2004); Hamilton et al. (2008).
The samples published in these papers were observed with WFPC2 on HST using the
F606W, F675W, F702W, F791W, or F814W filters. The source
papers provide surface brightnesses at the effective radius (eff), not
surface brightness within the effective radius (Ieff),
and absolute and apparent magnitudes of each host galaxy and nucleus or PSF.
In the source papers, these values were transformed from their
observed filters to either rest-frame Johnsons V or Cousins R-band magnitudes.
To avoid adding additional uncertainties to the analysis, only the apparent magnitudes of the
host galaxies in the original HST filters were used. They were k-corrected
and transformed to rest-frame F814W magnitudes using CALCPHOT with an
elliptical galaxy template (Kinney et al. 1996). An elliptical template was
selected because all of the QSO host galaxies have confirmed elliptical galaxy morphologies
and observations of the host galaxy spectra for nearly half of the sample indicate they
are dominated by the presence of an older, quiescent stellar population at optical
wavelengths
(Hughes et al. 2000; Canalizo & Stockton 2000; Nolan et al. 2001; Letawe et al. 2007; Wold et al. 2010).
With the exception of Bahcall et al. (1997) the published values of
Reff for the QSO host galaxies were measured from elliptical isophotes.
These were transformed to equivalent radii using ellipticities or semi-major and minor
axes from the source papers and Hamilton (private communication) and converted
to metric values of Reff using our preferred cosmology. These, along
with the transformed F814W apparent magnitudes were used to compute
Ieff in the same way as for the SDSS galaxies.
MI, Reff and Ieff are listed
in Columns 8-10 of Table B1.
IV.2. Velocity Dispersions
IV.2.1 Measurement of ∘
The details of the method used to measure ∘ from the extracted one-dimensional ESI spectra are given in RJ06a, RJ06b and Paper I. The IDL routine VELOCDISP described in those papers and used here is based on a pixel-space direct fitting method to measure ∘. This method is similar to the technique described in Rix & White (1992). Briefly, the template stars are convolved with a Gauss-Hermite Polynomial, which is a modified Gaussian (van der Marel & Franx 1993). The 18 template stars used for the fitting range from G1 to M7.5 giants to K1 to M5 supergiants (see Table 4 in Paper I) and are the same stars used in Paper I for the CaT and 2.3 CO spectra. The fitting function has five parameters: the line strength (), which measures the ratio of the equivalent width of the galaxy to that of the template star; the mean recession velocity (∘), the central velocity dispersion (∘, defined as in a 1.53 kpc metric aperture), the skewness (h3), and kurtosis (h4). The last two parameters characterize the departures from a Gaussian shape. The parameters are simultaneously fit to the data over the wavelength range 0.8480-0.8690 (Barth et al. 2002). Bad pixel masks were used to mask out strong emission lines or regions of imperfect background subtraction. Table 3 shows the best-fit results for the derived ∘, heliocentric recessional velocity (V⊙) and best-fit template star for each ULIRG. The errors in Tables 4 were calculated by VELOCDISP using the error spectrum for each galaxy. A more detailed discussion of this method of error analysis and a comparison with Monte Carlo simulations can be found in RJ06a, RJ06b, and Paper I. Figure 3 in Appendix C shows the CaT spectra for the eight ULIRGs (solid line), over-plotted with the best-fit convolved stellar template (gray dashed line).
IV.2.2 Aperture Corrections
In order to reduce possible errors introduced by measuring kinematic properties in different aperture sizes, the values of ∘ reported in this paper are either initially measured in a common aperture diameter of 1.53 kpc or corrected to this aperture size (see Tables 3, 4, and B2). This also applies to all published velocity dispersions, including the QSO host galaxies, SDSS ellipticals, and the CO velocity dispersions of ULIRGs. The corrections used the scaling relation from Jorgensen et al. (1995):
| (1) |
where = -0.0444 4 RF10 has a typographical error that reads 0.04 instead of -0.04, d∘ 1.53 kpc and d is the metric diameter of the circular aperture. This is directly applicable to the SDSS ellipticals measured in a 3″ diameter circular fiber. In the case of slit spectroscopy for the QSOs and ULIRGs, d is computed via:
| (2) |
where x and y are slitwidth and extraction aperture, n is the metric scale (pc or kpc) in 1″ for the galaxy computed from the angular diameter. The weighted average radius along the summed portion of the slit for each QSO was taken from Table 3 in Wolf & Sheinis (2008) and the slitwidths for the CO observations of the ULIRGs from obtained from the relevant source papers (see Table 4).
V. Results
The results here first address whether the -Discrepancy extends to ULIRG luminosities, as suggested by Paper I. We then test the predictions of the S88 paradigm by using a combination of rest-frame I-band photometric data and ∘,CaT to assess whether the global dynamical properties of the ULIRGs are consistent with those of massive ellipticals, including the host galaxies of QSOs, and whether they exhibit the same significant differences between optical and near-IR properties.
V.1. Extending the -Discrepancy to ULIRGs
A key result from Paper I was a demonstration that in advanced LIRG mergers, ∘,CaT is systematically larger than ∘,CO. The same systematic discrepancy was not observed in bonafide elliptical galaxies (Vanderbeke et al. 2011, Paper I,). Paper I further posited that the -Discrepancy should also extend to ULIRG luminosities. We now test this hypothesis by comparing the values of ∘,CaT with published values of ∘,CO. Figure 1 shows the five ULIRGs in the sample which have published values of ∘,CO (see Table 4) compared with their ∘,CaT presented in this paper (see Table 3). The dotted line represents ∘,CaT ∘,CO. Taking into account the errors, the ∘,CaT values plotted for the 5 ULIRGs lie 2.5-22.9 away from the expected ∘,CO values. The relative difference between ∘,CaT and ∘,CO for each galaxy was characterized in Paper I by the parameter Frac:
| (3) |
This parameter was then compared with Log LIR
(Figure 4 in Paper I) for both advanced mergers and bonafide elliptical galaxies.
LIR seems a natural starting point for comparison, given that the
degree of the -Discrepancy appears to be greater for LIRGs than non-LIRGs,
and non-existent in the control sample of ellipticals (Figure 1 of Paper I).
The comparison between Frac and Log LIR was quantified
using the Pearson Correlation coefficient (r) which tests the degree of
linear correlation between two independent data sets. The value of r ranges from
-1 to +1 (anti-correlation to perfect positive correlation). In
Paper I, a comparison was made for the entire sample of advanced merger remnants
(9.51 Log LIR 11.96),
yielding a value of r 0.77 (a strong correlation). The comparison sample of
ellipticals in Paper I showed no correlation (r 0.06).
In order to determine whether this correlation extends to ULIRG luminosities
plotted in Figure 2 are Frac and Log LIR values for
the 5 ULIRGs from this paper and all advanced mergers from Paper I. The correlation
in Figure 2 is r 0.75±0.02.
The errors on this correlation were computed using a “jackknife” resampling method
(Tukey 1958) in which the computation of the Pearson Correlation for
the sample of n pairs of data points is done using n - 1 pairs of data points.
This allows for n computations of the Pearson Correlation to be made and a standard
deviation to be computed to test the robustness of the correlation
(i.e. that one point may drive an apparent correlation).
The algorithm FITEXY was applied to the galaxies in Figure 2. It employs a
double-weighted least-squares (DWLSQ) fit using a 2 minimization method
that accounts for errors in both variables (Press et al. 1992; Feigelson & Babu 1992).
The result is:
| (4) |
This is similar to Equation 7 in Paper I55 5 Equation 7 in Paper I was computed using a least-squares fit with errors in Y array. We have recomputed the fit using FITEXY, which produces Frac 0.18±0.01 Log LIR - 1.78±0.12. The Log LIR-Frac correlation first shown in Paper I extends to ULIRG luminosities, i.e. the relative difference between ∘,CaT and ∘,CO grows with larger LIR.
V.2. The Dynamical Properties of ULIRGs
V.2.1 The Fundamental Plane
Figure 3 shows the I-band Fundamental Plane edge on
(diagonal solid solid line). It is a two-dimensional plane embedded within the
three-dimensional parameter space of ∘, Reff, and
eff (Djorgovski & Davis 1987). Early-type galaxies lie on the FP,
late-type galaxies do not. A relationship similar to the FP can be derived from the
Virial Theorem (Faber et al. 1987; Djorgovski et al. 1988; Bender et al. 1992, e.g.).
The FP can be used as a diagnostic tool to probe whether the dynamical properties of a
particular galaxy, or group of galaxies are similar to those of elliptical
galaxies. In this section the two fundamental goals are: 1) to ascertain whether the
advanced ULIRGs lie on or close to the FP; and 2) to compare where the ULIRGs lie
relative to the QSO host galaxies.
The FP plotted in Figure 3 is from the orthogonal fit in Table 2 of HB09 and
was derived from 50,000 early-type galaxies (z 0.36) using photometry from
SDSS Data Release 4 and values of from SDSS Data Release 6
(see Hyde & Bernardi 2009a, for more details). As noted in Appendix A, we used the
same parameters as HB09 to select the comparison sample
of ellipticals but with tighter restrictions on morphology in order to select only
ellipticals and exclude S0 galaxies. Thus, it is a sub-sample of HB09.
The Sloan i-band was transformed to H∘ 75 and to
the HST ACS/WFC F814W filter using the same method described in Section IV.1.3.
In Figure 3, and subsequently for all comparisons, ULIRGs are plotted as filled circles,
RQQs as open flattened diamonds, RLQs as open squares, and the SDSS ellipticals are
plotted in four groups based on their values of ∘ (see Figure 3 caption).
The first group roughly corresponds to sub-m∗ ellipticals, the second to
m∗ ellipticals and the last two to progressively more massive systems.
This adds an additional dimension of information to these plots; and in the case of
Figure 3 separates the two parameters which comprise the x-axis, revealing a gradient
of increasing ∘ from left to right across the FP. This gradient
reflects a previously reported steepening of the slope of the FP as a function of
∘ (e.g. Jorgensen et al. 1996; Bernardi et al. 2003a, HB09). Also
of note is an apparent thickening and slight warp or curvature of the FP at small
Reff and low ∘ which is not due solely to observational
errors (Jorgensen et al. 1996; Bernardi et al. 2003a; Nigoche-Netro et al. 2009, HB09).
To determine if ULIRGs lie on or close to the FP, the scatter of the
residuals or r.m.s. of the ULIRG sample relative to the FP is compared with those
of the SDSS Ellipticals. By definition, these ellipticals lie on
the FP because they are a sub-sample of the early-type galaxies used to construct the FP
itself. The SDSS ellipticals have r.m.s. 0.18 dex (in units of kpc), while the
ULIRGs have r.m.s. 0.29 dex. The residuals of the ULIRGs range from -0.72
to 0.30 (the SDSS ellipticals range from -0.68 to 0.40), with a mean and median
of -0.05 and 0.04, respectively, indicating no systematic offsets for the sample.
In general, the ULIRGs lie well
within the scatter of the SDSS ellipticals, with four lying on the FP
(within their errors). We conclude that the ULIRGs lie on or close to
the FP like bonafide ellipticals. We note that IRAS 19542+1110 is 3.9 from
the FP, making it an outlier, although there are SDSS ellipticals which are similarly
distant from the plane.
Where do ULIRGs lie on the FP and how does
their location compare with those of gEs, including QSO host galaxies?
To quantify this, we used a variation of the Kolmogorov-Smirnov (KS) two-sided
(i.e. comparison between two empirical distributions) test which is applicable to
two-dimensional data sets
(Peacock 1983; Fasano & Franceschini 1987; Press et al. 1992).
The KS test itself probes the Null Hypothesis that the two
distributions to be compared have the same distribution. It is a non-parametric test,
meaning no assumption is made about the form of the distribution except that it
must be continuous (Massey 1951, e.g.). A standard rejection threshold
of 95 (also known as the 0.05 confidence level) was selected
(Fisher 1925; Fisher 1990) for the analysis.
If the Null Hypothesis can be rejected at a greater confidence it will be stated,
otherwise a statement of rejection or non-rejection will always refer to the 95 level.
The two-dimensional form of the KS two-sided test was designed to test the empirical
distribution of data points on a plane and provide a goodness-of-fit statistic without
the problems which arise from binning (i.e. 2 test) or assumption of a
particular shape to the distribution. The test statistics were computed using
the methods outlined in Press et al. (1992) which are in turn, based on
modifications to the KS statistic (Stephens 1970). These allow for
computation of the 2D statistic beyond the limited case examples provided
in Fasano & Franceschini (1987). We note two important caveats for the KS tests used
here and throughout the remainder of Sections V.2.1 and V.2.2.
First, the reported
errors for the RLQ values of ∘ listed in Table B2 are significantly
larger ( 17-34) than those of the RQQs, ULIRGs, or SDSS ellipticals. They are
also significantly larger than those of any other parameters examined in this paper.
Such large errors may affect the KS tests. A set of 10,000 Monte Carlo simulations
were performed in which a new value of ∘ was randomly generated from
within the range of ∘ ∘ for each RLQ.
The KS test was then re-run for each Monte Carlo simulation to check for changes
in the results66
6
The same Monte Carlo tests applied to the other parameters and
applied to the errors in ∘ for the ULIRGs and SDSS ellipticals yielded
no change in the KS 1D and 2D test results. As an aid to the reader, the results of all
KS tests (1D and 2D) are summarized in Appendix C in Table C1. The values in parentheses
in Table C1 show the percentage for which the results reamin the same in the simulations
compared to the actual test result. Second, although IRAS 19542+1110 is a 3.9
outlier on the FP, excluding it from the KS tests does not change the results presented
here and throughout Sections V.2.1 and V.2.2.
The Null Hypothesis cannot be rejected when the ULIRGs are compared with:
the 6 RLQs and all 8 of the QSO host galaxies (RLQs and RQQs). The Null Hypothesis
can be rejected when the ULIRGs are compared with the entire distribution of
the SDSS sample. When the comparison is restricted to the SDSS ellipticals in the two
largest bins, 165-225 km s-1 and 225-420 km s-1, the Null Hypothesis cannot be
rejected for either bin.
We now compare the velocity dispersions of the samples and defer comparisons for
Log Reff and I to Section V.2.4
where the RLQ and RQQ samples are significantly larger. A standard (1D) two-sided KS test
comparison was made for ∘ between the ULIRGs
and QSOs, and the ULIRGs and SDSS ellipticals. It should be noted that the methodology
for the standard two-sided KS test uses the tables for small samples or equations for
large samples originally published in Pearson & Hartley (1972) as well as the modified
KS test which is routinely used in programming language libraries and statistical
software (e.g. Fortran, C, C++, IDL, Python, R) for comparisons among samples of any
size without the need for comprehensive
tables (Stephens 1970; Press et al. 1992). If the two methods disagree,
it will be noted, otherwise it is assumed that both methods yield the same result.
The Null Hypothesis can be rejected when the distributions
of ∘ are compared for the ULIRGs and RLQs, but only 26 of the time.
The Null Hypothesis cannot be rejected when the ULIRGs are compared with all 8 QSO host
galaxies (6 RLQs + 2 RQQs). The Null hypothesis can be rejected (and at the 99 level)
when comparing the distributions of ∘ for the ULIRGs and the entire SDSS
comparison sample.
Figure 3 and the 2D KS tests show that at I-band ULIRGs lie on the FP
in a region where M m∗ ellipticals are found. This is in contrast
to pure near-IR studies which showed ULIRGs are systematically offset from the
FP in regions dominated by low to intermediate mass ellipticals
(M m∗) and therefore could not be the progenitors of QSO
host galaxies
(Shier & Fischer 1998; Genzel et al. 2001; Tacconi et al. 2002; Dasyra et al. 2006, e.g.).
The comparison with QSO host galaxies is less clear. The ∘ distribution
may not be consistent with that of RLQs. The uncertainty arises from the large errors
associated with values of ∘ for the RLQs. However, one cannot rule out
similarities between ULIRGs and the QSO host galaxy population as a whole.
V.2.2 Dynamical Masses & Stellar Populations at I-band
Paper I demonstrated that the observed dynamical properties of LIRGs are different at I-band and K-band, an effect not seen in elliptical galaxies. It showed that for a given LIRG, the presence of a central, relatively young population of RSG and/or AGB stars dominates the K-band light. As a result, MDyn measured at K-band is significantly smaller than MDyn measured at I-band. The apparent effective ages also typically younger at K-band (see Figure 9 in Paper I). At I-band, this population is largely obscured due to dust, permitting the kinematics of the older, more global population to dominate the observations. Figure 4 is similar to Figure 9 in Paper I. It shows MDyn vs M/L at I-band. The ULIRGs, RLQs, RQQs, and SDSS ellipticals are plotted in Figure 4 (same symbols as Figure 3). L represents the total luminosity and the masses shown are the total virial MDyn of each galaxy:
| (5) |
(Proveda 1958; Fish 1964; Rood et al. 1972; Tonry & Davis 1981; Binney 1982; Bacon et al. 1985; Richstone & Tremaine 1986; Mathews 1988; Bender et al. 1989)
where Reff is the effective radius from the de Vaucouleurs fit,
G is the gravitational constant, and 6 (which takes into account
the variations in shape, size, and inclination of spheroids; the impact of
rotation on ∘; and that varies with radius).
The values for MDyn are listed in Table 3 for the ULIRGs
and Table B2 for the QSO host galaxies. The vertical dotted line represents an
m∗ elliptical galaxy. Overlaid are two sets of models representing
the evolution of M/L for a single stellar population (SSP).
The pair of models on the left are from (Maraston 2005, hereafter M05).
The solid vector is an SSP with solar metallicity and a Kroupa initial mass function
(IMF). Changing from solar to either half or twice solar metallicity causes only a
slight shift ( 0.1 dex) up or down in M/L, respectively. The vector shown
in light grey parallel to the Kroupa vector is an SSP with solar metallicity and a
Salpeter IMF. On the right are updated SSP models from
(Bruzual & Charlot 2003, the models are hereafter referred to as CB07).
The solid vector is an SSP with solar metallicity and Chabrier IMF and the light grey
vector parallel to it is an SSP with solar metallicity and Salpeter IMF. Using sub-solar
(0.4 Z⊙) or more than solar (1.5 Z⊙) metallicity decreases or increases
the M/L values by no more than 0.15 dex. The M05 and CB07 models generally
agree with each other at I-band, although the latter shows more variation/degeneracy
in M/L at t 1-1.2 Gyr, while M05 shows some variation/degeneracy
at 0.2-0.4 Gyr. These are likely related to differences in their treatment of thermally
pulsing asymptotic giant branch (TP-AGB) stars
(Maraston et al. 2006; Bruzual 2007; Bruzual 2010, e.g. see M05,).
Such differences have a more pronounced impact on the analysis of the stellar populations
of (U)LIRGs at near-IR wavelengths
(e.g. Rothberg 2009; Rothberg & Fischer 2010a, and Paper I)
The horizontal placement of both vectors are for display purposes only.
Figure 4 demonstrates that at I-band, all of the ULIRGs have
MDyn m∗. With the exception of IRAS 19542+1110,
the ULIRGs lie at the upper end of the mass distribution. As noted earlier, ULIRGs are
known to contain massive quantities of H2 and have prodigious
star-formation rates. Various methods for estimating the SFR
(Kennicutt 1998; Yun et al. 2001, e.g.) indicate the 8 ULIRGs
plotted in Figure 4 have SFRs 100-500 M⊙ yr-1.
Yet, when the M/LI values are compared with the SSPs, the stellar
populations appear to be old and evolved for 7/8 ULIRGs. A 2D KS test comparison of the
distribution of the ULIRGs with the galaxies in the I-band
MDyn-M/L plane indicates that the Null Hypothesis
can be rejected when the ULIRGs are compared with the QSO host galaxies
(either the RLQs alone or all 8 QSOs). However, the large RLQ ∘ errors
weaken this result significantly, especially when the entire QSO sample is considered
(see Table C1 for details). In addition, the Null Hypothesis can be rejected
for the entire comparison sample of SDSS ellipticals, although the Null Hypothesis
cannot be rejected when the ULIRGs are compared with the SDSS ellipticals in the
165-225 km s-1 and 225-420 km s-1 bins. .
It should be noted that Figure 4 presents a simplistic approximation by assuming
a single burst population is representative of the entire galaxy, i.e. all stars are
of the same age. Moreover, the M/LI models shown in Figure 4 are
for stellar masses only, whereas the plotted data are dynamical masses. Although SSP
models may be an adequate approximation for a typical quiescent elliptical galaxy, the
models do not take into account the presence of non-stellar matter (e.g. gas, dust, etc),
nor multiple stellar populations (such as a younger population unseen at I-band,
as we posit for LIRGs and ULIRGs). Both the additional ISM mass and the effects of
extinction of the I-band flux from dust will increase the plotted values of
M/L. Thus, the dynamical M/L is almost always
greater than M/L derived from stellar population models, and in the case of
younger galaxies, the inclusion of two populations brings the models more in line with
the data (Gerhard et al. 2001; Cappellari et al. 2006; de Jong & Bell 2007, e.g.).
However, the main point we make here is that at I-band the ULIRGs appear closer in
mass and age to older gEs (with masses well above m∗) in contrast to
results obtained for the same ULIRGs at near-IR wavelengths. We do not attempt to derive
absolute stellar population ages for the ULIRGs using a single bandpass, we simply
point out that the comparisons in Figure 4 appear to indicate little or no evidence for
the presence of young stars at I-band, even though they are clearly present
at other wavelengths.
Separating the two parameters in Figure 4, we now focus exclusively on
MDyn using a standard two-sided KS test. First, for the QSOs, the Null
Hypothesis can be rejected (and at the 99 level) when the MDyn
distributions of the ULIRGs are compared with the RLQs. Monte Carlo simulations show
little change, except at the 99 level. The Null Hypothesis cannot be rejected
when the MDyn distributions of the ULIRGs are compared with the entire
sample of QSO hosts. Next, the Null Hypothesis can be rejected (and at the 99 level)
when the ULIRGs are compared with the entire sample of SDSS ellipticals. The only
qualification is that the Null Hypothesis cannot be rejected for the largest
∘ bin. What these results show is that at I-band the ULIRGs are
consistent with gEs possibly including RQQ host galaxies. They may not be consistent with
RLQ host galaxies, but some doubts remain.
V.2.3 The Dynamical Masses & Stellar Populations of ULIRGs: Optical vs. Near-IR
As noted earlier, previous dynamical studies of ULIRGs carried out almost exclusively in the near-IR had concluded that for these systems MDyn m∗. Figure 5 demonstrates how the -Discrepancy in Section V.1 can account for the differences between the results in Sections V.2.1 and V.2.2 and earlier near-IR only studies. This figure presents a relative comparison of where ULIRGs lie in the MDyn-M/L plane at I-band (top) and at F160W ( H-band, bottom). Only the ULIRGs which have kinematic and photometric observations at both wavelengths are shown. The ULIRGs are represented by letters in Figure 5, each letter corresponding to a specific galaxy (see the caption for Figure 5 and Table 4). The two plots share the x-axis (MDyn) in order to enable a direct comparison of the mass computed at both wavelengths. The F160W photometry and kinematic data from the near-IR CO band-heads are presented in Table 4. As in Figure 4, SSP models from M05 are shown with Kroupa (solid vector) and Salpeter (light grey) solar metallicity IMFs on the left and CB07 for a Chabrier (solid) and Salpeter (light grey) IMFs on the right. The SSP vectors plotted in the F160W panel were transformed from the original M05 Johnson H-band values to F160W using colors computed by processing the grid of M05 SEDs at each age with SYNPHOT. At F160W, the discrepancy between the M05 and CB07 models are more pronounced than at I-band, particularly for the M05 Kroupa IMF and the CB07 Chabrier and Salpeter IMFs. The relative ages appear to be offset by 0.5 dex between the M05 and CB07. However, regardless of the specific age, ULIRGs clearly appear to be older and more massive at I-band than at F160W. As first noted in Paper I, this effect is not seen in elliptical galaxies because they do not have a young stellar population that dominates observations in any wavelength.
V.2.4 The Kormendy Relation
The analysis presented above is limited by the number of QSO host galaxies
with ∘ measurements, particularly RQQs. The
eff-Log Reff plane (also known as the
Kormendy Relation) is a photometric projection of the FP for early-type
systems (Kormendy 1977; Kormendy 1982, e.g.), and, like the FP,
is independent of galaxy environment
(Pahre et al. 1998b; Reda et al. 2004; Nigoche-Netro et al. 2007, e.g.,).
Although the Kormendy Relation (KR) has significantly more scatter than the FP,
it is often used as a “cost-effective” proxy because the stellar absorption line
spectroscopy needed to measure ∘ can be time-consuming and/or difficult
to obtain. This is especially true for QSOs because observations must contend with the
effects of the bright nucleus which can swamp the underlying host galaxy. Until recently,
nearly all studies investigating the dynamical properties of QSO host galaxies and their
relationship to ellipticals, spirals, and mergers have relied solely on photometric
observations. Here, the KR is used to increase the number of QSO host galaxies for
comparison from 6 to 28 RLQs, and from 2 to 25 RQQs. The main goals of this section are:
1) to ascertain the positions of advanced ULIRGs with respect to the KR; and 2) to
determine where the ULIRGs lie relative to the elliptical QSO host galaxies.
Figure 6a (left) shows the I-band KR (solid line) derived from the
entire comparison sample of SDSS ellipticals using the DWLSQ fitting method described
earlier. The derived I-band KR is:
| (6) |
with r.m.s. 0.39 dex (in units of mag arcsec-1) and a
Pearson Correlation Coefficient of r 0.71. This is similar to the fit from
Nigoche-Netro et al. (2008) for 8,664 early type galaxies at SDSS i-band
(z 0.36). Their slope and intercept is 2.52±0.01 and 17.84±0.01,
respectively (transformed to F814W, the intercept is 17.25), with
r.m.s. 0.42 dex and a Pearson Correlation Coefficient
of r 0.72.
The ULIRGs, RLQs, RQQs, and SDSS ellipticals are plotted in the left panel
of Figure 6a (same symbols as Figure 3). The diagonal dotted shows the locus of an
L∗ galaxy (Blanton et al. 2003; Bell et al. 2003; Hill et al. 2010).
Also shown are the 1, 2, and 3 dispersions of the KR (dotted grey lines).
As in Figure 3, the SDSS ellipticals follow a gradient in their distribution when grouped
by ∘. The SDSS ellipticals with the largest ∘ lie almost
exclusively above the KR and the ones with the smallest ∘ lie almost
exclusively below it. In addition to fitting a KR to the entire SDSS comparison sample,
fits have been made for each of the SDSS sub-samples (binned by ∘) as
well as the ULIRGs and QSO host galaxies. The number of objects in each sample, the
coefficients of the fit, r.m.s. and Pearson Correlation Coefficient are provided
for each sample in Table 5. The slope of the KR does not vary significantly among the
first three ∘ bins, but does decrease significantly for the bin with
the highest ∘. This is somewhat different than the results from
Nigoche-Netro et al. (2008), which found that the slope of the KR changes significantly
as a function of luminosity when binned in 1 mag intervals and in intervals of increasing
luminosity.
The r.m.s. of the 8 ULIRGs is 1.01, within 2.5 of the KR. However,
IRAS 19542+1110 is a significant outlier from the I-band KR ( 6).
Excluding it, the r.m.s. of the ULIRGs decreases to 0.52 ( 1.3 from
the KR). Once again, a 2D KS test was used to compare the distribution of the ULIRGs
with all of the SDSS ellipticals. Here, the results do change when IRAS 19542+1110 is
included or excluded. When included, the Null Hypothesis cannot be rejected. When
it is excluded, the Null Hypothesis can be rejected at the 95 level. However,
when the ULIRGs are compared with the SDSS ellipticals in the 165-225 km s-1 and
225-420 km s-1 bins, then the Null Hypothesis cannot be rejected, whether or not
IRAS 19542+1110 is excluded. This implies that the ULIRGs are always consistent with
the most massive SDSS ellipticals, and the inclusion of IRAS 19542+1110 also makes
them consistent with a broader range of ellipticals.
When the ULIRGs are compared with the RLQs, RQQs, and the QSO host
galaxies taken together as one sample, the 2D KS test shows that in all cases the Null
Hypothesis cannot be rejected. Although the majority of ULIRGs and QSOs fall within
3 of the KR, they lie systematically above the relation.
The computed slopes and intercepts are listed in Table 5.
Figure 6b (right panel) shows the best-fit KRs for the ULIRGs, RLQs,
and RQQs from Table 5. The fits are plotted as shaded regions which account for the
1 errors in both slope and intercept.
The ULIRG and QSO fits have steeper slopes than the SDSS ellipticals
(including the sub-samples binned by ∘). The fits to the ULIRGs and
QSOs are consistent with each other. Figure 6b shows the considerable overlap in
KR parameter space among ULIRGs, RLQs, and RQQs. Similarly, Veilleux et al. (2009)
found at F160W that the slope of the KR fits to PSF-subtracted PG QSOs and
ULIRGs (in which the bulk of the star-formation should have been removed in the
PSF-subtraction), along with QSOs from D03 and Hamilton et al. (2008),
transformed assuming 2.8, were indistinguishable from each other,
but still significantly steeper than inactive ellipticals. The QSO results in Table 5
and Figure 6b
also match results from earlier attempts to place QSO host galaxies on the KR at optical
wavelengths (e.g. O’Dowd et al. 2002, D03,F04, see bottom of Table 5).
A standard two-sided KS comparison of each individual parameter in the KR
(eff and Log Reff) between the ULIRGs and the RLQs,
RQQs, and the two QSO samples together produces the same result in all cases: the
Null Hypothesis cannot be rejected. Given that the ULIRGs are now compared with much
larger samples of RLQs and RQQs, Figure 6 presents stronger support than the FP or
MDyn-M/L plane for the assertion that ULIRGs are consistent
with the host galaxies of QSOs, both as a single population, and when divided
into RLQs and RQQs.
Finally, since the RLQ and RQQ photometric samples are sufficiently large,
one can compare them with each other using both the 2D KS test and the 1D comparison for
each parameter in the KR. Here, the results are quite interesting because the Null
Hypothesis cannot be rejected for the 2D case nor can it be rejected for
eff. However, for Log Reff the comparison is less
clear. Using the modified KS test, the Null Hypothesis can be rejected at the 95
level, but using the standard KS formula for large samples it cannot be
rejected. Such a difference between the methods suggests one should err on the side
of caution in making any strong statements about whether the RLQs and RQQs are
significantly different in a statistical sense. Both D03 and F04 reached a similar
conclusion, noting that the mean Reff of RLQs and RQQs are the same
within the 1 errors. These results raise doubt about the intrinsic
differences between RLQs and RQQs. This reinforces the need for more kinematic
(∘) measurements for RLQs and RQQs.
VI. Discussion
The goal of this paper has been to use the first results of the I-band dynamical survey of advanced ULIRGs to address two key questions: 1) Does the -Discrepancy extend to the more luminous ULIRG population? and 2) At I-band are the dynamical properties of advanced ULIRGs consistent with gEs, including the host galaxies of QSOs? Here, we briefly discuss the implications for the results presented so far.
VI.1. The -Discrepancy
The -Discrepancy does appear to extend to ULIRGs such that ∘,CaT ∘,CO. Moreover, the results here agree with what was posited in Paper I, namely the correlation between Log LIR and the -Discrepancy, and in turn, the predicted range of ∘,CaT values for ULIRGs. Just as with the LIRGs in Paper I, the ULIRGs can be described as Janus-like. Like the Roman deity, they present two different faces depending on how they are viewed. At I-band the face of an old stellar population is observed, while at near-infrared wavelengths the face of a young stellar population dominates (see Figure 19 in Paper I). Since in Paper I, and in this work, we are observing only single nuclei mergers, the luminosity evolution of the disks in these systems may be nearly monotonic and decreasing. In this subclass of (U)LIRGs, the lower the LIR, the further along will be important processes such as feedback that clears out the star-forming ISM (Fischer et al. 2010; Feruglio et al. 2010; Sturm et al. 2011, e.g.) and the subsequent aging of the starburst. As the YCSD becomes fainter, its dominance in both photometric and kinematic measurements in the near-IR subsides, reducing the observed -Discrepancy. As the lack of this discrepancy in bonafide ellipticals demonstrates (Vanderbeke et al. 2011, Paper I,) at some point in the evolutionary sequence ∘,optical ∘,near-IR. Part of this explanation is an oversimplification because it assumes that every merger reaches a ULIRG stage and that LIRGs are stages before and after the luminosity peak. On the other hand, regardless of whether all LIRG mergers will be or at some point have been ULIRGs, lower LIR means a less luminous YCSD, and a less dusty nuclear region.
VI.2. The Evolution of ULIRGs into QSOs
The extension of the -Discrepancy to ULIRGs leads directly to the second
question; whether the structure and kinematics of ULIRGs are consistent with those of gEs,
including QSO host galaxies. We address this in two steps, beginning with a comparison
to elliptical galaxies in general. Previous results from near-IR stellar kinematics and
photometry
(Genzel et al. 2001; Tacconi et al. 2002; Davies et al. 2004; Colina et al. 2005; Dasyra et al. 2006, e.g.)
concluded ULIRGs were the progenitors of low-intermediate mass ellipticals
( m∗) based on two arguments. The first was simply that the
measured values of ∘ obtained from near-IR stellar lines were
significantly smaller than those of typical or giant ellipticals obtained from optical
stellar absorption lines (e.g. Ca H&K, Mg Ib, CaT). This was based on the
assumption that the near-IR stellar absorption lines or stellar band-heads
probe the global properties of the ULIRGs. The results presented here and in Paper I
imply this is not the case. The second is comparing the values of MDyn,
computed from the CO ∘ and near-IR photometry, with some fiducial stellar
mass representative of the stellar mass function of galaxies. The earlier studies above
all used m∗ 7.071010 h-2 M⊙
(or 1.251011 M⊙ for the cosmology used here) from
Cole et al. (2001).
In other words, because in the near-IR MDyn m∗, ULIRGs
cannot form gEs, let alone an average elliptical. They must be the
progenitors of low-intermediate mass ellipticals. However, the value of m∗
used for comparison is actually the larger of two possible values from
Cole et al. (2001). The other is
m∗ 3.431010 h-2 M⊙
(6.01010 M⊙ for the cosmology used here).
The larger value comes from using a Salpeter IMF which over-predicts the amount of
low-mass stars, rather than a Kennicutt or “diet” Salpeter IMF which compensates for
this effect (Bell et al. 2003; Bell & de Jong 2001, see Section 6.1 of).
A variety of methods have converged towards
m∗ 31010 M⊙
(the value used here) which also appears to be the transition region between the blue
cloud and red sequence and the threshold above which AGN activity is more likely to be found
(Bell & de Jong 2001; Bell et al. 2003; Kauffmann et al. 2003; Baldry et al. 2004; Bell et al. 2007; Baldry et al. 2008, e.g.).
In other words, the claim that (U)LIRGs form sub-m∗ ellipticals is partly
based on the selection of the larger of two possible m∗ values. In the bottom
panel of Figure 5 the ULIRGs straddle the m∗ line. This remains the same when
near-IR data for other advanced ULIRGs from
Genzel et al. (2001); Tacconi et al. (2002); Dasyra et al. (2006) are considered.
Instead, the real question raised by these earlier results is why the observed
∘,CO of ULIRGs and near-IR half-light radii were inconsistent with
observations at other wavelengths, including molecular gas masses, star-formation rates,
high-velocity outflows, etc. Similar to the results for non-IR luminous mergers and
LIRGs (e.g. RJ06a, Paper I), the kinematic and photometric properties of the ULIRGs
measured at I-band are now statistically consistent with m∗ and
larger ellipticals, including gEs.
QSOs and ULIRGs have a great number of similarities, including:
bolometric luminosities and space densities out at least z 0.4
(Soifer et al. 1986; Canalizo & Stockton 2001);
an overlap in the FIR-radio correlation
(Sanders & Mirabel 1996; Yun et al. 2001, e.g.); H2 masses
of 109-10 M⊙
(Sanders et al. 1989b; Chini et al. 1997; Evans et al. 2001; Scoville et al. 2003; Bertram et al. 2007; Evans 2009; Evans et al. 2009; Xia et al. 2012, e.g.);
post-starburst stellar populations in or near the nucleus along with
tidal tails and peculiar morphologies indicative of a relatively recent gas-rich merging event
(MacKenty & Stockton 1984; Heckman et al. 1986; Hutchings & Neff 1988; Hutchings & Neff 1992; Guyon et al. 2006; Canalizo et al. 2007; Bennert et al. 2008; Ramos Almeida et al. 2011; Tadhunter et al. 2011, e.g.);
and an overlap in the distribution of LIR
(12.24 0.44, 12.25 , and 12.17 0.16 for RLQs, RQQs, and ULIRGs,
respectively), in which the Null Hypothesis cannot be rejected.
However, the sizes and masses of ULIRGs and QSO host galaxies have previously been
reported as significantly different.
The I-band dynamical results presented here alleviate this discrepancy.
There is now a much stronger dynamical link between ULIRGs and QSO host galaxies.
The strongest result comes from the KR,
in part, due to the large sample size of QSOs. The 2D KS test for the distribution of
objects in the Log Reff-Ieff plane, as well
as the two-sided KS tests for each parameter rule out statistical differences between
ULIRGs and QSOs (whether grouped together or compared separately as RLQs and RQQs).
While past comparisons have relied on the KR to reject the notion that ULIRGs evolve
into QSO host galaxies, the same comparison here at I-band strongly supports the
S88 paradigm.
However, it is still important to compare the kinematics of ULIRGs and QSOs.
Unfortunately, the tradeoff for doing so is the significantly smaller sample size of QSOs,
including the loss of comparing ULIRGs with only RQQs. The results for the FP are
consistent with those of the KR. QSOs
(either taken together or just RLQs) and ULIRGs show no statistical difference in their
distribution in FP parameter space. It is only when the parameter
∘ is considered alone that things become less clear. There is a weak
statistical difference between RLQs and ULIRGs for this parameter (see Table C1),
primarily due to the large RLQ errors. In the case of MDyn the differences
are stronger and the RLQ ∘ errors do not affect the results significantly
(see Table C1). How can these results be reconciled with those from the KR (and its
individual parameters) which uses the larger photometric QSO sample?
Is ∘ really different for RLQs and ULIRGs, or does it
appear to be different because the 6 RLQs in the kinematic sub-sample happen to be
non-representative of the larger RLQ sample? To test this, the 2D and standard
two-sided KS tests were re-run for the KR and its parameters between the ULIRGs and the
kinematic QSO sub-sample only. Just one difference emerges from the results
listed in Table C1. The Null Hypothesis can be rejected for the
Log Reff comparison between ULIRGs and the 6 RLQs. This explains
the rejection of the Null Hypothesis for MDyn
between RLQs and ULIRGs because ∘ and Log Reff are used
to compute the mass. Although the kinematic results for the RLQs are uncertain, when
the QSO hosts are considered as a single population, it suggests kinematic similarities
exist between them and ULIRGs. Overall, these results clearly demonstrate the need for
more measurements of ∘ in RLQs and RQQs to confirm the results from the
KR and probe whether the kinematic differences between RLQs and ULIRGs are real
(and if any exist between ULIRGs and RQQs).
Although beyond the scope of this paper, these results also raise a conundrum
in regards to whether RQQs and RLQs are dynamically different. The Null Hypothesis can
be rejected when their luminosities are compared. This implies that their host masses are
different (assuming some M/L transformation from stellar population models
and that the ages of the stellar populations in RLQs and RQQs are the same). However,
their 2D distributions in the KR are not statistically different
(nor are the two parameters when each is compared separately). Since the KR is a
projection of the FP, which in turn is related to the correlation between M and
M/L, it implies that RLQs and RQQs are not dynamically different.
VII. Summary & Future Work
The main results of this paper are summarized below.
1) The -Discrepancy, first reported in RJ06a and quantified in
Paper I for LIRGs is shown to extend to ULIRG luminosities.
The ∘ measured from the CaT stellar absorption lines are systematically
larger than those obtained from the near-IR CO band-heads. With the addition of ULIRGs
the correlation between Frac and Log LIR
remains unchanged from Paper I. We posit that for the single nuclei (U)LIRGs presented
here and in Paper I, this relationship results from feedback processes that cause
monotonic aging and dimming of the YCSD population and the clearing out of the dusty,
star-forming medium.
2) At I-band, ULIRGs are nearly an order of magnitude more massive
than previously measured in the near-IR, and are consistent with ellipticals ranging
from m∗ to gEs. All of the ULIRGs presented here lie closer to
the Fundamental Plane and Kormendy Relation than in near-IR studies.
3) At I-band, the M/L values of ULIRGs appear to indicate
the presence of an old, evolved stellar population, similar to quiescent ellipticals.
Yet in the near-IR, ULIRGs reflect much younger populations, matching the well established
observations of significant quantities of molecular gas and high rates of SFR.
4) At I-band ULIRGs are dynamically similar to QSO host galaxies,
further supporting the S88 paradigm. ULIRGs are statistically consistent with
the positions of both RLQs and RQQs on the Fundamental Plane and Kormendy Relation.
This result uses the same methods of comparison which in the past have been used to
demonstrate that ULIRGs do not evolve into QSO host galaxies. However, when the
ULIRGs are compared with the kinematic sub-sample of RLQs, there is a statistical
difference (the Null Hypothesis can be rejected) for ∘,
MDyn, and Log Reff. The impact of this difference is
weakened by two caveats; the large errors in ∘ for the RLQs which
affects the KS tests (see Table C1;) and the contradiction which arises from the
Null Hypothesis not being rejected for ULIRGs and RLQs when the full sample of 28 RLQs
are considered. These results demonstrate the need for more ∘
measurements for RLQs (to resolve the contradiction) and RQQs in order to make a viable
kinematic comparison with ULIRGs and confirm the results presented here.
5) Finally, an homogenized I-band sample of RLQ and RQQ host galaxies
are presented here which can be used for future dynamical studies. The QSO hosts
can be used as either a control sample for further comparisons with IR-luminous systems
or as a representative sample itself for future studies of QSO host galaxies.
These are the first results from a much broader survey to establish an accurate
mass distribution for ULIRGs and to re-evaluate how these systems fit into the broader
picture of the formation and evolution of elliptical galaxies and QSOs. It is clear that
more kinematic (stellar ∘) observations are needed for RLQ and RQQ host
galaxies in order to confirm the results presented here. However, the results presented
so far are consistent with both the Toomre Hypothesis and QSO evolution scheme presented
in S88. Future work will focus on a multi-wavelength approach which will continue to
use optical observations to measure MDyn and near-IR observations to probe
the central kpc in ULIRGs. A comparison of central black hole masses
(M∙) will also be made, in order to determine the location of ULIRGs with
respect to the M∙- relation. These will require observations to
infer M∙ independent of or host luminosity. Assessing detailed
and accurate properties of local ULIRGs is key to formulating a better understanding of
similar systems (e.g. dust obscured galaxies, sub-millimeter galaxies, etc..) at higher
redshifts.
| Galaxy | R.A. | Dec. | z | Log LIR | E |
|---|---|---|---|---|---|
| Name | (J2000) | (J2000) | (L⊙) | (mag) | |
| IRAS F02021-2103 | 02 04 27 | -20 49 41 | 0.116 | 12.02a,ba,bfootnotemark: | 0.020 |
| IRAS 05189-2524 | 05 21 01 | -25 21 45 | 0.043 | 12.11aafootnotemark: | 0.026 |
| IRAS F10378+1108 | 10 40 29 | +10 53 18 | 0.136 | 12.26a,ba,bfootnotemark: | 0.029 |
| IRAS 11387+4116 | 11 41 22 | +40 59 51 | 0.148 | 12.03b,c,db,c,dfootnotemark: | 0.015 |
| IRAS 12540+5708 | 12 56 14 | +56 52 25 | 0.042 | 12.48aafootnotemark: | 0.009 |
| IRAS 17208-0014 | 17 23 21 | -00 17 01 | 0.043 | 12.34aafootnotemark: | 0.304 |
| IRAS 19542+1110 | 19 54 35 | +11 19 02 | 0.064 | 12.03a,ba,bfootnotemark: | 0.199 |
| IRAS 23365+3604 | 23 39 01 | +36 21 09 | 0.064 | 12.13a,ba,bfootnotemark: | 0.096 |
Note. — R.A. is in units of hours, minutes, and seconds, and Dec is in units of degrees, arcminutes, and arcseconds. LIR is the 8-1000 total flux measured from the 12, 25, 60, and 100 IRAS passbands. (a) All or some IRAS fluxes from Sanders et al. (2003); (b) 12 flux from WISE; (c) All or some IRAS fluxes from Moshir & et al. (1990); (d) 22 flux from WISE.
| Galaxy | Imaging | Imaging | ESI | ESI | ESI |
|---|---|---|---|---|---|
| Name | Camera/ | Integration Time | Integration Time | P.A. | Slitwidth |
| Filter | (sec) | (sec) | (deg) | (arcsec) | |
| IRAS F02021-2103aafootnotemark: | HST WFPC2/F814Wccfootnotemark: | 800 | 3600 | 55.0 | 1.0 |
| IRAS 05189-2524bbfootnotemark: | HST ACS/F814Wddfootnotemark: | 730 | 900 | 0.0 | 1.0 |
| IRAS F10378+1108bbfootnotemark: | SDSS/Sloan z | 54.1 | 1800 | 0.0 | 1.0 |
| IRAS 11387+4116bbfootnotemark: | SDSS/Sloan z | 54.1 | 1800 | 0.0 | 1.0 |
| IRAS 12540+5708aafootnotemark: | HST ACS/F814Wddfootnotemark: | 830 | 900 | 45.0 | 0.75 |
| IRAS 17208-0014aafootnotemark: | HST ACS/F814Wddfootnotemark: ,NIC2/F160Weefootnotemark: | 720,224 | 3900 | 40.0 | 1.0 |
| IRAS 19542+1110aafootnotemark: | HST ACS/F814Wddfootnotemark: | 720 | 3600 | 0.0 | 1.0 |
| IRAS 23365+3604aafootnotemark: | HST ACS/F814Wddfootnotemark: ,NIC2/F160Wfffootnotemark: | 750,2496 | 5400 | 300.0 | 1.0 |
Note. — (a) ESI P.I. Rothberg; (b) ESI P.I. Sanders; (c) HST Program 6346, P.I. Borne; (d) HST Program 10592, P.I. Evans; (e) HST Program 7219, P.I. Scoville; (f) HST Program 11235, Surace. The WFPC2 observations were centered on the WF3 chip.
| Galaxy | MI | Reff | Ieff | CaT ∘ | CaT V⊙ | CaT | Mdyn |
|---|---|---|---|---|---|---|---|
| Name | (mag) | (kpc) | (mag arcsec-2) | (km s-1) | (km s-1) | Template Star | (1011M⊙) |
| IRAS F02021-2103 | -23.61±0.05 | 9.51±0.23 | 19.84±0.05 | 209aafootnotemark: ±8 | 34679±8 | G8III HD 35369 | 5.79±0.46 |
| IRAS 05189-2524 | -22.71±0.09 | 2.59±0.10 | 17.93±0.12 | 265aafootnotemark: ±7 | 12869±7 | K0III HD 206067 | 2.54±0.15 |
| IRAS F10378+1108 | -22.96±0.10 | 3.09±0.14 | 18.05±0.23 | 280bbfootnotemark: ±11 | 41007±9 | G1III Sge (HD 185758) | 3.38±0.31 |
| IRAS 11387+4116 | -23.01±0.01 | 3.22±0.07 | 18.09±0.14 | 198bbfootnotemark: ±9 | 44575±7 | M0III Dra (HD 100029) | 1.76±0.16 |
| IRAS 12540+5708 | -23.42±0.10 | 5.88±0.27 | 18.98±0.13 | 346ccfootnotemark: ±9 | 12584±10 | G5II HD 36079 | 9.86±0.68 |
| IRAS 17208-0014 | -22.88±0.11 | 9.37±0.50 | 20.54±0.12 | 261aafootnotemark: ±5 | 12798±5 | K0III HD 206067 | 8.90±0.58 |
| IRAS 19542+1110 | -23.52±0.09 | 0.77±0.03 | 14.43±0.14 | 169aafootnotemark: ±6 | 18718±5 | G8III HD 35369 | 0.31±0.02 |
| IRAS 23365+3604 | -23.16±0.08 | 4.16±0.19 | 18.50±0.10 | 221aafootnotemark: ±6 | 19310±5 | K1.5III Boo (HD 124897) | 2.83±0.19 |
Note. — Fluxes are in VEGA magnitudes. The values have also been corrected for Galactic Reddening using dust maps from Schlegel et al. (1998) and scaling from Table 6 in Schlafly & Finkbeiner (2011), assuming RV 3.1 (Fitzpatrick 1999). The Aλ scaling factors used were: AF814W (ACS/WFC) 1.52; AF814W (WFPC2) 1.54; and Az 1.26. Circular isophotes were used for the F814W photometry. Elliptical isophotes were transformed to equivalent radii for SDSS z-band photometry on IRAS F10378+1108 and IRAS 11387+4116. (a) Measured in 1.53 kpc diameter aperture; (b) Corrected to 1.53 kpc diameter; (c) Measured 2.08 kpc NW from the nucleus and corrected to a 1.53 kpc diameter.
| Galaxy | CO ∘ | MDyn via CO | Reff (F160W) | M160W |
|---|---|---|---|---|
| Name | (km s-1) | (1011M⊙) | (kpc) | (mag) |
| IRAS F02021-2103 (A) | 143±21aafootnotemark: | 1.09 | 3.85ddfootnotemark: | -24.89fffootnotemark: |
| IRAS 05189-2524 (B) | 131±16aafootnotemark: | 0.11 | 0.48ddfootnotemark: | -23.96fffootnotemark: |
| IRAS 12540+5708 (C) | 117±10bbfootnotemark: | 0.20 | 1.05ddfootnotemark: | -24.22fffootnotemark: |
| IRAS 17208-0014 (D) | 223±15ccfootnotemark: | 0.94±0.14 | 1.36±0.10eefootnotemark: | -24.43±0.18 |
| IRAS 23365+3604 (E) | 143 ±15ccfootnotemark: | 0.57±0.13 | 2.00±0.22eefootnotemark: | -25.25±0.41 |
Note. — The letters A-E correspond to objects in Figure 5. Fluxes are in VEGA magnitudes. The values have also been corrected for Galactic Reddening using dust maps from Schlegel et al. (1998) and scaling of AF160W 0.51, assuming RV 3.1 (Fitzpatrick 1999). All values of ∘,CO have been corrected to a common aperture of 1.53 kpc. Some values in the table do not include errors because they were not available from the source materials. (a) Dasyra et al. (2006), M0III template star used (HD 99817); (b) Tacconi et al. (2002) K5Ib template star used (HD 200576); (c) Genzel et al. (2001) M0III template star used (HD 99817); (d) PSF-subtracted Sérsic fit (n 4) (Veilleux et al. 2006) from elliptical isophotes converted to equivalent radii using ellipticities derived from their Table 2; (e) Photomery measured using circular isophotes. (f) Veilleux et al. (2006). The values of ∘,CO in Column 2 and MDyn values computed in Column 3 are only for comparison purposes with the CaT derived properties in Table 3 and do not represent the global properties of the systems.
| Sample | N | Slope | Intercept | r.m.s. | r |
|---|---|---|---|---|---|
| Rest-frame I-band | |||||
| SDSS Ellipticals | 9255 | 2.26±0.01 | 17.56±0.01 | 0.35 | 0.71 |
| SDSS Ellipticals 85 125 km s-1 | 1656 | 2.76±0.01 | 17.75±0.01 | 0.38 | 0.76 |
| SDSS Ellipticals 125 ∘ 165 km s-1 | 3301 | 2.69±0.01 | 17.33±0.01 | 0.36 | 0.82 |
| SDSS Ellipticals 165 ∘ 225 km s-1 | 3524 | 2.72±0.01 | 17.02±0.01 | 0.35 | 0.85 |
| SDSS Ellipticals 225 ∘ 420 km s-1 | 774 | 2.37±0.02 | 17.00±0.01 | 0.21 | 0.87 |
| ULIRGsaafootnotemark: | 8 | 4.50±0.14 | 15.68±0.09 | 0.22 | 0.98 |
| RLQsbbfootnotemark: | 28 | 3.51±0.52 | 15.71±0.45 | 0.54 | 0.79 |
| RQQsbbfootnotemark: | 25 | 3.40±0.44 | 16.11±0.33 | 0.56 | 0.84 |
| All QSO Host Galaxiesbbfootnotemark: | 53 | 3.25±0.32 | 16.07±0.26 | 0.57 | 0.81 |
| Restframe I-band for Previously Published Samplesccfootnotemark: | |||||
| RLQs (O’Dowd et al. 2002) | 16 | 3.81±0.66ddfootnotemark: | 15.37±0.59 | 0.46 | 0.83 |
| RLQs (D03) | 10 | 3.66±0.47eefootnotemark: | 15.77±0.42 | 0.23 | 0.93 |
| RLQs (D03, excluding two outliersfffootnotemark: ) | 8 | 3.05±0.30ggfootnotemark: | 16.42±0.29 | 0.12 | 0.97 |
| RQQs (D03) | 9 | 3.40±0.73hhfootnotemark: | 16.43±0.58 | 0.37 | 0.86 |
| RLQs (F04) | 7 | 3.68±0.10iifootnotemark: | 15.83±0.08 | 0.37 | 0.94 |
| RQQs (F04) | 7 | 3.13±0.20iifootnotemark: | 15.86±0.15 | 0.45 | 0.91 |
| RLQs + RQQs Combined (F04) | 14 | 3.20±0.07jjfootnotemark: | 16.00±0.06 | 0.48 | 0.91 |
Note. — As a comparison, the earlier B-band and V-band KRs had slopes of 3.02 (Kormendy 1977) and 2.94 (Hamabe & Kormendy 1987), repsectively, using the surface brightness at the effective radius. Two fits each were made to the RLQ, RQQ, and RLQ+RQQ data to account for the absence of errors in the D03 sample. If errors were available a DWLSQ fit, which takes into account errors in X and Y, was used. Otherwise, the data points were equally weighted and a standard least-squares fit was used. The fits plotted in Figure 6 include all data for the ULIRGs, RLQs, and RQQs. (a) IRAS 19542+1110 is considered an outlier because it is 6.3 from the KR plotted in Figure 6, while all other ULIRGs are 2 from the line. Excluding it changes the fit to: eff 3.85±0.19Log Reff + 16.19±0.14, r.m.s. 0.24 and r 0.96; (b) No errors are available for the D03 sample. The KR was fit using a simplified least-squares fit with equal weighting of errors for the dependent data points. When the D03 data are excluded and a DWLSQ method was used the fits change to: RLQs (N 22): eff 3.58±0.07Log Reff + 15.66±0.06, r.m.s. 0.57 and r 0.81; RQQs (N 20): eff 3.79±0.09Log Reff + 15.15±0.06, r.m.s. 0.83 and r 0.83; All QSOs (N 42): eff 4.23±0.05Log Reff + 14.85±0.03, r.m.s. 0.74 and r 0.82; (c) All of the QSOs used to derive the preivously published KRs are also part of the QSO Comparison Sample in Appendix B. The previously published fits used the surface brightness at the effective radius, not the surface brightness within the effective radius (eff), as used here. The original fits used different cosmologies, k-corrections, transformations to different rest-frame filters, and different fitting techniques. They have been refit here to provide a clean comparison; (d) Original published restframe R-band published slope 2.75±1.2; (e) Original published observed F675W-band published slope 3.98±0.71; (f) PG 1004+130 and OX 169; (g) Original published restframe R-band published slope 3.19±0.67; (h) F675W-band published slope 2.99±0.34; (i) RLQ and RQQ samples from F04 were not fit separately; (j) Original published restframe V-band published slope 3.33±0.7.


Appendix A Sloan Digital Sky Survey Comparison Sample Selection Criteria
The selection criteria used to generate the SDSS comparison sample are described
below. They are based upon the criteria used in
Bernardi et al. (2003b); Hyde & Bernardi (2009a); Hyde & Bernardi (2009b)
to select early-type galaxies (including S0 or lenticulars) for deriving the Fundamental
Plane in several bandpasses. The criteria are divided into photometric (items 1-7) and
spectroscopic (items 8-12) categories. The selection criteria required that the elliptical
galaxy must be present in both the photometric (PhotoObjAll) and spectroscopic
(SpecObj) databases. Only Sloan i-band photometry was used
for the photometric catalog. No magnitude or flux limitations were imposed on the
sample.
The biggest differences between the selection criteria used here and those in
Bernardi et al. (2003b); Hyde & Bernardi (2009a); Hyde & Bernardi (2009b)
are: redshift (z 0.15 here vs. 0.36); restricting the sample to elliptical
morphologies only (affected by lnlDev and lnlExp; and
85 km s-1 vs 60 km s-1 to avoid the effects of instrumental
resolution (see Appendix B in Bernardi et al. (2003b)). No parameters or values
for those parameters were selected that would exclude any elliptical in the comparison
sample from being a part of the HB09 sample.
1) MODE 1 selects the primary photometry for each object, rejecting possible duplications as
wells as objects flagged as saturated, near the edge of a CCD.
2) PARENTID 0 and nCHILD 0 rejects galaxies blended with other objects, or the child of a
de-blended set of objects. Given the spatial resolution of the photometry and spectral resolution of the data,
de-blended superimposed objects may yield unrealistic measured parameters. Not setting these parameters resulted
in a number of double counted galaxies in which the same is assigned to both parent and child galaxy,
producing spurious results.
3) FRACDEV 1: defined as the fraction of total flux which contributes to a de Vaucouleurs
(de Vaucouleurs 1953) or r1/4 fit to the galaxy light profile.
4) devAB 0.6: defined as the axis ratio of the minor to major axis for a de Vaucouleurs fit.
Analysis by Hyde & Bernardi (2009a); Hyde & Bernardi (2009b) demonstrated that while FRACDEV 1 eliminates most disk galaxies
from SDSS photometric catalogs, a non-trivial amount remain. Values of devAB 0.6 significantly
improve the removal of late-type galaxies.
5) Type 3: Morphological classification as a galaxy.
6) lnlExp & lnlDev -9999: lnlExp and lnlDev are maximum likelihood functions
which estimates the best-fit model parameters convolved with an estimate of the seeing. Smaller values indicate
a larger likelihood. The criteria cutoff assure that the measured values have meaning, as values of -9999 mean
no data is available.
7) lnlDev at least 10 lnlExp: This criteria selects objects in which the likelihood
of a de Vaucouleurs fit is 10 greater than an exponential fit. This is a recommended setting from SDSS for
selecting elliptical galaxies.
8) specObjID 0: reject objects without spectroscopic observations.
9) SpecClass 2: Spectral classification as a galaxy.
10) eClass 0: a one-dimensional classification of spectral type from Principal Component Analysis
(Yip et al. 2004) in which negative values correspond to absorption line galaxies with old stellar
populations and positive values correspond to star-forming galaxies.
11) sn0, sn1, and sn2 10.0:
The values of in DR7 are measured by fitting the rest-frame wavelength range 0.4-0.7 .
The sn0, sn1, and sn2 criteria were selected to ensure was measured from spectra with
sufficient S/N.
12) 85 km s-1 and 420 km s-1: The SDSS spectra are re-sampled to a dispersion
of log = 10-4 dex pixel-1 which corresponds to 69 km s-1. The actual spectral resolution
varies from 85-105 km s-1 for galaxies in the SDSS spectra (Bernardi et al. 2003b) due to variations
as a function of wavelength. The DR7 (and DR6) values differ from earlier data releases in that
they are measured using a direct-fitting method (Rix & White 1992) with the assumption of a Gaussian
profile, rather than a Fourier fitting routine. The latter appears to bias ’s
150 km s-1 systematically higher
(Bernardi 2007). The direct-fitting method is the same method used for measuring the
∘ from the spectra of the ULIRGs presented here although the profile shape is fit with a
Gauss-Hermite polynomial rather than a Gaussian because the S/N is higher (see Section 3, RJ06a, and Paper I).
The DR7 release notes also warn that 420 km s-1 are not reliable. To err
on the side of caution we have selected the lower cutoff to be the approximate limit of,
rather than below the instrumental resolution.
Finally, for completeness, we apply a rest-frame radius correction for each elliptical galaxy
in the SDSS comparison sample. Since early-type galaxies have color gradients, yielding slightly larger
Reff at bluer wavelengths, we use equation 6 from Hyde & Bernardi (2009a),
which interpolates the observed radii from adjacent bands. The median correction is
+0.012 kpc.
Appendix B Data for the Comparison Samples of RLQ & RQQ Host Galaxies
| Galaxy | R.A. | Dec. | z | Log LIR | Eaafootnotemark: | Camera/ | MI | Reff | Ieff |
|---|---|---|---|---|---|---|---|---|---|
| Name | (J2000) | (J2000) | (L⊙) | (mag) | Filter | (mag) | (kpc) | (mag arcsec-2) | |
| Radio Loud QSO Comparison Sample | |||||||||
| HB89 0031-707 | 00 34 05 | -70 25 52 | 0.363 | 12.22b,c,d,3,4b,c,d,3,4footnotemark: | 0.031 | WF3/F791W$\dagger$$\dagger$footnotemark: | -23.79±0.08 | 7.74±0.28 | 19.21±0.08 |
| HB89 0110+297 | 01 13 24 | +29 58 15 | 0.363 | 12.47b,c,d,3,4b,c,d,3,4footnotemark: | 0.063 | WF2/F814W$\dagger$$\dagger$footnotemark: | -23.57±0.14 | 8.66±0.56 | 19.67±0.12 |
| 3C48 | 01 37 41 | +33 09 35 | 0.367 | 13.03b,1,2,3,4b,1,2,3,4footnotemark: | 0.044 | PC/F814W$\ast$$\ast$footnotemark: | -25.59±0.03 | 11.85±0.10 | 18.34±0.10 |
| PKS 0137+012 | 01 39 57 | +01 31 46 | 0.260 | 12.54b,c,3,4b,c,3,4footnotemark: | 0.029 | WF2/F675W$\ast$$\ast$footnotemark: | -24.26±0.03 | 9.81±0.13 | 19.26±0.07 |
| PKS 0202-76 | 02 02 13 | -76 20 03 | 0.389 | 12.66b,d,3,4b,d,3,4footnotemark: | 0.051 | PC/F702W$\ast$$\ast$footnotemark: | -23.84±0.07 | 2.68±0.08 | 16.84±0.12 |
| 3C59 | 02 07 09 | +29 31 41 | 0.109 | (11.75)bbfootnotemark: | 0.063 | WF2/F675W$\ddagger$$\ddagger$footnotemark: | -23.31 | 5.28 | 18.86 |
| PKS 0312-77 | 03 11 55 | -76 51 51 | 0.223 | 11.92b,c,4b,c,4footnotemark: | 0.097 | PC/F702W$\ast$$\ast$footnotemark: | -24.35±0.02 | 10.98±0.07 | 19.42±0.08 |
| PKS 0736+01 | 07 39 18 | +01 37 05 | 0.191 | 11.80e,4e,4footnotemark: | 0.128 | WF2/F675W$\ast$$\ast$footnotemark: | -24.12±0.02 | 8.42±0.09 | 19.07±0.06 |
| PKS 0812+02 | 08 15 22 | +01 55 00 | 0.402 | 12.44b,c,3,4b,c,3,4footnotemark: | 0.029 | WF2/F814W$\dagger$$\dagger$footnotemark: | -24.43±0.03 | 12.39±0.21 | 19.60±0.05 |
| PKS 0903+16 | 09 06 31 | +16 46 12 | 0.412 | 12.83b,c,db,c,dfootnotemark: | 0.040 | PC/F814W$\ast$$\ast$footnotemark: | -23.89±0.24 | 5.09±0.55 | 18.20±0.25 |
| PG 1004+130 | 10 07 26 | +12 38 56 | 0.240 | 12.26c,g,4c,g,4footnotemark: | 0.040 | WF2/F675W$\ddagger$$\ddagger$footnotemark: | -24.34 | 5.88 | 18.07 |
| PKS 1020-103 | 10 22 32 | -10 37 44 | 0.190 | 11.17c,d,ec,d,efootnotemark: | 0.046 | WF2/F675W$\ddagger$$\ddagger$footnotemark: | -23.39 | 4.40 | 18.39 |
| PKS 1058+110 | 11 00 47 | +10 46 13 | 0.422 | 11.41c,d,ec,d,efootnotemark: | 0.026 | WF2/F814W$\dagger$$\dagger$footnotemark: | -23.32±0.18 | 9.01±0.75 | 20.01±0.14 |
| HB89 1150+497 | 11 53 24 | +49 31 09 | 0.333 | 12.29c,d,f,4c,d,f,4footnotemark: | 0.021 | WF2/F814W$\dagger$$\dagger$footnotemark: | -23.74±0.08 | 5.18±0.18 | 18.39±0.11 |
| HB89 1208+322 | 12 10 37 | +31 57 06 | 0.389 | 12.31b,c,d,3b,c,d,3footnotemark: | 0.017 | WF3/F791W$\dagger$$\dagger$footnotemark: | -23.11±0.03 | 3.66±0.05 | 18.26±0.05 |
| PKS 1217+02 | 12 20 11 | +02 03 42 | 0.240 | 12.22b,d,4b,d,4footnotemark: | 0.022 | WF2/F675W$\ddagger$$\ddagger$footnotemark: | -23.89 | 7.35 | 19.00 |
| PG 1226+023 | 12 29 06 | +02 03 09 | 0.158 | 12.72ggfootnotemark: | 0.021 | WF3/F606W$\ast$$\ast$footnotemark: | -24.89±0.04 | 8.41±0.13 | 18.29±0.10 |
| PKS 1233-24 | 12 35 37 | -25 12 17 | 0.355 | 12.46b,c,db,c,dfootnotemark: | 0.097 | WF2/F814W$\dagger$$\dagger$footnotemark: | -23.60±0.07 | 2.27±0.07 | 16.75±0.05 |
| PG 1302-102 | 13 05 33 | -10 33 19 | 0.278 | 12.35c,d,hc,d,hfootnotemark: | 0.043 | WF3/F606W$\ast$$\ast$footnotemark: | -24.89±0.04 | 8.21±0.15 | 18.24±0.10 |
| PG 1425+267 | 14 27 35 | +26 32 14 | 0.366 | 12.64d,i,3,4d,i,3,4footnotemark: | 0.019 | WF3/F814W$\ast$$\ast$footnotemark: | -24.25±0.03 | 14.50±0.20 | 20.12±0.10 |
| PG 1545+210 | 15 47 43 | +20 52 17 | 0.264 | 11.95c,g,4c,g,4footnotemark: | 0.042 | WF3/F606W$\ast$$\ast$footnotemark: | -24.06±0.05 | 7.42±0.17 | 18.85±0.09 |
| PG 1704+608 | 17 04 41 | +60 44 31 | 0.372 | 12.71g,4g,4footnotemark: | 0.069 | PC/F702W$\ast$$\ast$footnotemark: | -25.48±0.07 | 7.43±0.20 | 17.43±0.16 |
| PKS 2135-14 | 21 37 45 | -14 32 56 | 0.200 | 12.06b,c,d,4b,c,d,4footnotemark: | 0.050 | WF2/F675W$\ast$$\ast$footnotemark: | -23.84±0.03 | 10.25±0.16 | 19.78±0.07 |
| OX 169 | 21 43 35 | +17 43 49 | 0.211 | 11.99b,c,d,3,4b,c,d,3,4footnotemark: | 0.111 | WF2/F675W$\ast$$\ast$footnotemark: | -23.77±0.03 | 4.09±0.02 | 17.85±0.13 |
| 4C +31.63 | 22 03 15 | +31 45 38 | 0.295 | 12.82b,c,d,3,4b,c,d,3,4footnotemark: | 0.124 | PC/F702W$\ast$$\ast$footnotemark: | -25.11±0.03 | 7.02±0.09 | 17.68±0.08 |
| PKS 2247+14 | 22 50 25 | +14 19 52 | 0.237 | 12.18b,c,3,4b,c,3,4footnotemark: | 0.050 | WF2/F675W$\ast$$\ast$footnotemark: | -24.01±0.02 | 9.59±0.08 | 19.46±0.07 |
| PG 2349-014 | 23 51 56 | -01 09 13 | 0.174 | 11,81c,d,gc,d,gfootnotemark: | 0.027 | WF2/F675W$\ast$$\ast$footnotemark: | -24.68±0.02 | 18.18±0.12 | 20.18±0.06 |
| PKS 2355-082 | 23 58 09 | -08 00 04 | 0.210 | 11.86b,c,d,3,4b,c,d,3,4footnotemark: | 0.040 | WF2/F675W$\ddagger$$\ddagger$footnotemark: | -23.76 | 6.50 | 18.87 |
| Radio Quiet QSO Comparison Sample | |||||||||
| LBQS 0020+0018 | 00 23 11 | +00 35 18 | 0.423 | 12.33b,c,d,3b,c,d,3footnotemark: | 0.024 | PC/F675W$\ast$$\ast$footnotemark: | -23.59±0.12 | 2.29±0.12 | 16.78±0.13 |
| HB89 0054+144 | 00 57 09 | +14 46 10 | 0.171 | 12.36b,d,4b,d,4footnotemark: | 0.046 | WF3/F606W$\ast$$\ast$footnotemark: | -23.92±0.04 | 4.54±0.05 | 17.92±0.13 |
| LBQS 0100+0205 | 01 03 13 | +02 21 10 | 0.393 | 12.62b,c,d,3,4b,c,d,3,4footnotemark: | 0.021 | PC/F675W$\ast$$\ast$footnotemark: | -23.23±0.23 | 3.35±0.34 | 17.96±0.24 |
| Mrk 1014 | 01 59 50 | +00 23 41 | 0.164 | 12.59ggfootnotemark: | 0.029 | WF2/F675W$\ddagger$$\ddagger$footnotemark: | -24.56 | 10.45 | 19.10 |
| HB89 0244+194 | 02 47 40 | +19 40 58 | 0.176 | 11.59b,c,d,3,4b,c,d,3,4footnotemark: | 0.110 | WF2/F675W$\ast$$\ast$footnotemark: | -23.01±0.06 | 5.31±0.14 | 19.18±0.09 |
| HS 0624+6907 | 06 30 02 | +69 05 04 | 0.370 | 12.62b,c,d,3,4b,c,d,3,4footnotemark: | 0.098 | WF3/F791W$\dagger$$\dagger$footnotemark: | -24.73±0.16 | 6.84±0.49 | 18.01±0.15 |
| MS 0754.6+3928 | 07 58 00 | +39 20 39 | 0.096 | 11.69c,d,j,4c,d,j,4footnotemark: | 0.066 | PC/F814W$\ast$$\ast$footnotemark: | -23.91±0.04 | 2.49±0.04 | 16.64±0.10 |
| PG 0923+201 | 09 25 54 | +19 54 05 | 0.190 | 12.07c,d,jc,d,jfootnotemark: | 0.042 | WF3/F606W$\ast$$\ast$footnotemark: | -23.64±0.05 | 8.69±0.20 | 19.62±0.10 |
| PG 0953+415 | 09 56 52 | +41 15 22 | 0.234 | 11.82c,dc,dfootnotemark: | 0.012 | WF2/F675W$\ddagger$$\ddagger$footnotemark: | -22.89 | 5.20 | 19.25 |
| PG 1001+291 | 10 04 02 | +28 55 35 | 0.329 | 12.80b,3,4b,3,4footnotemark: | 0.022 | WF3/F791W$\dagger$$\dagger$footnotemark: | -23.98±0.08 | 9.01±0.35 | 19.36±0.10 |
| PG 1012+008 | 10 14 54 | +00 33 37 | 0.186 | 11.93c,d,3,4c,d,3,4footnotemark: | 0.031 | WF2/F675W$\ddagger$$\ddagger$footnotemark: | -23.90 | 16.66 | 20.77 |
| He 1029-1401 | 10 31 54 | -14 16 51 | 0.086 | 11.35b,c,4b,c,4footnotemark: | 0.067 | WF3/F606W$\ast$$\ast$footnotemark: | -23.24±0.02 | 5.19±0.04 | 18.90±0.08 |
| PG 1202+28 | 12 04 42 | +27 54 12 | 0.165 | 11.72c,gc,gfootnotemark: | 0.021 | WF3/F606W$\ast$$\ast$footnotemark: | -23.27±0.03 | 3.12±0.04 | 17.77±0.10 |
| PG 1216+069 | 12 19 20 | +06 38 39 | 0.331 | 12.53c,d,i,3,4c,d,i,3,4footnotemark: | 0.022 | PC/F702W$\ast$$\ast$footnotemark: | -23.30±0.18 | 8.72±0.70 | 19.96±0.25 |
| LBQS 1230+0947 | 12 33 25 | +09 31 23 | 0.414 | 13.02b,c,3,4b,c,3,4footnotemark: | 0.021 | WF3/F791W$\dagger$$\dagger$footnotemark: | -23.92±0.08 | 3.98±0.13 | 17.65±0.13 |
| EQS B1252+0200 | 12 55 19 | +01 44 12 | 0.345 | 12.59b,d,3,4b,d,3,4footnotemark: | 0.018 | WF3/F791W$\dagger$$\dagger$footnotemark: | -22.57±0.28 | 2.85±0.36 | 18.27±0.30 |
| EQS B1254+0206 | 12 57 06 | +01 50 39 | 0.421 | 12.71b,c,3,4b,c,3,4footnotemark: | 0.020 | WF2/F814W$\dagger$$\dagger$footnotemark: | -24.64±0.04 | 10.62±0.22 | 19.05±0.04 |
| EQS B1255-0143 | 12 58 15 | -01 59 19 | 0.410 | 12.39b,c,d,3,4b,c,d,3,4footnotemark: | 0.018 | WF2/F814W$\dagger$$\dagger$footnotemark: | -22.94±0.29 | 1.11±0.14 | 15.86±0.25 |
| PG 1307+085 | 13 09 47 | +08 19 48 | 0.155 | 11.73c,d,g,4c,d,g,4footnotemark: | 0.033 | WF3/F606W$\ast$$\ast$footnotemark: | -23.05±0.05 | 4.58±0.10 | 18.82±0.11 |
| PG 1416-129 | 14 19 03 | -13 10 44 | 0.129 | 11.49c,d,i,3,4c,d,i,3,4footnotemark: | 0.094 | PC/F814W$\ast$$\ast$footnotemark: | -22.14±0.08 | 2.80±0.10 | 18.66±0.13 |
| PG 1444+407 | 14 46 45 | +40 35 06 | 0.267 | 12.43c,gc,gfootnotemark: | 0.014 | WF3/F606W$\star$$\star$footnotemark: | -24.24 | 4.97 | 17.80 |
| HB89 1549+203 | 15 52 02 | +20 14 02 | 0.250 | 12.33b,c,d,3,4b,c,d,3,4footnotemark: | 0.054 | WF2/F675W$\ddagger$$\ddagger$footnotemark: | -22.49 | 3.48 | 18.78 |
| HB89 1635+119 | 16 37 46 | +11 49 49 | 0.146 | 11.83b,c,db,c,dfootnotemark: | 0.052 | WF2/F675W$\ast$$\ast$footnotemark: | -23.18±0.02 | 4.16±0.03 | 18.47±0.06 |
| HB89 1821+643 | 18 21 57 | +64 20 36 | 0.297 | 13.05c,jc,jfootnotemark: | 0.043 | WF3/F791W$\dagger$$\dagger$footnotemark: | -24.81±0.02 | 12.52±0.13 | 19.23±0.05 |
| HB89 2215-037 | 22 17 47 | -03 32 38 | 0.242 | 12.37b,3,4b,3,4footnotemark: | 0.106 | PC/F702W$\ast$$\ast$footnotemark: | -23.88±0.02 | 6.79±0.06 | 18.84±0.08 |
Note. — PC Planetary Camera; WF2 Wide Field 2; WF3 Wide Field 3; WF4 Wide Field 4. All rest-frame I-band photometry is in Vega magnitudes and has been corrected for Galactic Reddening. The Aλ scaling factors used were: AF606W 2.41; AF675W 2.52; AF702W 1.94; AF791W 1.74; AF814W 1.54. The Reff listed in this table are equivalent radii. (a) Galactic reddening values from (Schlegel et al. 1998); (b) Fluxes from NASAIPAC Scan Processing and Integration tool; (c) 12 flux from WISE; (d) 22 flux from WISE; (e) computed only from 12 and 22 WISE fluxes; (f) Impey & Neugebauer (1988); (g) Sanders et al. (1989a); (h) Haas et al. (2000) based on ISO photometry; (i) Haas et al. (2003) based on ISO photometry; (j) IRAS Faint Source Catalog; (1) upper limits (3r.m.s.) used for f12; (2) upper limits (3r.m.s.) used for f25; (3) upper limits (3r.m.s.) used for f60; (4) upper limits (3r.m.s.) used for f100. The IRAS fluxes for 3C59 were computed from 3 upper limits only and noted in parentheses above. () HST/WFPC2 Photometry from (Floyd et al. 2004, Floyd, private communication); () HST/WFPC2 Photometry from (Hamilton et al. 2002; Hamilton et al. 2008, Hamilton, private communication); () HST/WFPC2 Photometry from Dunlop et al. (2003). Although R-band values are listed in the paper, they are actually values for the F675W filter and were not transformed to Cousins R-band; () HST/WFPC2 Photometry from Bahcall et al. (1997).
| Galaxy | Optical ∘ | Mdyn |
|---|---|---|
| Name | (km s-1) | (1011M⊙) |
| Radio Loud QSOs | ||
| PKS 0736+01 | 348 ±83 | 14.28±7.62 |
| PG 1226+023 | 339 ±58 | 13.54±5.15 |
| PG 1302-102 | 386 ±72 | 17.13±7.13 |
| PKS 2135-14 | 310 ±106 | 13.78±10.50 |
| 4C +31.63aafootnotemark: | 318 ±49 | 9.92±3.39 |
| PG 2349-014aafootnotemark: | 279 ±64 | 19.78±10.09 |
| Radio Quiet QSOs | ||
| HB89 0054+144 | 167 ±11 | 1.76±0.26 |
| PG 1444+407 | 313 ±22 | 6.81±1.07 |
Note. — All ∘ values are measured using the Ca II H&K stellar absorption line over the 0.385-0.42 wavelength range. All values of ∘ have been corrected to a common aperture of 1.53 kpc. The average radii of the extracted apertures are listed in Table 3 of Wolf & Sheinis (2008). (a) The average radius is used for multiple extracted positions (Wolf & Sheinis 2008).
Appendix C Images, Light Profiles, & Spectra of the ULIRG Sample

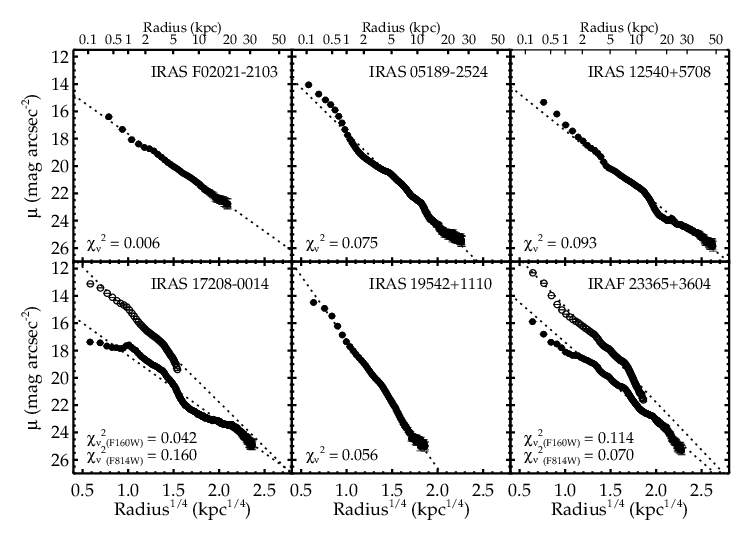
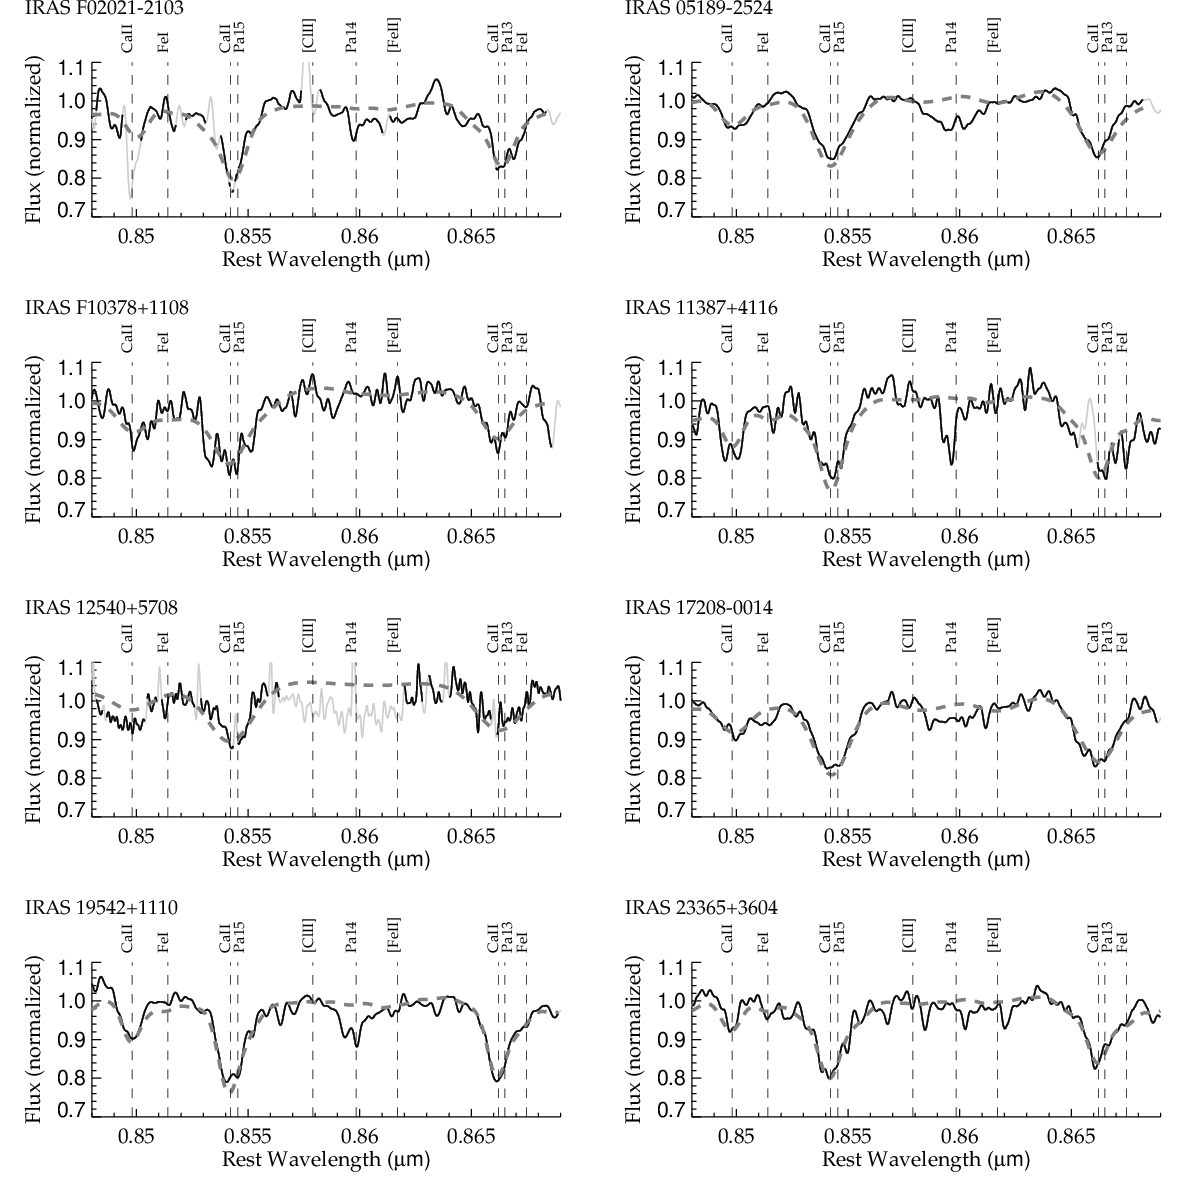
| Comparison | Fundamental | ∘ | MDyn-M/L | MDyn | Kormendyaafootnotemark: | Log Reffaafootnotemark: | Ieffaafootnotemark: | Log LIR |
|---|---|---|---|---|---|---|---|---|
| Sample | Plane (2D) | (2D) | Relation (2D) | (L⊙) | ||||
| RLQs | No (89) | Yes (26) | Yesddfootnotemark: (72) | Yeseefootnotemark: (87) | No | Nohhfootnotemark: | No | No |
| RQQs | No | No | No | No | ||||
| All QSOs | No (100) | No (97) | Yes (27) | No (100) | No | No | No | No |
| SDSS Ellipticals | Yesbbfootnotemark: | Yesccfootnotemark: | Yesbbfootnotemark: | Yesfffootnotemark: | Noggfootnotemark: | Noiifootnotemark: | No |
Note. — This table presents a summary of the 1D and 2D KS tests performed between the distributions of the ULIRGs and the various samples listed in Column 1. The term “2D” refers to the two-dimensional KS test. Otherwise the KS test results presented here are for the standard two-sided KS test which compares the distributions of two empirical samples. Due to the large errors associated with the RLQ ∘ values, the KS tests also have been run using Monte Carlo simulations in which each RLQ ∘ is randomly assigned a value of ∘∘. Test results above which include the RLQ ∘ parameter show a parentheses indicating what percent of 10,000 Monte Carlo simulations the result occurs. Although IRAS 19542+1110 is 3.9 outlier from the FP, excluding it from the KS tests in columns 2-5 does not change the results presented above. (a) Comparison with larger photometric sample of QSOs (28 RLQs and 25 RQQs); (b) No for 165-225 km s-1 and 225-420 km s-1 bins; (c) The Null Hypothesis can also be rejected at the 99 level; (d) The Null Hypothesis can also be rejected at the 99 level but only 13 of the time; (e) The Null Hypothesis can also be rejected at the 99 level but only 12 of the time; (f) No for the 225-420 km s-1 bins; (g) The Null Hypothesis can be rejected when IRAS 19542+1110 is excluded. The Null Hypothesis cannot be rejected for the 165-225 km s-1 and 225-420 km s-1 bins whether or not IRAS 19542+1110 is excluded; (h) If only the 6 RLQs in the kinematic sub-sample are compared with the ULIRGs, then the Null Hypothesis can be rejected; (i) When IRAS 19542+1110 is excluded the Null Hypothesis can be rejected.
Appendix D Cosmic Ray Rejection Algorithm and Bad Pixel Mask
Most HST/ACS programs employ either CR-SPLIT, (two separate exposures
at the same pointing), or multiple (e.g. 2) dithered positions to remove cosmic rays
(CRs) and artifacts. The CR-SPLIT mode is most appropriate for programs where
the absence of data in the gap will not impact the science (small targets or point
sources). MULTIDRIZZLE compares the two images and flags pixels that have
changed significantly between the two exposures. Dithering will “fill in” the chip gap
and allow for the recovery of information in the chip gap. With at least 3 dither
positions the same technique for removing CRs in the chip gap can be used.
Program 10592 used a two position dithering scheme (ACS-WFC-DITHER-LINE)
that shifts the image 5 pixels in X and 60 pixels in Y. This fills the chip gap but
with data from one exposure only (each gap is filled by information from the other
exposure). Thus, the final images contained significant CR hits and hot pixels in the
chip gap. Because the ULIRGs were not centered on either chip, but
centered in the ACS/WFC FOV (aperture WFC) the chip gap runs through the outer
regions of the galaxy, impacting the science data. Because more objects were affected
by this than in Paper I, an improved and more automated algorithm was developed to
create a bad pixel mask. First, a zero level background
image was created by identifying the median background flux levels of the multidrizzled
final image and replacing pixels at or below these values with a value of zero (using
IMREPLACE). Second, the zero-level background image was passed through a median
filter using a 1515 pixel filter box, creating a new filtered image.
Third, the zero-level background image was divided by the median filtered image. In this
divided image, all pixels with flux values above the maximum pixel value in the nucleus
were set to a value of 1 (bad), the remaining pixels were to set to a value of 0 (good).
This pixel mask proved successful for identifying saturated stars, diffraction spikes,
and elongated CRs in the gap and areas covered by only one pointing. This pixel mask
was then combined with one created from pixels flagged bad by MULTIDRIZZLE,
and a pixel mask created from the positions of foreground stars and background
galaxies.
References
- Abazajian (2009) Abazajian, K. N. e. a. 2009, ApJS, 182, 543
- Alladin (1965) Alladin, S. M. 1965, ApJ, 141, 768
- Anantharamaiah et al. (2000) Anantharamaiah, K. R., Viallefond, F., Mohan, N. R., Goss, W. M., & Zhao, J. H. 2000, ApJ, 537, 613
- Armus et al. (2009) Armus, L., Mazzarella, J. M., Evans, A. S., Surace, J. A., Sanders, D. B., Iwasawa, K., Frayer, D. T., Howell, J. H., Chan, B., Petric, A., Vavilkin, T., Kim, D. C., Haan, S., Inami, H., Murphy, E. J., Appleton, P. N., Barnes, J. E., Bothun, G., Bridge, C. R., Charmandaris, V., Jensen, J. B., Kewley, L. J., Lord, S., Madore, B. F., Marshall, J. A., Melbourne, J. E., Rich, J., Satyapal, S., Schulz, B., Spoon, H. W. W., Sturm, E., U, V., Veilleux, S., & Xu, K. 2009, PASP, 121, 559
- Bacon et al. (1985) Bacon, R., Monnet, G., & Simien, F. 1985, A&A, 152, 315
- Bahcall et al. (1997) Bahcall, J. N., Kirhakos, S., Saxe, D. H., & Schneider, D. P. 1997, ApJ, 479, 642
- Baldry et al. (2004) Baldry, I. K., Glazebrook, K., Brinkmann, J., Ivezić, Ž., Lupton, R. H., Nichol, R. C., & Szalay, A. S. 2004, ApJ, 600, 681
- Baldry et al. (2008) Baldry, I. K., Glazebrook, K., & Driver, S. P. 2008, MNRAS, 388, 945
- Barnes (1988) Barnes, J. E. 1988, ApJ, 331, 699
- Barnes (1992) —. 1992, ApJ, 393, 484
- Barnes (2002) —. 2002, MNRAS, 333, 481
- Barnes & Hernquist (1996) Barnes, J. E. & Hernquist, L. 1996, ApJ, 471, 115
- Barnes & Hernquist (1991) Barnes, J. E. & Hernquist, L. E. 1991, ApJ, 370, L65
- Barth et al. (2002) Barth, A. J., Ho, L. C., & Sargent, W. L. W. 2002, AJ, 124, 2607
- Bell & de Jong (2001) Bell, E. F. & de Jong, R. S. 2001, ApJ, 550, 212
- Bell et al. (2003) Bell, E. F., McIntosh, D. H., Katz, N., & Weinberg, M. D. 2003, ApJS, 149, 289
- Bell et al. (2007) Bell, E. F., Zheng, X. Z., Papovich, C., Borch, A., Wolf, C., & Meisenheimer, K. 2007, ApJ, 663, 834
- Bender et al. (1992) Bender, R., Burstein, D., & Faber, S. M. 1992, ApJ, 399, 462
- Bender et al. (1989) Bender, R., Surma, P., Doebereiner, S., Moellenhoff, C., & Madejsky, R. 1989, A&A, 217, 35, (B89)
- Bennert et al. (2008) Bennert, N., Canalizo, G., Jungwiert, B., Stockton, A., Schweizer, F., Peng, C. Y., & Lacy, M. 2008, ApJ, 677, 846
- Bernardi (2007) Bernardi, M. 2007, AJ, 133, 1954
- Bernardi et al. (2003a) Bernardi, M., Sheth, R. K., Annis, J., Burles, S., Eisenstein, D. J., Finkbeiner, D. P., Hogg, D. W., Lupton, R. H., Schlegel, D. J., SubbaRao, M., Bahcall, N. A., Blakeslee, J. P., Brinkmann, J., Castander, F. J., Connolly, A. J., Csabai, I., Doi, M., Fukugita, M., Frieman, J., Heckman, T., Hennessy, G. S., Ivezić, Ž., Knapp, G. R., Lamb, D. Q., McKay, T., Munn, J. A., Nichol, R., Okamura, S., Schneider, D. P., Thakar, A. R., & York, D. G. 2003a, AJ, 125, 1866
- Bernardi et al. (2003b) —. 2003b, AJ, 125, 1817
- Bertram et al. (2007) Bertram, T., Eckart, A., Fischer, S., Zuther, J., Straubmeier, C., Wisotzki, L., & Krips, M. 2007, A&A, 470, 571
- Binney (1982) Binney, J. 1982, ARA&A, 20, 399
- Blanton et al. (2003) Blanton, M. R., Hogg, D. W., Bahcall, N. A., Brinkmann, J., Britton, M., Connolly, A. J., Csabai, I., Fukugita, M., Loveday, J., Meiksin, A., Munn, J. A., Nichol, R. C., Okamura, S., Quinn, T., Schneider, D. P., Shimasaku, K., Strauss, M. A., Tegmark, M., Vogeley, M. S., & Weinberg, D. H. 2003, ApJ, 592, 819
- Bruzual (2007) Bruzual, G. From Stars to Galaxies: Building the Pieces to Build Up the Universe, ed. , A. VallenariR. TantaloL. Portinari & A. Moretti, 303
- Bruzual (2010) Bruzual, G. 2010, Royal Society of London Philosophical Transactions Series A, 368, 783
- Bruzual & Charlot (2003) Bruzual, G. & Charlot, S. 2003, MNRAS, 344, 1000
- Bryant & Scoville (1996) Bryant, P. M. & Scoville, N. Z. 1996, ApJ, 457, 678
- Calzetti et al. (1994) Calzetti, D., Kinney, A. L., & Storchi-Bergmann, T. 1994, ApJ, 429, 582
- Canalizo et al. (2007) Canalizo, G., Bennert, N., Jungwiert, B., Stockton, A., Schweizer, F., Lacy, M., & Peng, C. 2007, ApJ, 669, 801
- Canalizo & Stockton (2000) Canalizo, G. & Stockton, A. 2000, ApJ, 528, 201
- Canalizo & Stockton (2001) —. 2001, ApJ, 555, 719
- Cappellari et al. (2006) Cappellari, M., Bacon, R., Bureau, M., Damen, M. C., Davies, R. L., de Zeeuw, P. T., Emsellem, E., Falcón-Barroso, J., Krajnović, D., Kuntschner, H., McDermid, R. M., Peletier, R. F., Sarzi, M., van den Bosch, R. C. E., & van de Ven, G. 2006, MNRAS, 366, 1126
- Chini et al. (1997) Chini, R., Kreysa, E., & Wargau, W. F. 1997, A&A, 318, 15
- Cole et al. (2001) Cole, S., Norberg, P., Baugh, C. M., Frenk, C. S., Bland-Hawthorn, J., Bridges, T., Cannon, R., Colless, M., Collins, C., Couch, W., Cross, N., Dalton, G., De Propris, R., Driver, S. P., Efstathiou, G., Ellis, R. S., Glazebrook, K., Jackson, C., Lahav, O., Lewis, I., Lumsden, S., Maddox, S., Madgwick, D., Peacock, J. A., Peterson, B. A., Sutherland, W., & Taylor, K. 2001, MNRAS, 326, 255
- Colina et al. (2005) Colina, L., Arribas, S., & Monreal-Ibero, A. 2005, ApJ, 621, 725
- Dasyra et al. (2006) Dasyra, K. M., Tacconi, L. J., Davies, R. I., Naab, T., Genzel, R., Lutz, D., Sturm, E., Baker, A. J., Veilleux, S., Sanders, D. B., & Burkert, A. 2006, ApJ, 651, 835
- Davies et al. (2004) Davies, R. I., Tacconi, L. J., & Genzel, R. 2004, ApJ, 613, 781
- de Jong & Bell (2007) de Jong, R. S. & Bell, E. F. 2007, Comparing Dynamical and Stellar Population Mass-To-Light Ratio Estimates, ed. R. S. de Jong, 107
- de Vaucouleurs (1953) de Vaucouleurs, G. 1953, MNRAS, 113, 134
- Djorgovski & Davis (1987) Djorgovski, S. & Davis, M. 1987, ApJ, 313, 59
- Djorgovski et al. (1988) Djorgovski, S., de Carvalho, R., & Han, M.-S. in , Astronomical Society of the Pacific Conference Series, Vol. 4, The Extragalactic Distance Scale, ed. S. van den BerghC. J. Pritchet, 329–341
- Downes & Solomon (1998) Downes, D. & Solomon, P. M. 1998, ApJ, 507, 615
- Dunlop et al. (2003) Dunlop, J. S., McLure, R. J., Kukula, M. J., Baum, S. A., O’Dea, C. P., & Hughes, D. H. 2003, MNRAS, 340, 1095
- Dupraz et al. (1990) Dupraz, C., Casoli, F., Combes, F., & Kazes, I. 1990, A&A, 228, L5
- Evans (2009) Evans, A. S. The Starburst-AGN Connection, ed. , W. WangZ. YangZ. Luo & Z. Chen, 35
- Evans et al. (2001) Evans, A. S., Frayer, D. T., Surace, J. A., & Sanders, D. B. 2001, AJ, 121, 1893
- Evans et al. (2009) Evans, A. S., Hines, D. C., Barthel, P., Schneider, G., Surace, J. A., Sanders, D. B., Vavilkin, T., Frayer, D. T., Tacconi, L. J., & Storrie-Lombardi, L. J. 2009, AJ, 138, 262
- Faber et al. (1987) Faber, S. M., Dressler, A., Davies, R. L., Burstein, D., & Lynden-Bell, D. 1987, in Nearly Normal Galaxies. From the Planck Time to the Present, ed. S. M. Faber, 175–183
- Fasano & Franceschini (1987) Fasano, G. & Franceschini, A. 1987, MNRAS, 225, 155
- Feigelson & Babu (1992) Feigelson, E. D. & Babu, G. J. 1992, ApJ, 397, 55
- Feruglio et al. (2010) Feruglio, C., Maiolino, R., Piconcelli, E., Menci, N., Aussel, H., Lamastra, A., & Fiore, F. 2010, A&A, 518, L155+
- Fischer et al. (2010) Fischer, J., Sturm, E., González-Alfonso, E., Graciá-Carpio, J., Hailey-Dunsheath, S., Poglitsch, A., Contursi, A., Lutz, D., Genzel, R., Sternberg, A., Verma, A., & Tacconi, L. 2010, A&A, 518, L41
- Fish (1964) Fish, R. A. 1964, ApJ, 139, 284
- Fisher (1925) Fisher, R. 1925, Statistical Methods for Research Workers (Edinburgh : Oliver & Boyd, 1925)
- Fisher (1990) —. 1990, Statistical Methods, Experimental Design, and Scientific Inference. (University Press, 1990)
- Fitzpatrick (1999) Fitzpatrick, E. L. 1999, PASP, 111, 63
- Floyd et al. (2004) Floyd, D. J. E., Kukula, M. J., Dunlop, J. S., McLure, R. J., Miller, L., Percival, W. J., Baum, S. A., & O’Dea, C. P. 2004, MNRAS, 355, 196
- Frogel et al. (1978) Frogel, J. A., Persson, S. E., Matthews, K., & Aaronson, M. 1978, ApJ, 220, 75
- Genzel et al. (2001) Genzel, R., Tacconi, L. J., Rigopoulou, D., Lutz, D., & Tecza, M. 2001, ApJ, 563, 527
- Gerhard et al. (2001) Gerhard, O., Kronawitter, A., Saglia, R. P., & Bender, R. 2001, AJ, 121, 1936
- Greve et al. (2009) Greve, T. R., Papadopoulos, P. P., Gao, Y., & Radford, S. J. E. 2009, ApJ, 692, 1432
- Guyon et al. (2006) Guyon, O., Sanders, D. B., & Stockton, A. 2006, ApJS, 166, 89
- Haan et al. (2011) Haan, S., Surace, J. A., Armus, L., Evans, A. S., Howell, J. H., Mazzarella, J. M., Kim, D. C., Vavilkin, T., Inami, H., Sanders, D. B., Petric, A., Bridge, C. R., Melbourne, J. L., Charmandaris, V., Diaz-Santos, T., Murphy, E. J., U, V., Stierwalt, S., & Marshall, J. A. 2011, AJ, 141, 100
- Haas et al. (2003) Haas, M., Klaas, U., Müller, S. A. H., Bertoldi, F., Camenzind, M., Chini, R., Krause, O., Lemke, D., Meisenheimer, K., Richards, P. J., & Wilkes, B. J. 2003, A&A, 402, 87
- Haas et al. (2000) Haas, M., Müller, S. A. H., Chini, R., Meisenheimer, K., Klaas, U., Lemke, D., Kreysa, E., & Camenzind, M. 2000, A&A, 354, 453
- Hamabe & Kormendy (1987) Hamabe, M. & Kormendy, J. in , IAU Symposium, Vol. 127, Structure and Dynamics of Elliptical Galaxies, ed. P. T. de ZeeuwS. D. Tremaine, 379
- Hamilton et al. (2002) Hamilton, T. S., Casertano, S., & Turnshek, D. A. 2002, ApJ, 576, 61
- Hamilton et al. (2008) —. 2008, ApJ, 678, 22
- Heckman et al. (1986) Heckman, T. M., Smith, E. P., Baum, S. A., van Breugel, W. J. M., Miley, G. K., Illingworth, G. D., Bothun, G. D., & Balick, B. 1986, ApJ, 311, 526
- Herschel (1786) Herschel, W. 1786, Royal Society of London Philosophical Transactions Series I, 76, 457
- Hibbard & van Gorkom (1996) Hibbard, J. E. & van Gorkom, J. H. 1996, AJ, 111, 655
- Hill et al. (2010) Hill, D. T., Driver, S. P., Cameron, E., Cross, N., Liske, J., & Robotham, A. 2010, MNRAS, 404, 1215
- Hjorth & Madsen (1991) Hjorth, J. & Madsen, J. 1991, MNRAS, 253, 703
- Holmberg (1941) Holmberg, E. 1941, ApJ, 94, 385
- Holtzman et al. (1995) Holtzman, J. A., Hester, J. J., Casertano, S., Trauger, J. T., Watson, A. M., Ballester, G. E., Burrows, C. J., Clarke, J. T., Crisp, D., Evans, R. W., Gallagher, III, J. S., Griffiths, R. E., Hoessel, J. G., Matthews, L. D., Mould, J. R., Scowen, P. A., Stapelfeldt, K. R., & Westphal, J. A. 1995, PASP, 107, 156
- Hooper et al. (1995) Hooper, E. J., Impey, C. D., Foltz, C. B., & Hewett, P. C. 1995, ApJ, 445, 62
- Hopkins et al. (2006) Hopkins, P. F., Hernquist, L., Cox, T. J., Di Matteo, T., Robertson, B., & Springel, V. 2006, ApJS, 163, 1
- Hopkins et al. (2008) Hopkins, P. F., Hernquist, L., Cox, T. J., Dutta, S. N., & Rothberg, B. 2008, ApJ, 679, 156
- Horne (1988) Horne, K. New Directions in Spectrophotometry, ed. , A. G. D. PhilipD. S. Hayes & S. J. Adelman, 145
- Hubble (1930) Hubble, E. P. 1930, ApJ, 71, 231
- Hughes et al. (2000) Hughes, D. H., Kukula, M. J., Dunlop, J. S., & Boroson, T. 2000, MNRAS, 316, 204
- Hutchings & Neff (1988) Hutchings, J. B. & Neff, S. G. 1988, AJ, 96, 1575
- Hutchings & Neff (1992) —. 1992, AJ, 104, 1
- Hyde & Bernardi (2009a) Hyde, J. B. & Bernardi, M. 2009a, MNRAS, 394, 1978
- Hyde & Bernardi (2009b) —. 2009b, MNRAS, 396, 1171
- Impey & Neugebauer (1988) Impey, C. D. & Neugebauer, G. 1988, AJ, 95, 307
- Iono et al. (2005) Iono, D., Yun, M. S., & Ho, P. T. P. 2005, ApJS, 158, 1
- James et al. (1999) James, P., Bate, C., Wells, M., Wright, G., & Doyon, R. 1999, MNRAS, 309, 585
- Jorgensen et al. (1995) Jorgensen, I., Franx, M., & Kjaergaard, P. 1995, MNRAS, 276, 1341
- Jorgensen et al. (1996) —. 1996, MNRAS, 280, 167
- Joseph (1999) Joseph, R. D. 1999, Ap&SS, 266, 321
- Kauffmann et al. (2003) Kauffmann, G., Heckman, T. M., White, S. D. M., Charlot, S., Tremonti, C., Peng, E. W., Seibert, M., Brinkmann, J., Nichol, R. C., SubbaRao, M., & York, D. 2003, MNRAS, 341, 54
- Kennicutt (1998) Kennicutt, Jr., R. C. 1998, ARA&A, 36, 189
- Kim & Sanders (1998) Kim, D. & Sanders, D. B. 1998, ApJS, 119, 41
- Kinney et al. (1996) Kinney, A. L., Calzetti, D., Bohlin, R. C., McQuade, K., Storchi-Bergmann, T., & Schmitt, H. R. 1996, ApJ, 467, 38
- Koornneef et al. (1986) Koornneef, J., Bohlin, R., Buser, R., Horne, K., & Turnshek, D. 1986, Highlights of Astronomy, 7, 833
- Kormendy (1977) Kormendy, J. 1977, ApJ, 218, 333
- Kormendy (1982) Kormendy, J. in , Saas-Fee Advanced Course 12: Morphology and Dynamics of Galaxies, ed. L. MartinetM. Mayor, 113–288
- Laidler et al. (2005) Laidler, V., Bushouse, H., Simon, B., & Bazell, D. 2005
- Letawe et al. (2007) Letawe, G., Magain, P., Courbin, F., Jablonka, P., Jahnke, K., Meylan, G., & Wisotzki, L. 2007, MNRAS, 378, 83
- Lutz (1991) Lutz, D. 1991, A&A, 245, 31
- Lynden-Bell (1967) Lynden-Bell, D. 1967, MNRAS, 136, 101
- MacKenty & Stockton (1984) MacKenty, J. W. & Stockton, A. 1984, ApJ, 283, 64
- Maraston (2005) Maraston, C. 2005, MNRAS, 362, 799
- Maraston et al. (2006) Maraston, C., Daddi, E., Renzini, A., Cimatti, A., Dickinson, M., Papovich, C., Pasquali, A., & Pirzkal, N. 2006, ApJ, 652, 85
- Massey (1951) Massey, F. J. 1951, Journal of the American Statistical Association
- Mathews (1988) Mathews, W. G. 1988, AJ, 95, 1047
- McCall (2004) McCall, M. L. 2004, AJ, 128, 2144
- McLure et al. (1999) McLure, R. J., Kukula, M. J., Dunlop, J. S., Baum, S. A., O’Dea, C. P., & Hughes, D. H. 1999, MNRAS, 308, 377
- Mihos (1999) Mihos, C. 1999, Ap&SS, 266, 195
- Mihos & Hernquist (1994a) Mihos, J. C. & Hernquist, L. 1994a, ApJ, 437, L47
- Mihos & Hernquist (1994b) —. 1994b, ApJ, 431, L9
- Mihos & Hernquist (1996) —. 1996, ApJ, 464, 641
- Miller et al. (1990) Miller, L., Peacock, J. A., & Mead, A. R. G. 1990, MNRAS, 244, 207
- Milvang-Jensen & Jørgensen (1999) Milvang-Jensen, B. & Jørgensen, I. 1999, Baltic Astronomy, 8, 535
- Moshir & et al. (1990) Moshir, M. & et al. 1990, in IRAS Faint Source Catalogue, version 2.0 (1990), 0–+
- Nigoche-Netro et al. (2007) Nigoche-Netro, A., Moles, M., Ruelas-Mayorga, A., Franco-Balderas, A., & Kjørgaard, P. 2007, A&A, 472, 773
- Nigoche-Netro et al. (2008) Nigoche-Netro, A., Ruelas-Mayorga, A., & Franco-Balderas, A. 2008, A&A, 491, 731
- Nigoche-Netro et al. (2009) —. 2009, MNRAS, 392, 1060
- Nolan et al. (2001) Nolan, L. A., Dunlop, J. S., Kukula, M. J., Hughes, D. H., Boroson, T., & Jimenez, R. 2001, MNRAS, 323, 308
- O’Dowd et al. (2002) O’Dowd, M., Urry, C. M., & Scarpa, R. 2002, ApJ, 580, 96
- Pahre (1999) Pahre, M. A. 1999, ApJS, 124, 127
- Pahre et al. (1998a) Pahre, M. A., de Carvalho, R. R., & Djorgovski, S. G. 1998a, AJ, 116, 1606
- Pahre et al. (1998b) Pahre, M. A., Djorgovski, S. G., & de Carvalho, R. R. 1998b, AJ, 116, 1591
- Peacock (1983) Peacock, J. A. 1983, MNRAS, 202, 615
- Pearson & Hartley (1972) Pearson, E. S. & Hartley, H. O. 1972, Biometrika Tables for Statisticians, Vol. 2, 2nd ed., ed. , Vol. 2
- Pease (1917) Pease, F. G. 1917, ApJ, 46, 24
- Pease (1920) —. 1920, ApJ, 51, 276
- Perrine (1922) Perrine, C. D. 1922, MNRAS, 82, 486
- Press et al. (1992) Press, W. H., Teukolsky, S. A., Vetterling, W. T., & Flannery, B. P. 1992, Numerical recipes in FORTRAN. The art of scientific computing (Cambridge: University Press, 1992, 2nd ed.)
- Prestwich et al. (1994) Prestwich, A. H., Joseph, R. D., & Wright, G. S. 1994, ApJ, 422, 73
- Proveda (1958) Proveda, A. 1958, Bal. Obs. Tonantzintla y Tacubaya, 17, 3
- Ramos Almeida et al. (2011) Ramos Almeida, C., Tadhunter, C. N., Inskip, K. J., Morganti, R., Holt, J., & Dicken, D. 2011, MNRAS, 410, 1550
- Reda et al. (2004) Reda, F. M., Forbes, D. A., Beasley, M. A., O’Sullivan, E. J., & Goudfrooij, P. 2004, MNRAS, 354, 851
- Redman & Shirley (1938) Redman, R. O. & Shirley, E. G. 1938, MNRAS, 98, 613
- Richstone & Tremaine (1986) Richstone, D. O. & Tremaine, S. 1986, AJ, 92, 72
- Rix & White (1992) Rix, H. & White, S. D. M. 1992, MNRAS, 254, 389
- Rood et al. (1972) Rood, H. J., Page, T. L., Kintner, E. C., & King, I. R. 1972, ApJ, 175, 627
- Rosse (1850) Rosse, L. 1850, Philosophical Transactions of the Royal Society, 140, 499
- Rothberg (2009) Rothberg, B. 2009, in Astronomical Society of the Pacific Conference Series, Vol. 419, Astronomical Society of the Pacific Conference Series, ed. S. Jogee, I. Marinova, L. Hao, & G. A. Blanc, 273–+
- Rothberg & Fischer (2010a) Rothberg, B. & Fischer, J. Galaxy Wars: Stellar Populations and Star Formation in Interacting Galaxies, ed. , B. SmithJ. HigdonS. Higdon & N. Bastian, 351
- Rothberg & Fischer (2010b) Rothberg, B. & Fischer, J. 2010b, ApJ, 712, 318
- Rothberg & Joseph (2004) Rothberg, B. & Joseph, R. D. 2004, AJ, 128, 2098
- Rothberg & Joseph (2006a) —. 2006a, AJ, 131, 185
- Rothberg & Joseph (2006b) —. 2006b, AJ, 132, 976
- Rupke et al. (2002) Rupke, D. S., Veilleux, S., & Sanders, D. B. 2002, ApJ, 570, 588
- Sanders (1999) Sanders, D. B. 1999, Ap&SS, 266, 331
- Sanders et al. (2003) Sanders, D. B., Mazzarella, J. M., Kim, D.-C., Surace, J. A., & Soifer, B. T. 2003, AJ, 126, 1607
- Sanders & Mirabel (1996) Sanders, D. B. & Mirabel, I. F. 1996, ARA&A, 34, 749
- Sanders et al. (1989a) Sanders, D. B., Phinney, E. S., Neugebauer, G., Soifer, B. T., & Matthews, K. 1989a, ApJ, 347, 29
- Sanders et al. (1989b) Sanders, D. B., Scoville, N. Z., Zensus, A., Soifer, B. T., Wilson, T. L., Zylka, R., & Steppe, H. 1989b, A&A, 213, L5
- Sanders et al. (1988) Sanders, D. B., Soifer, B. T., Elias, J. H., Madore, B. F., Matthews, K., Neugebauer, G., & Scoville, N. Z. 1988, ApJ, 325, 74
- Schlafly & Finkbeiner (2011) Schlafly, E. F. & Finkbeiner, D. P. 2011, ApJ, 737, 103
- Schlegel et al. (1998) Schlegel, D. J., Finkbeiner, D. P., & Davis, M. 1998, ApJ, 500, 525
- Schweizer (1982) Schweizer, F. 1982, ApJ, 252, 455
- Schweizer (1996) —. 1996, AJ, 111, 109
- Schweizer & Seitzer (2007) Schweizer, F. & Seitzer, P. 2007, AJ, 133, 2132
- Scoville et al. (2003) Scoville, N. Z., Frayer, D. T., Schinnerer, E., & Christopher, M. 2003, ApJ, 585, L105
- Scoville et al. (1997) Scoville, N. Z., Yun, M. S., & Bryant, P. M. 1997, ApJ, 484, 702
- Sheinis et al. (2002) Sheinis, A. I., Bolte, M., Epps, H. W., Kibrick, R. I., Miller, J. S., Radovan, M. V., Bigelow, B. C., & Sutin, B. M. 2002, PASP, 114, 851
- Shier & Fischer (1998) Shier, L. M. & Fischer, J. 1998, ApJ, 497, 163
- Shier et al. (1996) Shier, L. M., Rieke, M. J., & Rieke, G. H. 1996, ApJ, 470, 222
- Smith et al. (1995) Smith, D. A., Herter, T., Haynes, M. P., Beichman, C. A., & Gautier, III, T. N. 1995, ApJ, 439, 623
- Soifer et al. (1986) Soifer, B. T., Sanders, D. B., Neugebauer, G., Danielson, G. E., Lonsdale, C. J., Madore, B. F., & Persson, S. E. 1986, ApJ, 303, L41
- Solomon et al. (1992) Solomon, P. M., Downes, D., & Radford, S. J. E. 1992, ApJ, 387, L55
- Solomon et al. (1997) Solomon, P. M., Downes, D., Radford, S. J. E., & Barrett, J. W. 1997, ApJ, 478, 144
- Springel (2000) Springel, V. 2000, MNRAS, 312, 859
- Stephens (1970) Stephens, M. A. 1970, Journal of the Royal Statistical Society. Series B (Methodological), 32, 115 [LINK]
- Stocke et al. (1992) Stocke, J. T., Morris, S. L., Weymann, R. J., & Foltz, C. B. 1992, ApJ, 396, 487
- Sturm et al. (2011) Sturm, E., González-Alfonso, E., Veilleux, S., Fischer, J., Graciá-Carpio, J., Hailey-Dunsheath, S., Contursi, A., Poglitsch, A., Sternberg, A., Davies, R., Genzel, R., Lutz, D., Tacconi, L., Verma, A., Maiolino, R., & de Jong, J. A. 2011, ApJ, 733, L16
- Surace et al. (1998) Surace, J. A., Sanders, D. B., Vacca, W. D., Veilleux, S., & Mazzarella, J. M. 1998, ApJ, 492, 116
- Tacconi et al. (2002) Tacconi, L. J., Genzel, R., Lutz, D., Rigopoulou, D., Baker, A. J., Iserlohe, C., & Tecza, M. 2002, ApJ, 580, 73
- Tadhunter et al. (2011) Tadhunter, C., Holt, J., González Delgado, R., Rodríguez Zaurín, J., Villar-Martín, M., Morganti, R., Emonts, B., Ramos Almeida, C., & Inskip, K. 2011, MNRAS, 412, 960
- Tolman (1930) Tolman, R. C. 1930, Proceedings of the National Academy of Science, 16, 511
- Tonry & Davis (1981) Tonry, J. L. & Davis, M. 1981, ApJ, 246, 680
- Toomre (1977) Toomre, A. 1977, in Evolution of Galaxies and Stellar Populations, p. 401
- Toomre & Toomre (1972) Toomre, A. & Toomre, J. 1972, ApJ, 178, 623
- Trentham et al. (1999) Trentham, N., Kormendy, J., & Sanders, D. B. 1999, AJ, 117, 2152
- Tukey (1958) Tukey, J. W. 1958, The Annals of Mathematical Statistics
- van der Marel & Franx (1993) van der Marel, R. P. & Franx, M. 1993, ApJ, 407, 525
- Vanderbeke et al. (2011) Vanderbeke, J., Baes, M., Romanowsky, A. J., & Schmidtobreick, L. 2011, MNRAS, 412, 2017
- Veilleux et al. (2009) Veilleux, S., Kim, D., Rupke, D. S. N., Peng, C. Y., Tacconi, L. J., Genzel, R., Lutz, D., Sturm, E., Contursi, A., Schweitzer, M., Dasyra, K. M., Ho, L. C., Sanders, D. B., & Burkert, A. 2009, ApJ, 701, 587
- Veilleux et al. (2002) Veilleux, S., Kim, D., & Sanders, D. B. 2002, ApJS, 143, 315
- Veilleux et al. (2006) Veilleux, S., Kim, D.-C., Peng, C. Y., Ho, L. C., Tacconi, L. J., Dasyra, K. M., Genzel, R., Lutz, D., & Sanders, D. B. 2006, ApJ, 643, 707
- Wang et al. (1991) Wang, Z., Scoville, N. Z., & Sanders, D. B. 1991, ApJ, 368, 112
- Whitmore et al. (1993) Whitmore, B. C., Schweizer, F., Leitherer, C., Borne, K., & Robert, C. 1993, AJ, 106, 1354
- Wold et al. (2010) Wold, I., Sheinis, A. I., Wolf, M. J., & Hooper, E. J. 2010, MNRAS, 408, 713
- Wolf & Sheinis (2008) Wolf, M. J. & Sheinis, A. I. 2008, AJ, 136, 1587
- Wright (1972) Wright, A. E. 1972, MNRAS, 157, 309
- Wright et al. (1990) Wright, G. S., James, P. A., Joseph, R. D., & McLean, I. S. 1990, Nature, 344, 417
- Xia et al. (2012) Xia, X. Y., Gao, Y., Hao, C.-N., Tan, Q. H., Mao, S., Omont, A., Flaquer, B. O., Leon, S., & Cox, P. 2012, ApJ, 750, 92
- Yip et al. (2004) Yip, C. W., Connolly, A. J., Szalay, A. S., Budavári, T., SubbaRao, M., Frieman, J. A., Nichol, R. C., Hopkins, A. M., York, D. G., Okamura, S., Brinkmann, J., Csabai, I., Thakar, A. R., Fukugita, M., & Ivezić, Ž. 2004, AJ, 128, 585
- York (2000) York, D. G. e. a. 2000, AJ, 120, 1579
- Yun et al. (2001) Yun, M. S., Reddy, N. A., & Condon, J. J. 2001, ApJ, 554, 803
- Zwicky (1956) Zwicky, F. 1956, Ergebnisse der exakten Naturwissenschaften, 29, 344