A characterization of the diffuse Galactic emissions at large angular scales using the Tenerife data
Abstract
The Anomalous microwave emission (AME) has been proved to be an important component of the Galactic diffuse emission in the range from 20 to 60 GHz.
To discriminate between different models of AME low frequency microwave data from 10 to 20 GHz are needed. We present here a re-analysis of published and un-published Tenerife
data from 10 to 33 GHz at large angular scales (from 5 to 15 degrees). We cross-correlate the Tenerife data to templates of the main Galactic diffuse emissions: synchrotron, free-free and thermal dust.
We find evidence of dust correlated emission in the Tenerife data that could be explained as spinning dust grain emission.
1 Introduction
The anomalous microwave emission (AME) is an important contributor of the Galactic diffuse emission in the range from
20 to 60 GHz. It was first identified by (Leitch et al., 1997) as
free-free emission from electrons with temperature, K. Draine & Lazarian (1998a)
argued that AME may result from electric dipole radiation due to small
rotating grains, the so-called spinning dust. Models of the spinning dust emission (Draine & Lazarian, 1998b)
show that an emissivity spectrum peaking at around 20-50 GHz is able to reproduce the observations (Finkbeiner, 2003; de Oliveira-Costa et al., 2004; Watson et al., 2005; Iglesias-Groth, 2005; Casassus et al., 2006; Casassus et al., 2008; Dickinson et al., 2009; Tibbs et al., 2010). The initial spinning dust model has been
refined regarding the shape and rotational properties of the dust
grains (Ali-Haïmoud et al., 2009; Hoang et al., 2010; Hoang et al., 2011; Silsbee et al., 2011). An alternative explanations of AME was proposed by
Draine & Lazarian (1999) based on magnetic dipole radiation arising from hot
ferromagnetic grains.
Observations have placed limits of a few per cent on the fractional polarization towards AME targets (Battistelli et al., 2006; Casassus et al., 2006; Kogut, 2007; Mason et al., 2009; Lòpez-Caraballo et al., 2011). This excludes perfectly-aligned single-domain magnetic grains, however other alignments and grain compositions produce similarly low levels of polarization (Draine & Hensley, 2012).
.
A correlation between microwave and infrared maps, mainly dominated by dust thermal emission (Désert et al., 1990),
was observed for various experiments, for example
on COBE/DMR (Kogut et al., 1996a; Kogut et al., 1996b), OVRO (Leitch et al., 1997),
Saskatoon (de Oliveira-Costa et al., 1997), survey at 19 GHz (de Oliveira-Costa et al., 1998),
Tenerife (de Oliveira-Costa et al., 1999). A similar signal was find in compact regions
by (Finkbeiner, 2003) and in some molecular clouds based on data from
COSMOSOMAS (Génova-Santos et al., 2011; Watson et al., 2005), AMI (Ami-Consortium: Scaife
et al., 2009a; Ami-Consortium: Scaife
et al., 2009b),
CBI (Casassus et al., 2006; Castellanos et al., 2011), VSA (Tibbs et al., 2010) and
Planck (Planck-Collaboration, 2011). A recent study of the Small Magellanic Cloud also claims a detection of AME
(Bot et al., 2010).
Independently, Bennett et al. (2003) proposed an alternative explanation of AME based on
flat-spectrum synchrotron emission associated to star-forming
regions to explain part of the WMAP first-year observations. This
hypothesis seems to be in disagreement with results from de Oliveira-Costa et al. (2004); Fernández-Cerezo et al. (2006); Hildebrandt et al. (2007); Ysard et al. (2010) which showed that spinning dust
best explained the excess below 20 GHz. Furthermore,
Davies et al. (2006) showed the existence of important correlation between microwave and
infrared emission in regions outside star-forming areas. More recently,
Kogut et al. (2011) discussed the fact that spinning dust fits better to
ARCADE data (3.8 and 10 GHz) than a flat-spectrum synchrotron.
To discriminate between the different AME models and from alternative explanations such as those discussed above low frequency microwave data in the range from 10 to 20 GHz at different angular resolutions are needed. Indeed in this frequency range we expect the AME spectrum to be significantly distinct from magnetic dust and flat-spectrum synchrotron. At this respect the Tenerife data set, from 10 to 33 GHz and at large angular scales (from 5 to 15 degrees), is unique. We present in the following a re-analysis of these data including previously published data Gutiérrez et al. (2000) and un-published data since January 1998 to December 2000. The paper is structured as follows. Section 2 presents the Tenerife data and discuss the re-processing of these data. In Section 3 we describe the main Galactic emission mechanisms and the associated templates used in the analysis. Section 4 discusses the point-source contribution to the Tenerife data. In Section 5 we present the cross correlation between the Tenerife data and the Galactic templates are presented. The main results are discussed in Section 6. Finally we draw conclusions in Section 7.
keywords
ISM: general – ISM: clouds – Methods: data analysis – Cosmology: observations – Submillimeter – Catalogs August 24, 2026(1) LPSC, Université Joseph Fourier Grenoble 1, CNRS/IN2P3, Institut National Polytechnique de Grenoble, 53 avenue des Martyrs, 38026 Grenoble cedex, France
(2) Jodrell Bank Centre for Astrophysics, Alan Turing Building, School of Physics and Astronomy, The University of Manchester, Oxford Road, Manchester, M13 9PL, U.K.
(2) Instituto de Astrofísica de Canarias, C/ Vía Láctea s/n, La Laguna, 65 Tenerife, Spain
2 The Tenerife data


The Tenerife experiment observed unidimensional scans at constant declination at 10, 15 and
33 GHz using a triple beam pattern of FWHM and of beam spacing. The region of the sky centered at declination was chosen for observations
because it corresponds to the largest area of the sky at high latitudes
where contamination from foregrounds is a minimum.
To reconstruct 2D maps of the sky, consecutive declinations separated by half the beamwidth
() are observed. Each single declination is repeatedly observed
until sufficient sensitivity and full RA coverage is achieved.
The scheduling of the observations
takes into account the position of the Sun so that its contribution to the data
is a minimum. This requires observations of the same declination at different times of the year
for full RA coverage. Observations were performed day and night. Day-time observations
present an increase in total power and noise with respect to night-time observations due
to receiver gain changes. In extreme cases, data observed at day time have to be removed.
The atmospheric contribution to the data depends on frequency, being severe at 33 GHz
and relatively small at 10 GHz. The observing efficiency depends mainly on the weather
conditions. Data strongly affected by atmospheric contamination cannot be used.
In addition, technical problems such as power cutoff, warmed and oscillating HEMT amplifiers,
RF interference, failure in the electronic systems, etc. can also affect the data.
At 10 and 15 GHz more than of the observed data are useful. However, at 33 GHz only
about of data are kept, due mainly to atmospheric effects.
We use in the following the full Tenerife data set which includes new data (taken from January 1998 to December 200) with respect to previously published releases (see for example Gutiérrez et al. (2000); Hancock et al. (1994) ). These data have been completely reprocessed including hand editing to remove clearly systematic contaminated regions and accurate removal of the atmospheric emission using a MEM based baseline removal technique as described in Gutiérrez et al. (2000). The latter has been improved to enlarge the sky region for which atmospheric residuals are negligible. In particular, this allows us to consider in the following analysis regions at low Galactic latitudes. Figures 1, 2 and 3 present the cleaned Tenerife data at 10, 15 and 33 GHz respectively. The main properties of these clean data: central declination of the scan, mean temperature, mean noise per beam and r.m.s per 1∘ pixel in the RA interval to are presented in Tables 1,2 and 3 for the 10, 15 and 33 GHz channels respectively.
| Declination (deg) | Mean T ( K) | ( K) | r.m.s (K) |
|---|---|---|---|
| 30.0 | -3.7 | 52.9 | 150.5 |
| 32.5 | -5.0 | 45.9 | 147.8 |
| 35.0 | 10.0 | 47.1 | 140.5 |
| 37.5 | 7.5 | 51.0 | 153.1 |
| 40.0 | 13.6 | 49.6 | 147.4 |
| 42.5 | 7.9 | 54.1 | 146.0 |
| 45.0 | -7.8 | 59.2 | 215.5 |
| Declination | Mean T ( K) | ( K) | r.m.s (K) |
|---|---|---|---|
| 25.0 | 3.6 | 18.1 | 51.7 |
| 27.5 | 4.6 | 16.3 | 48.7 |
| 30.0 | 3.4 | 19.3 | 61.1 |
| 32.5 | 3.9 | 22.7 | 67.2 |
| 35.0 | 0.25 | 20.6 | 74.6 |
| 37.5 | 8.3 | 22.4 | 78.6 |
| 40.0 | 7.8 | 20.7 | 75.7 |
| 42.5 | 5.0 | 22.6 | 81.3 |
| 45.0 | -8.2 | 21.3 | 75.8 |
| 47.5 | -5.9 | 19.3 | 70.5 |
| Declination | Mean T (K) | (K) | r.m.s (K) |
|---|---|---|---|
| 40.0 | -3.1 | 27.2 | 80.8 |
| 42.5 | 0.2 | 43.7 | 167.7 |

3 Galactic diffuse emission.
We present in this section the main known Galactic diffuse mechanisms: synchrotron, free-free, and vibrational and rotational dust.
3.1 Synchrotron
Synchrotron emission results from cosmic-ray electrons accelerated in magnetic fields, and thus, depends on the energy spectrum of the electrons and the intensity of the magnetic field (Ribicki & Lightman, 1979; Longair, 1994). The local energy spectrum of the electrons has been measured to be, for energies contributing to the observed radio synchrotron emission, a power law to good approximation with index from about -2.7 to -3.3 over this energy range (De Zotti et al., 1999). Such an increase of energy spectrum slope is expected, as the energy loss mechanism for electrons increases as the square of the energy.
Radio surveys at frequencies less than 2 GHz are dominated by synchrotron emission
(Lawson et al., 1987). The only all-sky survey available at these frequencies
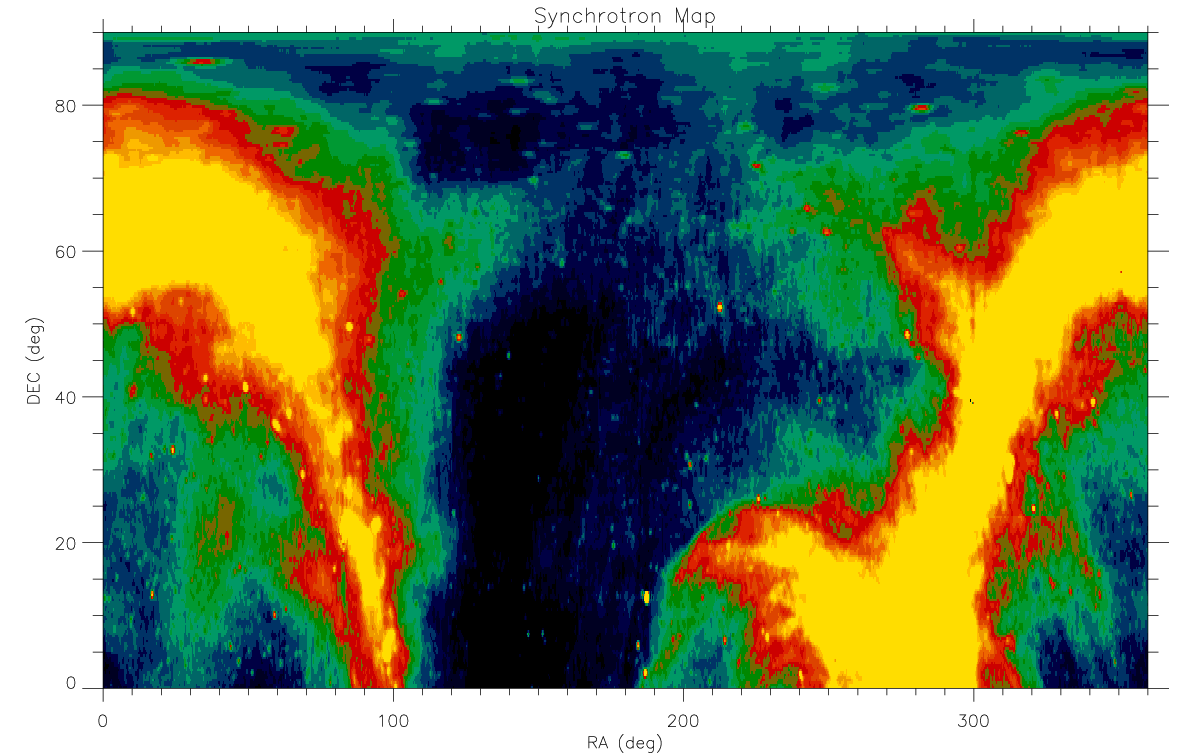
is the 408 MHz map (Haslam et al., 1981). This survey has a resolution of
and was produced using the Parkes 64-m telescope in Australia for the southern sky and the
Bonn 100m and Jodrell Bank MK1A telescopes for the northern sky. The scanning strategy with the
Bonn telescope was to fix the azimuth at the local meridian and scan up and down in
elevation at a rate of about min. This technique reduced
the atmospheric contribution to the map but led to a set of vertical stripes (constant RA)
separated by . The quoted errors in the temperature scale are of the order of
and K in the absolute brightness temperature levels.
In addition there is the 1420 MHz survey (Reich & Reich, 1988) which covers the declination range to and has a FWHM of . Stripes are also present in this map due to the scanning strategy which consisted of azimuthal scans at constant elevation. The errors in the temperature scale are of the order of and K in the absolute brightness temperature.
The 408 MHz and 1420 MHz maps have been used to determine the synchrotron spectral index at radio frequencies (Reich & Reich, 1988; Davies et al., 1996). Assuming and after destriping and correction for zero levels, spectral indexes, , in the range to were found. The spatial angular power spectrum of the synchrotron emission is poorly understood but is believed to be (Bouchet & Gispert, 1999). At high Galactic latitudes in the region observed by the Tenerife experiment the synchrotron spatial angular power spectrum is slightly flatter than (Lasenby, 1996). In the following sections, we will use the destriped version of the 408 MHz map (Davies et al., 1996) as a template of the synchrotron emission. This map is shown on Figure 4.
3.2 Free-Free
When a charged particle is accelerated in a Coulomb field it will emit radiation which is called
braking radiation or Bremsstrahlung.
The Galactic free-free emission is the thermal bremsstrahlung from hot electrons ( K )
produced in the interstellar gas by the UV radiation field (De Zotti et al., 1999).
This emission is not easily identified at radio frequencies, except near the Galactic plane.
At higher latitudes it must be separated from synchrotron emission
by virtue of their different spectral indices, since the spectral index of optically thin free-free emission is .
The diffuse Galactic recombination radiation, Hα is a good tracer of free-free emission since both are emitted in the same Warm Ionised Medium (WIM) and both have intensities proportional to the emission measure,
| (1) |
The ratio of free-free brightness temperature to the Hα surface brightness in R (Rayleigh) is (Valls-Gabaud, 1998)
| (2) |
where is the observing frequency in GHz, is the temperature of the electrons in units of 104 K , and the last factor corresponds to helium which is assumed completely ionised and creates free-free emission like hydrogen but does not emit Hα light.
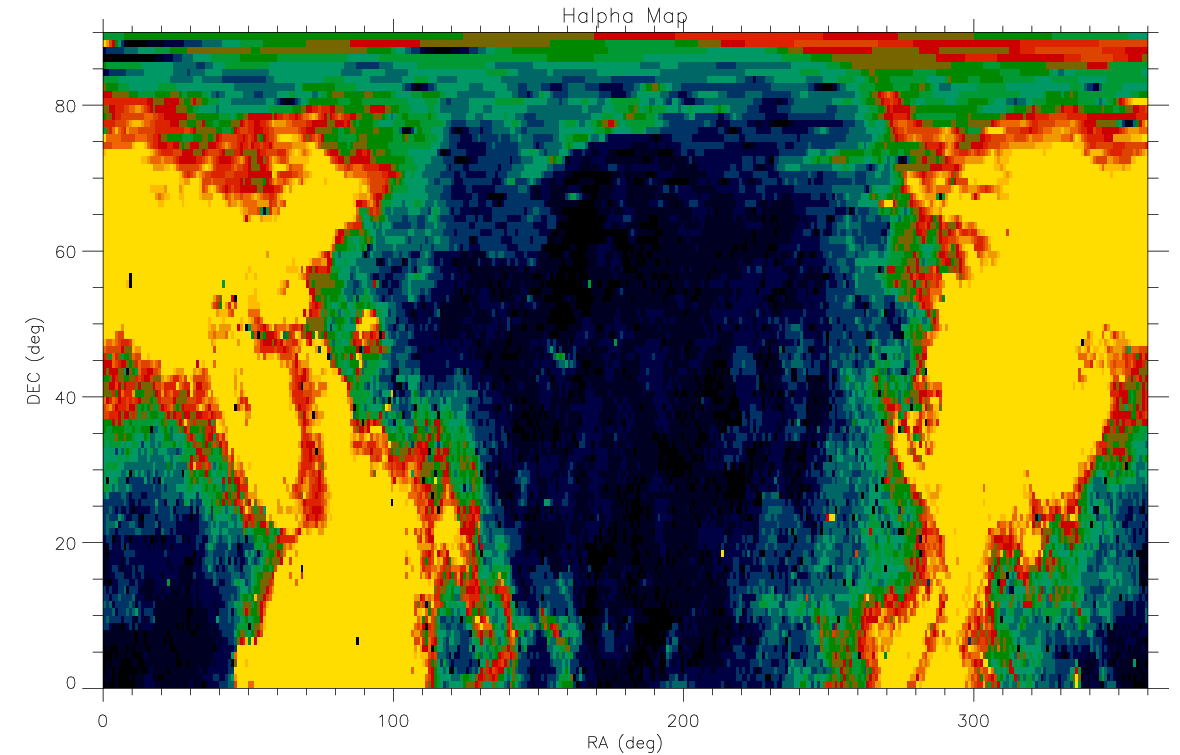
Recently a full sky survey of Hα light has been released by the WHAM (Wisconsin Hα Mapper) collaboration (Haffner et al., 1999). The WHAM instrument consists of a 6 inch dual-etalon Fabry-Perot spectrometer with a narrow band filter of FWHM Åwhich images onto a cryogenically cooled 1024 x 1024 CCD. The resolution of the survey is . The spatial power spectrum of free-free emission has not yet been determined from the WHAM map however analysis of Hα images of the North Celestial Pole Area (Veeraraghavan & Davies, 1997) suggests .
In Figure 4 we present a map of the northern sky produced by the WHAM survey. In the following sections we will use this map as a template for the free-free emission. At intermediate Galactic latitudes (say ) about 10 of the Hα light is absorbed by dust and therefore estimates of free-free emission from Hα will be systematically lower than the true value. At latitudes below 10∘ this correction becomes increasingly uncertain.
3.3 Vibrational Dust
At the higher frequency range ( 100 GHz) of the microwave background experiments, dust emission starts to become dominant. Dust grains are heated by interstellar radiation, absorbing optical and UV photons and emitting energy in the far infrared.
The intensity of the emission from an ensemble of dust grains is given by
| (3) |
where is the emissivity at frequency , and the integral is along the line of sight. In the Rayleigh–Jeans regime and assuming a constant line-of-sight density of dust,
| (4) |
where is the brightness temperature of the dust emission.
The spectrum of the dust emission has been measured at millimeter and submillimeter wavelengths by the Far-Infrared Absolute Spectrophotometer (FIRAS) and can be fitted by a single greybody spectrum of temperature K and emissivity (Boulanger et al., 1996) at high Galactic latitudes. From IRAS observations of dust emission (Gautier et al., 1992), it was found that the spatial power spectrum of the dust fluctuations is . This has also been confirmed at larger angular scales by the COBE-DIRBE satellite.
In the following sections we will use the combined IRAS-DIRBE map at 100 m (Schlegel et al., 1998) as a template for the dust emission. This map has resolution of FWHM arcmin and covers the full sky. Zodiacal light and point sources have been removed from the map and the regions of the sky which were not observed by the IRAS satellite have been replaced by DIRBE data. The combined map preserves the DIRBE zero point and calibration. This map is in units of MJy/sr. In Figure 4 we present the northern sky part of the combined IRAS-DIRBE map.
3.4 Rotational Dust.
Small spinning interstellar dust grains containing – atoms can produce detectable rotational emission in the 10–100 GHz range. This emission depends on the component of the electric dipole moment perpendicular to the angular velocity of the grain and on the physical properties of the interstellar medium (Draine & Lazarian, 1998). For these small grains, rotational excitation is dominated by direct collisions with ions and plasma drag. The very smallest grains () have their rotation damped primarily by electric dipole emission; for 150 N plasma drag dominates.
In the following sections, we show models for the spectrum of the spinning dust emission provided by Dr. Draine (private communication). These models depend on a large set of parameters such as the distribution of grain sizes, the charge of the grains, the composition of the grains and the physical properties of the interstellar medium which were fixed by the authors. However, the normalization of the model can be assumed a free parameter although it is related to the hydrogen column density in the interstellar medium which is of the order of a few times .
The spatial distribution of small dust grains is not well-known although it seems reasonable to believe that it is not different from that of larger grains but for dense regions where dust coagulation may deplete small grains. For the purpose of this work we will use the IRAS-DIRBE 100 m map as a template for the spinning dust grains.
4 Galactic and Extra-Galactic point sources.
The contribution from resolved point sources to the Tenerife data at 10 and 15 GHz was extrapolated from data of the Michigan monitoring program (M. Aller and H. Aller 2000, private communication). The Michigan program regularly monitors point sources with fluxes above Jy at 4.8, 8.0 and 14.5 GHz. The Michigan catalog is neither complete in flux or time domain. Well-known strong variable sources such as 3C345 are regularly observed and data at all observing frequencies are available. Weak sources are poorly observed and often data are available at a single frequency of the three possible. Further, data are available up to June 1999 while the Tenerife experiment operated until September 2000. For the 33 GHz Tenerife data we used the Metsahovi catalog (Metsahovi group, private communication) which regularly monitors sources above Jy at 22 and 37 GHz. This catalog is neither complete in flux or time although observations are available up to January 2000.
We have developed software to produce time and frequency complete point source catalogs. The flux of the sources for each frequency was interpolated in time by fitting Fourier Series to the data. If the number of independent observations per frequency was smaller than 10, the sources were assumed not variable and the data was fitted to a constant with time. The extrapolation of the source fluxes into the future time was performed assuming no variability since last observed data point. Spectral indices were calculated for each source from the available data. If only observations at a single frequency were available we assumed a flat spectrum. We constructed four point source catalogs at 10, 13, 15 and 33 GHz covering the time range January 1984 to December 2000 with one Julian day sampling and a flux limit of about 0.5 Jy.
For each single day of observations with the Tenerife radiometers we estimated the total contribution from point sources to the data. This contribution was calculated from the extrapolated catalog at 10, 15 and 33 GHz and the flux, , was converted into antenna temperature, , using (Rohlfs & Wilson, 2000)
| (5) |
where is the beam solid angle and the wavelength. The daily point source contributions were stacked in the same manner as the Tenerife data and subtracted from the Tenerife stacks. In the left column of figure 5 we plot the Tenerife stacked data at 15 GHz for the 10 declinations presented in this paper and overplot in green the contribution from point sources to the data. In the right column, we plot the stacks after subtraction of the point sources.

4.0.1 Unresolved sources.
A study of the contribution of unresolved point sources (ie. weak point sources not detected individually) to CMB experiments has been produced by Franceschini et al. (1989). They used numerous surveys, including VLA and IRAS data, to put limits on the contribution to single beam CMB experiments by a random distribution of point sources. The contribution from unresolved point sources to the Tenerife data deduced from the previous analysis is presented in table 4. We consider sources with flux under 1 Jy at 5 GHz and a main beam of 5∘.
| (GHz) | (K) |
|---|---|
| 10 | K |
| 15 | K |
| 33 | K |
5 Assessment of the Galactic contribution to the Tenerife data.
To assess Galactic contribution to the Tenerife data, we correlated observations with the Galactic synchrotron, dust and Hα emission templates described in the previous sections. We convolved the foreground maps with the Tenerife beam at each of the Tenerife frequencies before the correlation was performed. The Tenerife data used in the correlation are the final stacked data presented in Section 2. At 15 GHz we used ten declination stacks in the range ; seven declination stacks at 10 GHz in the range ; and only two declination stacks at 33 GHz covering declinations and . The data were processed so that data at were excluded from the baseline fit and therefore were neither stacked or reconstructed. The discrete point sources were subtracted from the Tenerife stacks as discussed in the previous section.
5.1 The Method
To simultaneously correlate the Tenerife data to the three Galactic templates we use a method which was first applied to this problem by Gorski et al. (1996) to fit Galactic and extra-Galactic templates in Fourier space to the COBE-DMR data. This method was applied to the Tenerife data first by de Oliveira-Costa et al. (1999) and then by Mukherjee et al. (2001) to study the possible emission of spinning dust at the Tenerife frequencies.
Assuming that the microwave data is a superposition of CMB, noise and Galactic components, we can write
| (6) |
where y is a Tenerife data vector of N pixels; X is an element matrix containing foreground templates convolved with the Tenerife beam; is a vector of size that represents the levels at which these foreground templates are present in the Tenerife data - correlation coefficients for each foreground template; is the instrumental noise in the data; and is the CMB component of the data. For this analysis we assume the noise and CMB to be uncorrelated.
The minimum variance estimate of is given by
| (7) |
with errors given by where is given as
| (8) |
In the above, C is the total covariance matrix, the sum of the noise covariance matrix and CMB covariance matrix. The noise covariance matrix of the Tenerife data is taken to be diagonal - no correlation between different pixels. The CMB covariance matrix was obtained analytically following Zaldarriaga (1995).
This correlation method produces minimum variance and unbiased estimates of if the following holds
- •
The error in the Tenerife data is Gaussian and with zero mean. To a very good approximation the instrumental noise in the Tenerife data is uncorrelated.
- •
The templates perfectly trace the foreground emissions at microwave frequencies. There may be components of emission present in the Tenerife data, apart from those we have identified, for which there are not obvious counterparts at other frequencies. Moreover, the templates we use do not perfectly trace the microwave emission of the Galactic foreground. The latter is specially important in the case of vibrational and rotational dust for which the template comes from data at much higher frequencies. For example, Draine & Lazarian (1998) proposed a m map would be a much better tracer of rotational dust emission because small grains will also emit at this frequency. Also, the Hα emission is absorbed at low Galactic latitudes by interstellar dust and therefore does not fully trace the free-free emission at those latitudes. Moreover, the 408 MHz map has residual striping.
- •
The templates are perfect – error bars equal to zero. The error estimated for the templates are about 5 – 10 % of the signal. They are not corrected for in this analysis because they are small compared to the errors in the Tenerife data.
- •
The templates are not correlated. It there is correlation between the different templates the set of minimum variance correlation coefficients is degenerate and therefore we would not be able to discriminate among the different foreground components. At low Galactic latitudes, the Galactic plane emission dominates and Mukherjee et al. (2001) have found the foreground templates are correlated in this region.
- •
The correlation coefficient is the same throughout the area of sky for which the correlation is performed. If it is not, the error associated with is systematically underestimated. As a double check, we divided the sky observed, into independent areas and performed the same correlation test in each, calculating a mean correlation coefficient and the dispersion of the individual values which in most cases was in good agreement with the error of calculated for the total area.
5.2 Cross-Correlation results.
The cross-correlation results are presented in table 5. The correlation was performed for three different Galactic cuts , and . represents the r.m.s. of the Galactic maps after convolution with the Tenerife beam. and are the correlation coefficient and the error associated with it. They have units of K/K, K/(MJy sr-1) and K/R for the correlation with the 408 MHz, 100 m and WHAM maps respectively. is the r.m.s. contribution from the Galactic foregrounds to the Tenerife data, which was obtained as . This analysis is improved with respect to previous analyses by de Oliveira-Costa et al. (1999) and Mukherjee et al. (2001) first, because we present Tenerife data at 10 and 15 GHz for a much larger area of the sky and with improved sensitivity, and second, because we also include in the cross-correlation a template for the free-free emission. Moreover, data at 33 GHz have also been included in the analysis although the area of the sky observed is significantly smaller than at 10 and 15 GHz and consequently the error bars in the estimated cross-correlation coefficients much larger.
| Galactic cut | (GHz) | (K) | |||
|---|---|---|---|---|---|
| 408 MHz | 1.0217 | ||||
| 10 GHz | 100 m | 0.3256 | |||
| WHAM | 0.2513 | ||||
| 408 MHz | 1.0244 | ||||
| 15 GHz | 100 m | 0.3308 | |||
| WHAM | 0.2758 | ||||
| 408 MHz | 0.8904 | ||||
| 33 GHz | 100 m | 0.3089 | |||
| WHAM | 0.2768 | ||||
| 408 MHz | 0.8722 | ||||
| 10 GHz | 100 m | 0.2028 | |||
| WHAM | 0.1435 | ||||
| 408 MHz | 0.8544 | ||||
| 15 GHz | 100 m | 0.2036 | |||
| WHAM | 0.1504 | ||||
| 408 MHz | 0.7749 | ||||
| 33 GHz | 100 m | 0.2143 | |||
| WHAM | 0.1473 | ||||
| 408 MHz | 0.7676 | ||||
| 10 GHz | 100 m | 0.1898 | |||
| WHAM | 0.1292 | ||||
| 408 MHz | 0.7412 | ||||
| 15 GHz | 100 m | 0.1782 | |||
| WHAM | 0.1354 | ||||
| 408 MHz | 0.6630 | ||||
| 33 GHz | 100 m | 0.2138 | |||
| WHAM | 0.1499 | ||||
We have pictorially summarised the cross-correlation results in figure 6. In the top row of the figure we plot the r.m.s. contribution from synchrotron to the Tenerife data at the three Galactic cuts analysed. In black, we overplot the expected synchrotron contribution for a spectral index of and derived from the r.m.s. level in the 408 MHz map. The contributions are systematically lower than expected at 10 GHz and the spectral index is much flatter such that for example the contribution at 15 GHz is consistent with that at 10 GHz for . We have derived from the Tenerife data spectral indexes of , and at , and respectively, and the r.m.s contributions based on these spectral indices is overplotted in red.
In the middle row we plot the r.m.s. contribution from free-free emission to the Tenerife data. In black, we overplot the expected free-free emission at microwave frequencies derived from equation 2 which are actually in very good agreement with the observations. In red, we plot the free-free contribution for spectral indexes of , and at , and respectively.
In the bottom row of figure 6 we plot the r.m.s. contribution from dust emission to the Tenerife data which is significantly larger (few orders of magnitude) than expected from vibrational dust. In solid black we overplot a r.m.s brightness temperature expected from the CNM model of rotational dust proposed by Draine & Lazarian (1998). The models were rescaled to fit the data. The intensity spectrum for this model peaks at 50 GHz which corresponds to a peak in brightness temperature around 20 GHz of about 300 K. From the best fit model to the data we have estimated fluctuations in the temperature of the rotational dust of at the angular scales of the Tenerife experiment.
The r.m.s. contributions from dust to the 15 GHz data at and , as well
as the contribution from free-free at seem to be underestimated. This could be
caused by correlations between the synchrotron, dust and free-free templates which
would reduce the validity of the minimum variance solution and could bias the estimates of the
correlation.
In figure 7, we plot the following correlations, from top to bottom
synchrotron vs dust; free-free vs dust
and free-free vs synchrotron for , and . We observe no correlation
between free-free and synchrotron, moderate correlation between free-free and dust
and a quite strong correlation between synchrotron and dust at low Galactic latitudes
weakening down at high latitudes. Note that at , the correlation plots
show negative vs. negative points which do not follow the correlation pattern of the
main body of points. The former points correspond to the lowest Galactic latitude data which
run into a negative beam of the triple beam pattern for the Galactic plane crossing.
The observed correlations between templates can not justify the observed lack of
dust correlation at 15 GHz data at and .
In the following we concentrate on the region for which we detect
significant dust correlated signal at all Tenerife frequencies.


6 Dust-correlated emission.
Kogut et al. (1996) cross-correlated the COBE Differential Microwave Radiometer (DMR) maps with DIRBE far-infrared maps and discovered that statistically significant correlation did exist at each DMR frequency, which was inconsistent with vibrational dust alone. This extra correlation was explained at the time as free-free emission. Following this publication, other authors have cross-correlated CMB data sets with dust templates and found an excess of correlation which has been interpreted as free-free emission, flat-spectrum synchrotron or emission from spinning dust. In table 6 we present an up-to-date list of CMB data for which the correlation with dust has been performed. In all cases, a multi-template method has been used to perform the correlation but no free-free template has been used. We have also added in this table previous analyses of the Tenerife data by de Oliveira-Costa et al. (1999) and Mukherjee et al. (2001) which did not include the 33 GHz data and covered a much smaller area of the sky at 10 and 15 GHz.
The correlation coefficients we deduced are significantly smaller at
than those calculated by de Oliveira-Costa et al. (1999) and Mukherjee et al. (2001). This is probably
due to 50 % larger area (localized signals are diluted) and a more careful subtraction of baselines at low Galactic latitudes
in our data. The inclusion of an extra free-free template seems to play minor role on this at 10 GHz and none at 15 GHz.
The cross-correlation results for the Tenerife experiment presented in this paper confirm the existence of extra dust-correlated emission at microwave frequencies and suggest that it is not due to free-free emission. The moderate correlation found between the dust and free-free templates could confuse the results obtained but clearly cannot account for all the observed dust-correlated component. A more detailed study is needed to take into account correlations between templates in the calculation of the correlation coefficients.
In figure 8 we plot the dust cross-correlation coefficients ( ) for the Tenerife (diamonds) and COBE-DMR (triangles) data. The rest of the experiments presented in table 6 were not included in this plot because they observe at different angular scales and different areas of the sky (see table for details) and therefore no direct comparison with the Tenerife and COBE data is possible. The Tenerife data suggest a peak in the spectrum at about 30 GHz although this is mainly based on the data at 33 GHz which is significantly much noisier and cover a much smaller part of the sky. However DMR data combined with the 10 and 15 GHz Tenerife data points prefer a peak in the range 15-20 GHz. In color, we overplot the six spinning dust models proposed by Draine & Lazarian (1998) combined with the standard vibrational dust model described in the previous sections, for which the amplitude has been taken as a free parameter and fitted to the COBE and Tenerife 10 and 15 GHz data. We observe that the shape of the spectrum given by the data is similar to some of the predicted spectra although the models do not indicate a sharp rise in the range 10-15 GHz.

7 Conclusions
We have presented in this paper a re-analysis of the Tenerife data including previously published data and new data from January 1998 to December 2000. This analysis leads to evidences for an excess of dust-correlated emission at microwave frequencies in the range 10–33 GHz and at large angular scales, from 5 to 15 degrees. This correlation can not all be associated with free-free emission. A combination of the Tenerife and COBE data suggests spinning dust emission could account for the extra correlation. However, the scatter observed in the data and the discrepancy in the spectrum shape indicate other components may also be responsible for the extra correlation. Furthermore, the analysis does not take into account correlations between the Galactic emission templates and this can bias the estimate of the correlation coefficients. To correct for this a more detailed analysis, which will account for the cross-correlation between templates, is needed.
acknowledgements
The authors would like to thanks the editors of this special issue.
References
- Ali-Haïmoud et al. (2009) Ali-Haïmoud, Y., Hirata, C. M., & Dickinson, C. 2009, MNRAS, 395, 1055
- Ami-Consortium: Scaife et al. (2009a) Ami-Consortium: Scaife, A. M. M., Hurley-Walker, N., & Green, D. A. 2009a, MNRAS, 394, 46
- Ami-Consortium: Scaife et al. (2009b) Ami-Consortium: Scaife, A. M. M., Hurley-Walker, N., & Green, D. A. 2009b, MNRAS, 400, 1394
- Battistelli et al. (2006) Battistelli, E. S., Rebolo, R., & Rubinño Martín, J. 2006, ApJ, 645, 141
- Bennett et al. (2003) Bennett, C., Halpern, M., Hinshaw, G., et al. 2003, ApJs, 148, 1
- Bot et al. (2010) Bot, C., Ysard, N., Paradis, D., et al. 2010, A&A, 532, 20
- Bouchet & Gispert (1999) Bouchet, F. R. & Gispert, R. 1999, New Astronomy, 4, 443
- Boulanger et al. (1996) Boulanger, F., Abergel, A., Bernard, J. ., et al. 1996, A&A, 312, 256
- Casassus et al. (2006) Casassus, S., Cabrera, G. F., & Förster. 2006, ApJ, 639, 951
- Casassus et al. (2008) Casassus, S., Dickinson, C., & Cleary, K. 2008, MNRAS, 391, 1075
- Castellanos et al. (2011) Castellanos, P., Casassus, S., & Dickinson, S. 2011, MNRAS, 411, 1137
- Coble et al. (1999) Coble, K., Dragovan, M., Kovac, J., et al. 1999, ApJ, 519, L5
- Davies et al. (2006) Davies, R. D., Dickinson, C., & Banday, A. 2006, MNRAS, 370, 1125
- Davies et al. (1996) Davies, R. D., Watson, R. A., & Gutierrez, C. M. 1996, MNRAS, 278, 925
- de Oliveira-Costa et al. (1999) de Oliveira-Costa, A. ., Tegmark, M., Gutiérrez, C. M., et al. 1999, ApJ Letters, 527, L9
- de Oliveira-Costa et al. (1997) de Oliveira-Costa, A., Kogut, A., & Devlin, M. J. 1997, ApJ, 482, 17
- de Oliveira-Costa et al. (1997) de Oliveira-Costa, A., Kogut, A., Devlin, M. J., et al. 1997, ApJ, 482, L17
- de Oliveira-Costa et al. (2004) de Oliveira-Costa, A., Tegmark, M., & Davies, R. D. 2004, ApJ, 606, 89
- de Oliveira-Costa et al. (1999) de Oliveira-Costa, A., Tegmark, M., Gutierrez, C. M., et al. 1999, ApJ, 527, 9
- de Oliveira-Costa et al. (1998) de Oliveira-Costa, A., Tegmark, M., Page, L. A., & Boughn, S. P. 1998, ApJ, 509, 9
- de Oliveira-Costa et al. (1998) de Oliveira-Costa, A., Tegmark, M., Page, L. A., & Boughn, S. P. 1998, ApJ, 509, L9
- De Zotti et al. (1999) De Zotti, G., Toffolatti, L., Argüeso, F., et al. 1999, in AIP Conf. Proc. 476: 3K cosmology, 204
- Désert et al. (1990) Désert, F.-X., Boulanger, F., & Puget, J. 1990, A & A, 237, 215
- Dickinson et al. (2009) Dickinson, C., Davies, R. D., & Allison, J. R. 2009, ApJ, 690, 1585
- Draine & Lazarian (1998a) Draine, B. & Lazarian, A. 1998a, ApJ, 494, 19
- Draine & Lazarian (1998b) Draine, B. & Lazarian, A. 1998b, ApJ, 508, 57
- Draine & Hensley (2012) Draine, B. T. & Hensley, B. 2012, ArXiv e-prints
- Draine & Lazarian (1998) Draine, B. T. & Lazarian, A. 1998, ApJ, 494, L19
- Draine & Lazarian (1999) Draine, B. T. & Lazarian, A. 1999, ApJ, 512, 740
- Fernández-Cerezo et al. (2006) Fernández-Cerezo, S., Gutièrrez, C. M., & Rebolo, R. 2006, MNRAS, 370, 15
- Finkbeiner (2003) Finkbeiner, D. P. 2003, ApJ, 146, 407
- Franceschini et al. (1989) Franceschini, B., Toffolati, L., Danese, L., & De Zotti, G. 1989, ApJ, 344, 35
- Gautier et al. (1992) Gautier, T. N., Cawfield, T., & Werner, M. W. 1992, in Bulletin of the American Astronomical Society, Vol. 24, 1120
- Génova-Santos et al. (2011) Génova-Santos, R., Rebolo, R., Rubiño Martín, J., C. H. Lòpez-Caraballo, C., & Hildebrandt, S. 2011, ApJ, 743, 1
- Gorski et al. (1996) Gorski, K. M., Banday, A. J., Bennett, C. L., et al. 1996, ApJ, 464, L11
- Gutiérrez et al. (2000) Gutiérrez, C. M., Rebolo, R., Watson, R. A., et al. 2000, ApJ, 529, 47
- Haffner et al. (1999) Haffner, L. M., Reynolds, R. J., & Tufte, S. L. 1999, ApJ, 523, 223
- Hamilton & Ganga (2001) Hamilton, J. & Ganga, K. M. 2001, A&A, 368, 760
- Hancock et al. (1994) Hancock, S., Davies, R. D., Lasenby, A. N., et al. 1994, Nat, 367, 333
- Haslam et al. (1981) Haslam, C., Klein, U., Salter, C., et al. 1981, A&A, 100, 209
- Hildebrandt et al. (2007) Hildebrandt, S., Rebolo, R., Rubino-Martín, J. A., et al. 2007, MNRAS, 382, 594
- Hoang et al. (2010) Hoang, T., Draine, B. T., & Lazarian, A. 2010, ApJ, 715, 1462
- Hoang et al. (2011) Hoang, T., Lazarian, A., & Draine, B. T. 2011, ApJ, 741, 2
- Iglesias-Groth (2005) Iglesias-Groth, S. 2005, ApJ, 632, 25
- Kogut et al. (1996a) Kogut, A., Banday, A. J., & Bennett, C. L. 1996a, ApJ, 460, 1
- Kogut et al. (1996b) Kogut, A., Banday, A. J., & Bennett, C. L. 1996b, ApJ, 464, 5
- Kogut et al. (1996) Kogut, A., Banday, A. J., Bennett, C. L., et al. 1996, ApJ, 464, L5
- Kogut et al. (2011) Kogut, A., Fixsen, D. J., & Levin, S. M. 2011, ApJ, 734, 4
- Kogut (2007) Kogut, A. e. a. 2007, ApJ, 665, 335
- Lasenby (1996) Lasenby, A. 1996, in XVI Moriond Astrophysics Meeting, 453
- Lawson et al. (1987) Lawson, K., Mayer, C., Osborn, J., & Parkinson, M. 1987, MNRAS, 286, 307
- Leitch et al. (1997) Leitch, E. M., Readhead, A. C. S., Pearson, T. J., & Myers, S. T. 1997, ApJ, 486, 23
- Leitch et al. (1997) Leitch, E. M., Readhead, A. C. S., Pearson, T. J., & Myers, S. T. 1997, ApJ, 486, L23
- Longair (1994) Longair, M. 1994, High Energy Astrophysics (Cambridge University Press)
- Lòpez-Caraballo et al. (2011) Lòpez-Caraballo, C., Rubiño Martín, J., Rebolo, R., & Génova-Santos, R. 2011, ApJ, 729, 25
- Mason et al. (2009) Mason, B. S., Robishaw, T., Heiles, C., Finkbeiner, D., & Dickinson, C. 2009, ApJ, 697, 1187
- Mukherjee et al. (2001) Mukherjee, P., Jones, A. W., Kneissl, R., & Lasenby, A. N. 2001, MNRAS, 320, 224
- Planck-Collaboration (2011) Planck-Collaboration. 2011, A & A, 536, 20
- Reich & Reich (1988) Reich, P. & Reich, W. 1988, A&A, 74, 7
- Ribicki & Lightman (1979) Ribicki, G. & Lightman, A. 1979, Radiative Processes in Astrophysics (New York: Wiley)
- Rohlfs & Wilson (2000) Rohlfs, K. & Wilson, T. 2000, Tools of Radio Astronomy (Springer-Verlag)
- Schlegel et al. (1998) Schlegel, D. J., Finkbeiner, D. P., & Davis, M. 1998, ApJ, 500, 525
- Silsbee et al. (2011) Silsbee, K., Ali-Haïmoud, Y., & Hirata, C. M. 2011, MNRAS, 411, 2750
- Tibbs et al. (2010) Tibbs, C. T., Watson, R. A., & Dickinson, C. 2010, MNRAS, 402, 1969
- Valls-Gabaud (1998) Valls-Gabaud, D. 1998, Publications of the Astronomical Society of Australia, 15, 111
- Veeraraghavan & Davies (1997) Veeraraghavan, S. & Davies, R. 1997, in Particle Physics and the Early Universe
- Watson et al. (2005) Watson, R., Rebolo, R., Rubino-Martin, J. A., et al. 2005, ApJ, 624, 89
- Ysard et al. (2010) Ysard, N., Miville-Dêschenes, M.-A., & Verstraete, L. 2010, A & A, 509, 18
- Zaldarriaga (1995) Zaldarriaga, M. 1995, PhD thesis, Massachusetts institute of technology.