Single top and top pair production
Nikolaos Kidonakis
Kennesaw State University
Kennesaw, GA 30144, USA
1 Introduction
I present results for single-top and top-pair production at the LHC and the Tevatron. Higher-order two-loop corrections are used to achieve NNLL resummation, which is then used to derive NNLO soft-gluon corrections. Results are presented for total cross sections, top transverse momentum distributions, and top rapidity distributions. All results are in excellent agreement with data from the LHC and the Tevatron. I also clarify the differences between various methods in top-pair production and their relation to exact NNLO results.
The LO partonic processes for single-top production are and , i.e. the channel, dominant at the Tevatron and the LHC; , i.e. the channel, numerically small at the Tevatron and the LHC; and associated production, , very small at the Tevatron but significant at the LHC. The LO partonic processes for top-pair production are , dominant at the Tevatron; and , dominant at the LHC.
QCD corrections are significant for single top and top pair production. Soft-gluon corrections from emission of soft (low-energy) gluons appear as , with and the distance from threshold, and are dominant near threshold. We resum these soft corrections using factorization and renormalization-group evolution. Complete results are available at NNLL using two-loop soft anomalous dimensions for both top-pair [1, 2] and single-top production [3, 4, 5]. Approximate NNLO differential cross sections are derived from the expansion of the resummed cross section; see Ref. [6] for the newest results. This is the only calculation using the standard moment-space resummation in pQCD for partonic threshold at the double-differential cross section level. The soft-gluon approximation works very well for both Tevatron and LHC energies; there is less than 1% difference between NLO approximate and exact cross sections, and similarly for differential distributions [6].
2 Single top production


We begin with the channel. On the left plot of Fig. 1 we show the total approximate NNLO -channel cross section versus collider energy with GeV and MSTW2008 pdf [7] and compare it with recent Tevatron [8, 9] and LHC [10, 11] data. The agreement between theory and experiment is very good. The -channel top and antitop distributions at the LHC are shown in the right plot.
| LHC | Total (pb) | ||
|---|---|---|---|
| 7 TeV | |||
| 8 TeV |
Table 1 shows the separate single-top and single-antitop -channel cross sections and their sum at 7 and 8 TeV LHC energy for GeV. The ratio at 7 TeV, which compares well with the ATLAS result [12].
For the -channel, the total cross sections (single top+antitop) at the LHC with GeV are pb at 7 TeV and pb at 8 TeV.
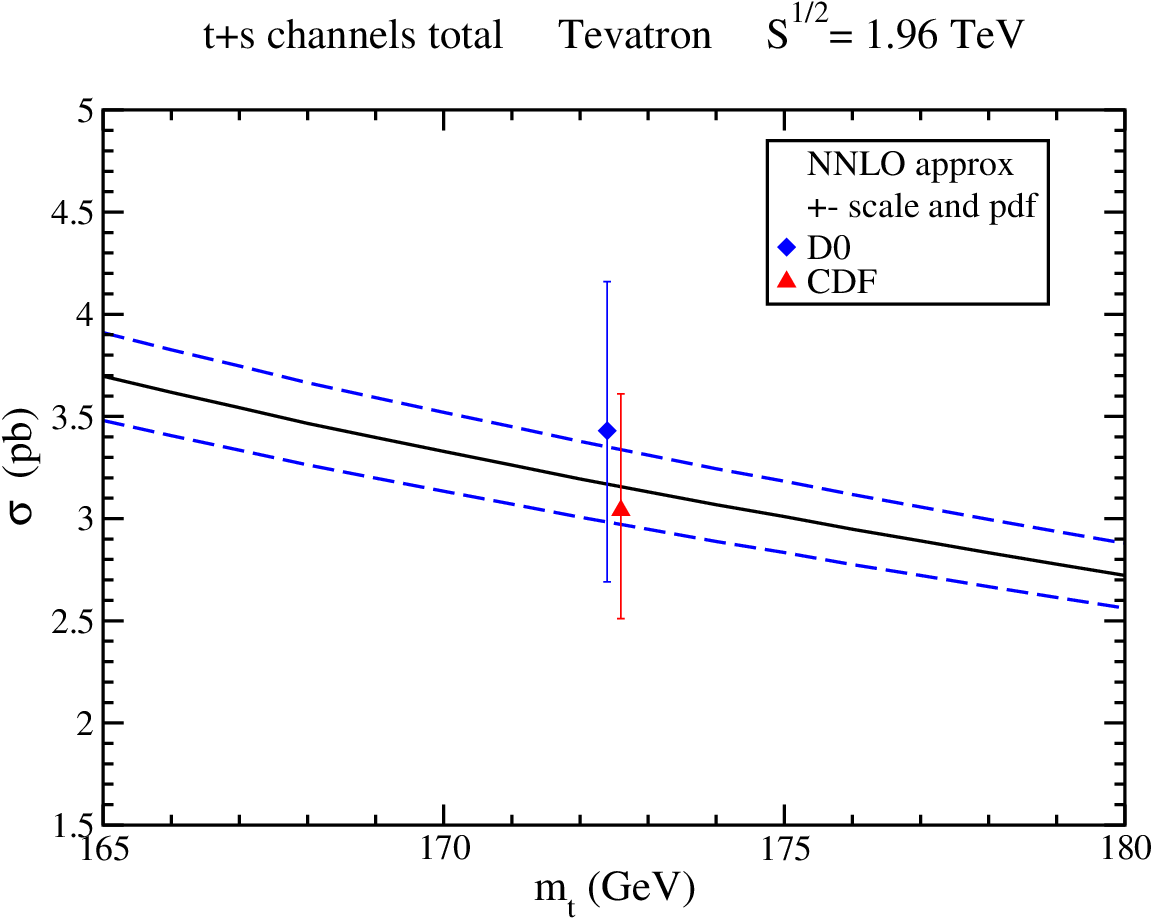

At the Tevatron at 1.96 TeV for GeV, the -channel total (single top and single antitop) cross section is pb; the -channel total is pb; and the sum of the two channels is pb. The sum of the - and -channel cross sections at the Tevatron is plotted in the left plot of Fig. 2 as a function of and compared with CDF [8] and D0 [9] data.
For associated production at the LHC with GeV, the cross section at 7 TeV is pb and at 8 TeV it is pb. The cross section for production is identical. In the right plot of Fig. 2 we display the total plus cross section with GeV versus LHC energy and compare it with recent ATLAS [13] and CMS [14] results - the agreement is excellent.
3 Top pair production


The total cross section with GeV at the LHC is pb at 7 TeV; and pb at 8 TeV. Figure 3 shows the cross section as a function of at 7 TeV (left) and 8 TeV (right) together with LHC data [15, 16]. The agreement of theory with experiment is very good and the uncertainties are similar.


The cross section at the Tevatron at 1.96 TeV is pb for GeV. The left plot of Fig. 4 shows the cross section and compares it to Tevatron data [17, 18]. The right plot shows the top distribution together with D0 data [19]. Again the agreement of theory and experiment is excellent.
The resummation approaches that have appeared in [1, 20, 21, 22] differ from each other in many respects. Differences include the use of moment-space pQCD [1, 20] versus SCET [21, 22]; doing the resummation for the double-differential cross section [1, 21] versus for the total cross section only [20, 22]; inclusion of subleading terms, etc. More discussion can be found in [6, 23]. All results presented in this paper are approximate NNLO from moment-space NNLL resummation for the double-differential cross section in single-particle-inclusive (1PI) kinematics.
The result of Ref. [1] is very close to the partially exact NNLO (exact for plus approximate for ) of [24] at Tevatron energy: vs pb, with similar scale uncertainty. It is claimed in [24] that the threshold approximation is not very good; however that only applies to the resummation method used in [24]. As discussed in detail in [6] and in [23], the various resummation formalisms are both numerically and theoretically very different. Thus, the claim in [24] does not necessarily apply to other methods, and it is most certainly irrelevant to the method used here; as shown explicitly in [6] and previous work, the method that we use here provides an excellent approximation (less that 1% difference between exact and approximate results both at NLO and at NNLO), which is significantly better than in [24]. This was expected from the study of 1PI and PIM results in [25] (see also discussion in [1, 6, 26]). A double-differential calculation for partonic (not absolute) threshold as used here and in [1, 2, 6] has a lot more theoretical/analytical information (also useful for deriving distributions) and potential for numerical accuracy than one for the total cross section only as used in [24]. This is a point often misunderstood and not emphasized in the literature. We also note that once NNLO is fully known, the next step will be to add the approximate NNNLO corrections (see [27] for some early NNNLO results).


The normalized top quark distribution at the LHC is shown in the left plot of Fig. 5 while the normalized top quark rapidity distribution is shown on the right. Both distributions predict very well the CMS results [28], also shown on the plots.
This material is based upon work supported by the National Science Foundation under Grant No. PHY 1212472.
References
- [1] N. Kidonakis, Phys. Rev. D 82, 114030 (2010) [arXiv:1009.4935 [hep-ph]].
- [2] N. Kidonakis, Phys. Rev. D 84, 011504 (2011) [arXiv:1105.5167 [hep-ph]].
- [3] N. Kidonakis, Phys. Rev. D 81, 054028 (2010) [arXiv:1001.5034 [hep-ph]].
- [4] N. Kidonakis, Phys. Rev. D 82, 054018 (2010) [arXiv:1005.4451 [hep-ph]].
- [5] N. Kidonakis, Phys. Rev. D 83, 091503(R) (2011) [arXiv:1103.2792 [hep-ph]].
- [6] N. Kidonakis, arXiv:1210.7813 [hep-ph].
- [7] A.D. Martin, W.J. Stirling, R.S. Thorne, and G. Watt, Eur. Phys. J. C 63, 189 (2009) [arXiv:0901.0002 [hep-ph]].
- [8] CDF Collaboration, CDF Note 10793.
- [9] D0 Collaboration, Phys. Rev. D 84, 112001 (2011) [arXiv:1108.3091 [hep-ex]].
- [10] ATLAS Collaboration, Physics Letters B 717, 330 (2012) [arXiv:1205.3130 [hep-ex]]; ATLAS-CONF-2012-132.
- [11] CMS Collaboration, arXiv:1209.4533 [hep-ex]; CMS-PAS-TOP-12-011.
- [12] ATLAS Collaboration, ATLAS-CONF-2012-056.
- [13] ATLAS Collaboration, Phys. Lett. B 716, 142 (2012) [arXiv:1205.5764 [hep-ex]].
- [14] CMS Collaboration, arXiv:1209.3489 [hep-ex].
- [15] ATLAS Collaboration, ATLAS-CONF-2012-131.
- [16] CMS Collaboration, CMS-PAS-TOP-11-024; CMS-PAS-TOP-12-007.
- [17] CDF Collaboration, Conf. Note 10163; Phys. Rev. D 82, 052002 (2010) [arXiv:1002.2919 [hep-ex]].
- [18] D0 Collaboration, Phys. Lett. B 679, 177 (2009) [arXiv:0901.2137 [hep-ex]]; Phys. Rev. D 82, 032002 (2010) [arXiv:0911.4286 [hep-ex]]; Phys. Lett. B 704, 403 (2011) [arXiv:1105.5384 [hep-ex]].
- [19] D0 Collaboration, Phys. Lett. B 693, 515 (2010) [arXiv:1001.1900 [hep-ex]].
- [20] M. Aliev, H. Lacker, U. Langenfeld, S. Moch, P. Uwer, and M. Wiedermann, Comput. Phys. Commun. 182, 1034 (2011) [arXiv:1007.1327 [hep-ph]].
- [21] V. Ahrens, A. Ferroglia, M. Neubert, B.D. Pecjak, and L.L. Yang, Phys.Lett. B 703, 135 (2011) [arXiv:1105.5824 [hep-ph]].
- [22] M. Beneke, P. Falgari, S. Klein, C. Schwinn, Nucl. Phys. B 855, 695 (2012) [arXiv:1109.1536 [hep-ph]].
- [23] N. Kidonakis and B.D. Pecjak, Eur. Phys. J. C 72, 2084 (2012) [arXiv:1108.6063 [hep-ph]].
- [24] P. Baernreuther, M. Czakon, and A. Mitov, Phys. Rev. Lett. 109, 132001 (2012) [arXiv:1204.5201 [hep-ph]].
- [25] N. Kidonakis and R. Vogt, Phys. Rev. D 68, 114014 (2003) [hep-ph/0308222].
- [26] N. Kidonakis and R. Vogt, Phys. Rev. D 78, 074005 (2008) [arXiv:0805.3844 [hep-ph]].
- [27] N. Kidonakis, Phys. Rev. D 73, 034001 (2006) [hep-ph/0509079].
- [28] CMS Collaboration, arXiv:1211.2220 [hep-ex].