Gas Giants in Hot Water: Inhibiting Giant Planet Formation & Planet Habitability in Dense Star Clusters Through Cosmic Time
Abstract
I show that the temperature of nuclear star clusters, starburst clusters in M82, compact high- galaxies, and some globular clusters of the Galaxy likely exceeded the ice line temperature ( K) during formation for a time comparable to the planet formation timescale. The protoplanetary disks within these systems will thus not have an ice line, decreasing the total material available for building protoplanetary embryos, inhibiting the formation of gas- and ice-giants if they form by core accretion, and prohibiting habitability. Planet formation by gravitational instability is similarly suppressed because Toomre’s in all but the most massive disks. I discuss these results in the context of the observed lack of planets in 47 Tuc. I predict that a similar search for planets in the globular cluster NGC 6366 () should yield detections, whereas (counterintuitively) the relatively metal-rich globular clusters NGC 6440, 6441, and 6388 should be devoid of giant planets. The characteristic stellar surface density above which is exceeded in star clusters is , where is the dust-to-gas ratio of the embedding material, normalized to the Milky Way value. Simple estimates suggest that % of the stars in the universe formed in an environment exceeding this surface density. Caveats and uncertainties are detailed.
Keywords:
galaxies: formation — galaxies: evolution — galaxies: starburst — galaxies: star clusters: general — planets and satellites: formation — protoplanetary disks1 Introduction
A key question is whether planet formation over cosmic time is concomitant with star formation, and whether or not the efficiency of planet formation is independent of environment and formation epoch. The correlation observed between giant planet frequency and host star metallicity by Gonzalez (1997)11 1 See also Laughlin 2000, Gonzalez et al. 2001, Laws et al. 2003, Santos et al. 2001, 2004, and Fischer & Valenti 2005. indicates that it is not, and implies that the planetary mass density is at minimum a convolution of the enrichment history of the ISM of galaxies and their star formation rates.
However, the relationship between and the stellar mass density is likely more complicated than a simple function of metallicity. Much of the star formation in normal spiral galaxies, starbursts, and the rapidly star-forming galaxies at high redshift occurs in massive star clusters (Lada & Lada 2003; Portegies-Zwart et al. 2010; Kruijssen 2012). The dense environment accompanying stellar birth in these systems is likely to significantly impact the physics of planet formation. For example, dynamical interactions, UV photoevaporation, and supernovae have all been suggested as mechanisms that might inhibit, disrupt, or affect the formation, migration, and survival of planets in dense stellar environments (Laughlin & Adams 1998; Armitage 2000; Adams et al. 2004; Fregeau et al. 2006; Adams et al. 2006; Fatuzzo & Adams 2008; Gorti & Hollenbach 2009; Gorti et al. 2009; Proszkow & Adams 2009; Spurzem et al. 2009; Olczak et al. 2012).
Because the timescale for these processes to affect planet formation is comparable to the planet formation timescale itself ( Myr), and because most stars form in clusters, the planet formation efficiency is likely a function of the stellar density of the birth environment. Since the bulk of the universe’s stars are formed at , where the conditions for producing dense star clusters with high surface densities were common, but metallicities were generally lower, the functional dependence of may be complicated.
These issues are of relevance now because observations over the last decade have begun to constrain the incidence of planets in the local field disk population, in both open and globular clusters of the Galaxy, and, through microlensing, the incidence of planets in the Milky Way’s bulge. These various data sets and future extensions have provided and will provide a wealth of information on the (likely) multi-dimensional space of planet formation efficiency as a function of birth environment. In particular, Gilliland et al. (2000) and Weldrake et al. (2005) find a statistically significant lack of “hot Jupiters” in the globular cluster 47 Tuc. A multitude of transit surveys in open clusters have begun to constrain the efficiency of hot Jupiter formation in these less dense systems (Mochejska et al. 2002, 2004, 2005, 2006; Hartman et al. 2005; Hidas et al. 2005; Rosvick & Robb 2006; Burke et al. 2006; Montalto et al. 2007; Hartman et al. 2009; Nascimbeni et al. 2012; see the analysis in Van Saders & Gaudi 2011), and RV surveys have provided tighter constraints on the population and, recently, some detections (Cochran et al. 2002; Paulson et al. 2004; Quinn et al. 2012; Pasquini et al. 2012). As I emphasize here and throughout this paper, such surveys, if carried out for a number of globular and open clusters with a variety of metallicities and stellar densities, might provide the first quantitative measure of the planet formation efficiency as a function of both metallicity and stellar surface density.
Complimentary to transit and RV surveys is microlensing, which could in principle measure the planet frequency in the Galactic bulge via self-lensing (Kriaga & Paczynski 1994) relative to the frequency in the foreground disk (e.g., Han & Gould 1995). Microlensing may also be used to constrain the planet frequency via self-lensing in M31 (Baltz & Gondolo 2001; Chung et al. 2006). Since the Galactic bulge has had a different formation and enrichment history than the disk or halo, one would expect a different planet formation efficiency per unit star formed. Studies of the low mass IMF in the Galaxy’s bulge and disk reveal a large difference in slope (see Fig. 8 from Zoccali et al. 2000) that might manifest an underlying difference in the relative planet population. Future observations of the relative planet frequency in these two environments (bulge and disk) might be interpretable with constraints on the planet population in the many different open and globular clusters of the Galaxy, again with a range of metallicities and surface densities. These studies would be further complemented by searches for the NIR signatures of protoplanetary disks in young and dense stellar environments, such as in Arches and NGC 3603 (Stolte et al. 2004, 2010).
With this backdrop, here I consider the importance of the strong infrared irradiation expected in a newly-born star cluster. Different from works focusing on photo-evaporation of protoplanetary disks, I show that the UV and optical emission from massive stars, which is efficiently absorbed and scattered by dust grains, creates a thermal bath similar to a hohlraum. This strong thermal cluster irradiation is the focus of this work.
I show that the heating and thermal structure of protoplanetary disks around Solar-type stars during the first few Myr of cluster evolution is in fact dominated by the irradiation from the cluster as a whole, and not from the host star, for semi-major axes larger than a few AU. This keeps the disks essentially isothermal and hot as a function of radius, affecting their structure and their potential to form planets via gravitational instability or core accretion. In fact, I show that in the interior of massive embedded star clusters, the temperature approaches and exceeds the condensation temperature of water ice, K (Podolak & Zucker 2004; Lecar et al. 2006). Because the disks equilibrate to midplane temperatures at or above the value corresponding to the incident flux, this means that protoplanetary disks in such environments have no ice line. Stated succinctly, the central temperatures of many star clusters in formation exceed the fundamental temperature scale for planet formation by core-accretion: . This decreases the total amount of condensable material by a factor of , and thus inhibits giant planet formation (Lodders 2003; Lecar et al. 2006). Over a wider and less extreme range of cluster properties, the temperature is still very high, and this should in general suppress planet formation by gravitational instability. Even more generally, I find that in the first Myr of evolution that the effective temperature of clusters and their embedded disks should be large than many tens of Kelvin, and for this reason studies of protoplanetary disk evolution for a much wider range of irradiation than has previously been considered should be carried out.
In Section 2, I estimate the temperature of embedded star clusters, and in Section 3 I estimate their protoplanetary disk temperatures. I then compare the relative importance of cluster irradiation and (1) host star irradiation in passive disks, and (2) accretion power in active disks. Generically, I find that cluster irradiation dominates the thermodynamics and structure of passive and active disks outside a semi-major axis of AU around Solar-type stars. In Section 4, I discuss planet formation via core accretion and gravitational instabilty, focusing on the physics of the ice-line and the -criterion. I find that for star clusters above a stellar surface density of M⊙ pc-2 there is no ice-line and that, for even modest surface density clusters, the -criterion indicates that only protoplanetary disks with masses larger than M⊙ can be gravitationally unstable around Solar-type stars.
In Section 5, I estimate the temperature at formation for a variety of systems, including Galactic star clusters and globular clusters, super star clusters in the nearby starburst M82, the central nuclear clusters of galaxies, and compact galaxies at high redshift. Several globular clusters are likely to have exceeded in at least part of their volume during formation, including 47 Tuc. I extend the discussion to continuously star-forming disks and discuss planet formation in the context of local and high- starbursts, rapidly star-forming galaxies, and AGN, finding that above a gas surface density of M⊙ pc-2 (or star formation surface density of M⊙ yr-1 kpc-2) the temperatures of rapidly star-forming galaxies should exceed or approach . Applying these results to the compact passive high- galaxies, I find that most of the systems likely exceeded during formation.
In Section 6, I discuss the results, focusing first on uncertainties in the estimates, including variations in the IMF, radiation transport with distributed sources, estimates of the optical depth in star clusters, and the time dependence of cluster and planet formation. With these uncertainties in mind, I discuss local globular clusters, and in particular suggest other transit/RV searches for hot Jupiters in Galactic globular clusters than have central temperatures below , but metallicities comparable to 47 Tuc. I provide a sketch of a calculation of the fraction of all star formation in the universe that occurred above a given stellar surface density and metallicity, with implications for the planetary mass density. Section 7 provides a conclusion.
2 The Temperature of Star Clusters
A star cluster has mass , radius , and a stellar surface density .22 2 We define with the ”4” since we are interested in the total flux, as seen from within the cluster. If the stars form in a time less than 3 Myr,33 3 The dynamical timescale is yr . then the flux at formation can be estimated as
| (1) |
where M⊙ pc-2 and L⊙/M⊙ is the light-to-mass ratio for a zero-age main sequence (ZAMS) stellar population assuming a fully-populated standard IMF (e.g., Leitherer et al. 1999).44 4 For clusters with small total mass M⊙, the assumption of a fully populated IMF breaks down and is decreased. This flux corresponds to an effective temperature of
| (2) |
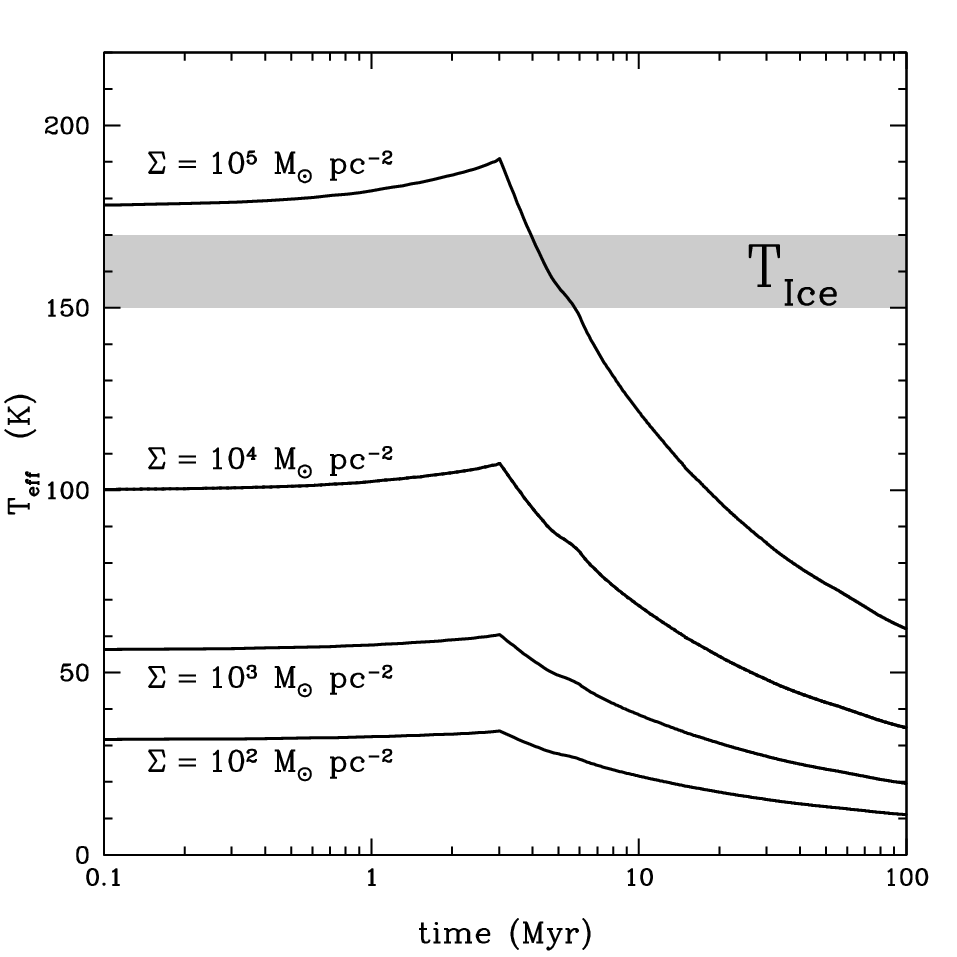
Figure 1 shows as a function of time for an instantaneous burst of star formation, using a Salpeter IMF from M⊙, for several values of . After Myr, and over the first Myr the time-dependence of is well approximated by . The gray band shows the temperature for water ice sublimation, K. The effect of variation in the IMF on and is discussed in Section 6.1.
Since the focus here is on the application to protoplanetary disks, one can ask about the total flux absorbed by each side of an optically-thick disk situated at the center of an optically-thin spherically-symmetric star cluster with radial emissivity profile . For illustration, taking a Hubble profile for the stellar density distribution, , one obtains , implying
| (3) |
where and M⊙ pc-3 so that the equivalent stellar surface density inside is M⊙ pc-2. More generally, the total energy density at any radius within an optically-thin cluster of emissivity is
| (4) |
2.1 Optically-Thick Clusters
If the star cluster is compact compared to the optically-thick embedding dust/gas distribution, the temperature of the star cluster is larger than because the radiation field is trapped and diffusive, as in a simple stellar atmosphere. In this case, the cluster temperature is
| (5) |
where is the Rosseland-mean optical depth through the surrounding dusty medium. For the purposes of analytic estimates, in the temperature regime K K, I approximate the Rosseland-mean dust opacity as constant:
| (6) |
where I assume a Galactic dust-to-gas ratio (). Comparing with Adams & Shu (1986), Bell & Lin (1994), and Semenov et al. (2003), this approximation agrees with more detailed calculations to a factor of over this temperature range. For lower temperatures ( K),
| (7) |
where cm2 g-1 K-2 (Bell & Lin 1994; Semenov et al. 2003).
Approximating the cluster as a geometrically thin shell of gas surface density and gas fraction , the total optical depth is
| (8) |
For K and , the cluster temperature is then approximately
| (9) |
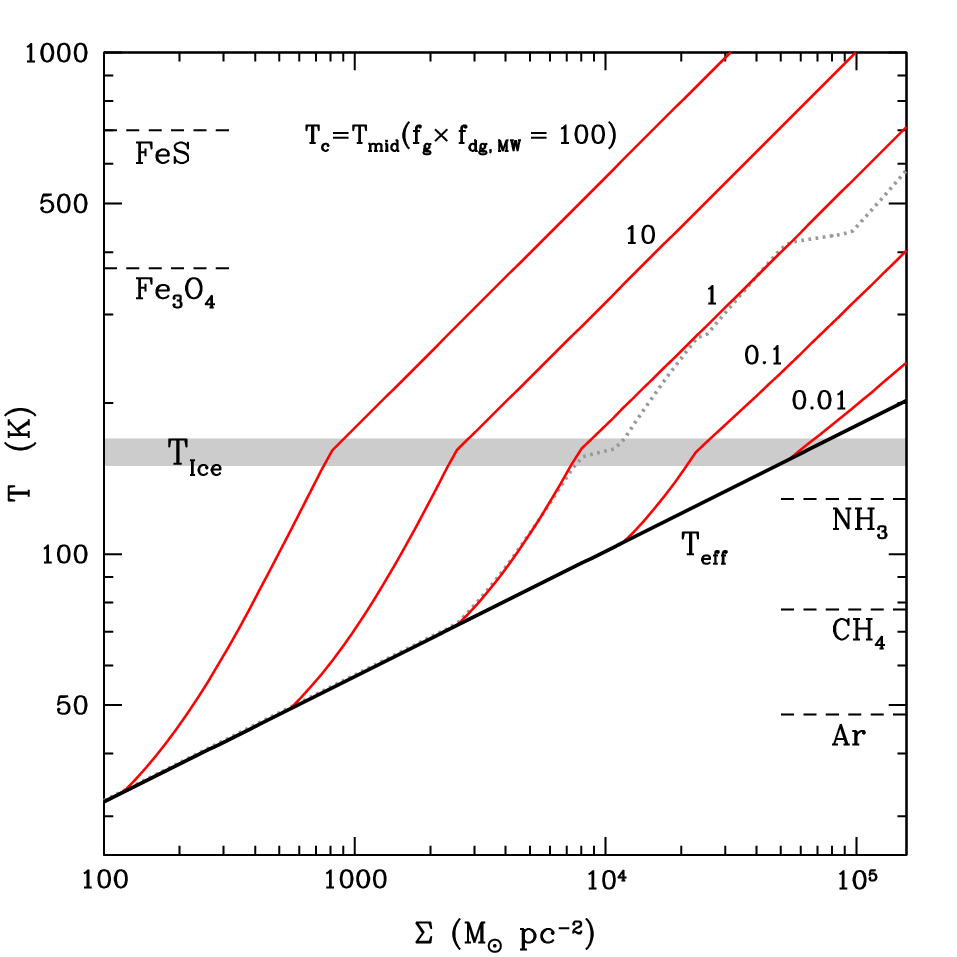
while for lower temperatures (),55 5 There is only a small dynamic range in where and K. See Figure 2.
| (10) |
The radiation energy density is , where is the radiation constant. These estimates for hot, high surface density embedded clusters are similar to those derived by Murray (2009).
2.2 Optically-Thin Clusters
When the cluster is optically-thick to the UV/optical radiation from the stars, but optically-thin to the re-radiated FIR emission, the temperature is , and the energy density is given by equation (4). The critical surface density below which the cluster has can be derived roughly using equations (5) and (7) as .
2.3 UV & Optically Optically-Thin Clusters
The cluster is optically-thin to both the UV/optical radiation from massive stars and to the re-radiated FIR emission when M⊙ pc-2 , which may occur after the cluster has evolved out of the embedded phase. In this limit, is still given by equation (2) and is given by equation (4), but the temperature of the radiation field is of course much hotter ( K) than in the limits of Sections 2.1 and 2.2. This hard radiation field will super-heat dust grains at the surface of protoplanetary disks to a temperature larger than because of the emissivity properties of grains in the UV and FIR.
3 The Temperature of Protoplanetary Disks
Given the ambient radiation field in the cluster, one can estimate its importance for the thermal structure of protoplanetary disks around individual stars within the cluster. and compare the importance of cluster irradiation to the insolation from the host star and to the thermal structure determined by accretion in active disks.
3.1 Embedded Disks
There are three primary regimes of interest. To illustrate these, I adopt a simple model of a protoplanetary disk around a star of mass , radius , temperature . The disk has gas surface density ,66 6 For a minimum mass Solar nebula, g cm-2 and (Weidenschilling 1977). where is the semi-major axis, disk midplane temperature set by radiative and hydrostatic equilibrium, and vertical optical depth , where is given by equations (6) and (7) if the grain size distribution and composition within the disk is the same as within the star cluster and if we consider only temperatures below the dust sublimation temperature at K.77 7 Note that the grain size distribution of proto-planetary disks is likely different from that of the ISM, with a larger maximum grain size and different slope for the power-law size distribution (e.g., D’Alessio et al. 1999, 2001). These differences quantitatively affect the dividing lines between the different semi-major axis regimes discussed below, but all qualitative conclusions remain unchanged. More discussion of this issue is provided in Sections 3.3 and 3.4.
Neglecting all other sources of disk heating, including that from the central star and accretion, the three regimes of cluster irradiation for the disk are as follows. At small the disk is optically-thick to radiation of temperature , and to its own radiation . Here, . Next, at an intermediate range of , the disk may be optically-thick to radiation of temperature , but optically-thin to its own radiation and . Finally, at large , the disk is optically-thin to radiation of temperature and to its own radiation and , where is the dust emissivity at temperature .88 8 Note that would only be much different than unity in the case of a UV/optically optically-thin cluster as discussed in Section 2.3.
These limits show that a protoplanetary disk embedded in a cluster of effective temperature (eq. 2) has as its minimum temperature. If the cluster is optically-thick, then the minimum temperature of the optically-thick regions of the disk is (eqs. 9 & 10), which exceeds by a factor of (eq. 5).
Figure 2 shows several temperatures of interest as a function of cluster stellar surface density for a newly-born cluster ( Myr). The thick solid black line shows (eq. 2) for L⊙/M⊙ (see Fig. 1). The red solid lines show for obtained by solving equation (5), using the simplified opacities of equations (6) and (7), and for , 10, 1, 0.1, and 0.01. The break in each red line occurs at K at the break in the assumed opacity law (eqs. 9 & 10). A more complete treatment of the Rosseland-mean opacity, as presented in Bell & Lin (1994) or Semenov et al. (2003), introduces inflections in at each break in the opacity curve, as shown in the dotted curve, which gives the full solution to equation (5) using the opacity tables of Semenov et al. (2003) for . The close correspondence between the dotted curve and the red curve validates our use of equations (6) and (7) in making analytic estimates below. The gray band shows the temperature for water ice sublimation K. The short horizontal dashed lines show condensation temperatures for troilite ( K) and magnetite ( K), and then the ammonia, methane, and argon ices (Lodders 2003). For times Myr, and decrease approximately as (Fig. 1).
3.2 Cluster Irradiation versus Host Star Irradiation
It is useful to compare the incoming flux from the combined stellar population of the star cluster with the flux from the central star in a passive flared disk (Chiang & Goldreich 1997; hereafter CG97):
| (11) |
where is the flaring angle, K, R⊙, and where the second approximate equality follows from ignoring the first term in at large .
As discussed in CG97, the hot stellar irradiation produces a superheated dust layer (of temperature ) at the surface of the disk, which re-radiates approximately half of the absorbed light back into the disk, maintaining . As in the case of cluster irradiation alone, there are three regimes of irradiation from the central star separated by semi-major axis: (1) at small ( AU for CG97 parameters), the disk is optically-thick to both and ; (2) at an intermediate range of the disk is optically-thick to , but optically-thin to radiation of temperature ; (3) at large ( AU in CG97) the disk is optically-thin to both. In all cases, for the passive disk is set by the incoming flux from the central star, in equation (11), but with an overall correction for the fact that only half of the incoming flux is radiated into the disk, a correction for the vertical disk optical depth in regime (2), and a correction for the ratio of emissivities between and in regime (3).
We can now compare the importance of cluster irradiation to that from the central star directly. When the cluster is optically-thick to its own FIR radiation (), the relevant comparison is between in equations (9) and (10) and . Setting , one derives the critical semi-major axis outside of which the cluster radiation field dominates the radiation field from the central star:
| (12) |
| (13) |
When the cluster is optically-thin to its own FIR radiation the relevant comparison is between from the cluster (eq. 2) and :
| (14) |
Since at these small values of the semi-major axis the disk is optically-thick to the incoming FIR radiation from the cluster, the re-radiated emission from the hot surface disk dust layer, and to the re-radiated emission from the disk midplane, these comparisons show that the cluster radiation field dominates the temperature and structure of passive irradiated disks for AU around typical stars in a cluster with M⊙ pc-2; for , is set by stellar irradiation, but for , the cluster sets . Its minimum value is (black solid line in Fig. 2) in the case of an optically-thin cluster, and it reaches in the case of a cluster that is optically-thick to its own FIR radiation.
It is worth noting that because the geometry of cluster irradiation is different than for the central star, the vertical structure of the disk will be modified. In particular, the flaring angle in a passive disk irradiated only by a central star is expected to scale as (CG97), whereas for a passive isothermal disk irradiated isotropically by the cluster one expects . This stronger flaring will increase the insolation from the host star, and in a self-consistent model for the disk, cluster, and star, and one expects the estimates above for to be modified quantitatively.

3.3 Cluster Irradiation versus Accretion
For an active disk with steady accretion rate M⊙ yr-1 around a star of mass measured in units of , the flux from the disk is
| (15) |
Ignoring other sources of heating, the midplane temperature of the disk is larger than by a factor of . Taking values characteristic of a minimum mass Solar nebula for illustration — with g cm-2 — the midplane temperature is
| (16) |
| (17) |
where the top expression assumes equation (6) and the lower expression assumes equation (7).99 9 For a proto-planetary disk dust grain size distribution, the Rosseland-mean opacity is decreased by a factor of relative to the estimates of equations (6) and (7) in the temperature range of interest (D’Alessio et al. 1999, 2001). In general, this lowers the midplane temperature of active disks with respect to the estimates in equations (16) and (17). This moves the ice-line in active disks to smaller semi-major axes (Sasselov & Lecar 2000; Lecar et al. 2006). Setting equation (16) equal to K one finds that , whereas a calculation with the D’Alessio et al. (2001) opacities by Lecar et al. (2006) finds AU for the same parameters. The above scalings show that accretion heating generally dominates at AU, whereas passive heating from the central star dominates at larger semi-major axis (CG97; compare eqs. 17 and 11).
In order to evaluate the importance of cluster irradiation for the structure of active disks, the relevant comparison is then between and either in the case of a FIR optically-thick cluster or in the case of a FIR optically-thin cluster. Roughly, will only be strongly modified when for the cluster exceeds for the optically-thick regions of the protoplanetary disk. For optically-thick clusters with the critical semi-major axis beyond which cluster irradiation dominates accretion heating in setting is
| (18) |
which is correct for either or . When the cluster is optically-thin (), equations (2) and (17) imply that
| (19) |
These comparisons show that the cluster radiation field dominates the disk structure of active accreting disks for semi-major axes larger than AU around a typical star with an active accretion disk embedded in a cluster with M⊙ pc-2. The weak dependencies of on and in equation (19) guarantee that beyond a AU, cluster irradiation dominates accretion, even for accretion rates as high as M⊙ yr-1 and cluster surface density as low as M⊙ pc-2.
However, as I discuss in Sections 4.2 and 4.3, the cluster-irradiated massive disks most prone to gravitational instability will have accretion rates as much as times higher than used in the estimates above, and particularly at early times. The normalization of equations (18) and (19) increases to and AU, respectively, for M⊙ yr-1. Additionally, the accretion luminosity in such a system would dominate the passive heating contribution in Section 3.2, pushing the critical semi-major axis at which the cluster irradiation dominates the host star to much larger values than given in equations (12)-(14). Most importantly, such high accretion rates would significantly decrease the disk lifetime.
3.4 A More Complete Calculation
In order to make these comparisons between cluster irradiation and host star irradiation and accretion explicit, in Figure 3 I show the midplane temperature of a protoplanetary disk (thick solid lines), including all three effects, for , 100, and 50 K (highest to lowest).
The dashed line (“stellar irradiation”) shows (eq. 11; CG97), and the dotted line (“accretion”) shows the analytic approximations for in equations (16) and (17). The midplane temperature is calculated by solving the implicit equation (see, e.g., Sirko & Goodman 2003)
| (20) |
where is the vertical optical depth to the disk’s own radiation, and where I have assumed the opacities of Semenov et al. (2003). As in CG97, the last term allows for the fact that the disk may be optically-thick to the incoming radiation field, but optically-thin to its own re-radiated emission.
The calculation is not self-consistent in the sense that it assumes is constant throughout the disk, and that is given by equation (11). In reality, the disk structure, and hence the amount of stellar irradiation as a function of , should deviate from equation (11) because of accretion, and because the disk becomes isothermal () at large . In addition, because the scale height is determined without reference to , in such a disk as plotted in Figure 3, the viscosity parameter (not to be confused with in eq. 11) would continuously vary. For these reasons, the calculations shown in Figure 3 are meant to be a sketch. Even so, Figure 3 dramatically illustrates the importance of cluster irradiation. Even for K, the thermal structure of the disk is completely modified from the expectation of passive stellar irradiation for semi-major axes larger than AU. Comparing K to K, one sees that the ice line moves out slightly in and that the disk structure is modified from the expectation of the simply active disk beyond AU. For K, the ice line completely disappears, and the structure of the disk changes noticeably beyond AU.
Detailed self-consistent calculations of active disks with both cluster and host star irradiation are left to a future effort.
3.5 Other Regimes
Many more regimes than those listed in equations (12)-(14) and (18)-(19), and represented in Figure 3, could be enumerated. For example, when the cluster is UV/optically optically-thin and the cluster has the hard radiation field characteristic of a young stellar population ( K, Section 2.3) an active and irradiated protoplanetary disk will be optically-thick to this incoming UV radiation at much larger semi-major axis than the FIR radiation of an optically-thick cluster, thus effecting at what semi-major axis the cluster, the accretion, or the insolation from the host star dominates the disk structure and thermodynamics. In addition, such a cluster radiation field would produce super-heated dust layers on all its protoplanetary disks, thus affecting the dust-reprocessed radiation field the disks would see at larger .
4 Planet Formation
The estimates above show that the temperature within compact embedded star clusters is expected to be very high. Protoplanetary disks within these clusters can be expected to have a minimum temperature of order given by equation (2), and with time evolution shown in Figure 1. Highly embedded clusters reach considerably higher central temperatures, as shown by the red lines in Figure 2 for different values of the dust-to-gas ratio and cluster gas fraction. As discussed in Section 3 and shown in Figure 3, the radiation field from a young cluster is likely to dominate the thermodynamics and structure of both passive and accreting protoplanetary disks on scales larger than AU, depending on the parameters of the system in consideration. Here, I consider the zeroth-order effects on planet formation in the core accretion and gravitational instability pictures for the formation of gas- and ice-giant planets.
4.1 Core-Accretion
The dominant picture for the formation of gas and ice giant planets is the core accretion model (Mizuno 1980; Pollack et al. 1996), which requires a protoplanetary core to grow in the disk to a critical mass of M⊕, thereby initiating runaway accretion of gas from the disk and rapid growth to the isolation mass (e.g., Armitage 2010). Critical to the core accretion model is the “ice line,” the semi-major axis where the temperature of the disk drops below the sublimation temperature of water ice, because here the surface density of all condensables is times higher than that in only refractories. It is this “extra” material, which exists only outside the ice line, that enables the formation of M⊕ mass cores and the core accretion phenomenon. In standard models of disk evolution including irradiation from the central star and accretion, the ice line typically occurs at AU (e.g., Sasselov & Lecar 2000; Lecar et al. 2006; Kennedy & Kenyon 2008), and it is this fundamental scale that is posited to explain the dichotomy between the terrestrial and gas/ice giants in the solar system.
Looking at Figure 2, one finds that in star clusters with high surface densities and/or high gas fractions or dust-to-gas ratios, is greater than the ice line temperature of K for a fully populated initial mass function, for times less than Myr. Setting in equation (9), one derives the critical stellar surface density above which and there is no ice line in the star cluster is
| (21) |
Note the metallicity dependence in the denominator of this expression, which shows that a high value of the dust-to-gas ratio drives the system to higher temperatures, which could completely inhibit giant planet formation in the core accretion theory. As shown in Figure 2 and equation (21), for super-solar metallicities or larger gas fractions, decreases: for , M⊙ pc-2. In contrast, for much lower , as might occur in metal-poor proto-globular clusters with so that , increases to M⊙ pc-2.
If giant planets in fact form by core accretion, then because this is a critical phenomenon requiring a large amount of condensable material, one expects clusters born with to have only terrestrial rocky planets, and for those planets to be devoid of water. Such a disk is sketched in Figure 3, which shows that for K (top thick solid line), the ice line simply disappears. I discuss the search for giant planets in the relatively metal-rich globular cluster 47 Tuc (), the discovery of a giant planet in NGC 6121, and other globular clusters in Sections 5 and 6.

4.2 Gravitational Instability
Gas- and ice-giant planets may also form by gravitational instability (Boss 1997, 2000; Pickett et al. 2003; Durisen et al. 2007). Planet formation by gravitational instability puts two necessary physical requirements on the structure of the protoplanetary disk that must be satisfied simultaneously: (1) Toomre’s must be less than and (2) the cooling timescale must less than the local orbital timescale (Gammie 2001). Recent work has shown that these requirements can only be met at large semi-major axes around stars with very massive disks (Matzner & Levin 2005; Rafikov 2005). Such massive protoplanetary disks that become gravitationally unstable at large have also recently been argued to produce low-mass binary stellar companions instead of planets (Boley 2009; Kratter et al. 2010; see also Bonnell & Bate 1994, Bate 2000).
Effects on by irradiation have been considered in the context of IR re-radiation by protostellar envelopes by Matzner & Levin (2005), and in the context of disk models by D’Alessio et al. (1997), Cai et al. (2008), Rafikov (2009), Vorobyov & Basu (2010), Rice et al. (2011), Kratter & Murray-Clay (2011), and Zhu et al. (2012).
The most obvious consequence of strong irradiation in the cluster environments investigated here is that Toomre’s is larger at fixed protoplanetary disk surface density relative to a non-irradiated protoplanetary disk of the same properties. Thus, larger surface density is required to drive the disk gravitationally unstable. Taking with , , , and assuming that , the critical temperature above which scales as with no -dependence. In this case, the critical normalization above which the disk will have is
| (22) |
for an optically-thin cluster, and it increases to
| (23) |
and
| (24) |
for and K, respectively. These values are times the typical value assumed for the MMSN ( g cm-2). The implied disk masses are M⊙ for an outer disk semi-major axis of 50 AU.
Figure 4 shows as a function of the cluster stellar surface density for the same parameters as in Figure 2: , 10, 1, 0.1, 0.01 (red lines, top to bottom; eqs. 23, 24) and for (black line; eq. 22). The normalization for the MMSN is shown as the gray band. Thus, for disks embedded in star clusters with surface density , and given , the protoplanetary disks must have for . This simple comparison assumes that , which is justified for large values of required by equations (22)-(24) since the vertical optical depth in the disk is larger than unity all the way out to AU.
For different protoplanetary disk profiles, the scalings become more complicated. For , , and , the critical temperature above which is
| (25) |
I have purposefully scaled all quantities for a massive disk, with total mass M⊙. Comparing with Figures 1 and 2 one sees that for most of the parameter regime considered for the cluster exceeds and that the disks will have for AU. For the optically-thick clusters with , can in many cases dramatically exceed , as shown in Figure 2.
However, note that depends strongly on , , and . For an isothermal disk with , , and thus equation (25) can be interpreted as saying that in order for the disk to have a region with in a cluster with temperature equal to , the disk need only extend to a semi-major axis beyond 20 AU (for the parameters of eq. 25). For example, equating with the expression with the effective temperature of a star cluster of surface density in equation (2), one derives the critical semi-major axis of the protoplanetary disk beyond which in a disk with :
| (26) |
Alternatively, one can think of this as a limit on the disk mass :
| (27) |
which says that for in a cluster of stellar surface density , the disk has at AU. Thus, for gravitational instability to operate at, say, AU in a disk with around a solar-mass star, in a cluster of nearly any stellar surface density (since ), the disk mass must be very large: M⊙.
The above estimates are only for optically-thin clusters. For the case of an optically-thick cluster with , the limit on increases, but again depends on .
Overall, these estimates imply that cluster irradiation strongly suppresses gravitational instability by increasing above its nominal value for a disk in isolation. The additional requirement on the formation of planets by gravitational instability is that the cooling time of the disk should be less than the characteristic orbital time. The reader is referred to Kratter et al. (2009), Cai et al. (2008), Rafikov (2009), Rice et al. (2011), Kratter & Murray-Clay (2011), and Zhu et al. (2012) for a discussion of this criterion including irradiation. I note here only that the magnitude of the cluster irradiation indicated by Figures (1), and (2), and which I estimate for observed stellar systems in Section 5, in general dramatically exceeds what has been so far considered in the literature for protoplanetary systems forming by gravitational instability.
4.3 Accretion & Migration
Because of the increase in sound speed at large semi-major axis in disks with strong cluster irradiation with respect to those without, one generically expects active disks to accrete at higher rates, yielding a shorter overall planet formation timescale, and for planets embedded within them to migrate faster, if the predominant migration mechanism is Type II. This conclusion follows from the accretion timescale in a disk with viscosity coefficient :
| (28) |
One also expects a somewhat larger accreting (active) atmosphere in layered disks with a dead zone (Gammie 1996). Similarly, in a self-gravitating marginally stable disk, the characteristic accretion rate is
| (29) |
which also contains a strong temperature dependence.
In addition, for disks embedded in clusters that exceed the ice line temperature one expects less total mass in planetesimals, and one then expects planetesimal migration to be less effective overall. This implies that the rocky planets that form in clusters exceeding the ice line temperature might have different migration history than their non-cluster analogs for at least three reasons: (1) there might be no Jupiter-mass planets to instigate, or regulate, planetesimal migration because the core-accretion process is quenched; (2) there will be less mass in planetesimals to begin with because ice cannot condense; (3) the viscous time for the disk will be short because , which is then proportional to the stellar surface density of the cluster as for an optically-thin cluster to for an optically-thick cluster with . These countervailing effects ( versus 3) need to be considered in assessing the demographics of planets found (NGC 6121; see Sections 5 & 6) or not found (47 Tuc) in dense stellar environments, even at fixed metallicity.


5 Comparison with Data & Specific Systems
In this section I use the analytic estimates of the previous sections to estimate the temperatures of star clusters, globular clusters, and whole galaxies in formation.
5.1 Super Star Clusters & Nuclear Star Clusters
Figure 5 shows (blue filled squares) and (red) for and (open circles), 1 (filled circles), and 0.1 (open squares), versus inferred cluster stellar mass , for clusters in M82 (left panel; McCrady & Graham 2007) and for the nuclear star clusters of galaxies (right panel; Leigh et al. 2012). For the M82 clusters I computed , using the values of the total mass, velocity dispersion, and crossing time quoted in McCrady & Graham (2007), while for the nuclear clusters I used and from Leigh et al. (2012). The bolometric flux was then assumed to be given by equation (2), assuming L⊙/M⊙. This procedure yields (blue squares) at cluster birth, assuming that the entire stellar mass formed in less than Myr. The optical depth was then estimated using equation (8) for the assumed , and equation (5) was solved for , giving the red points.
The separation in temperature between and indicates that for and , most of the clusters shown in Figure 5 are optically-thick on the scale of their half-light radii. Since measures the minimum temperature in the optically-thick regions of protoplanetary disks embedded in these clusters during formation, we see that in many systems, thus likely suppressing giant planet formation by core accretion or gravitational instability.

5.2 Local Clusters & Globular Clusters
In Figure 6 I plot temperature versus current stellar mass of both young and globular clusters of the Milky Way, Fornax, LMC, and SMC (McLaughlin & van der Marel 2005). The black open circles show the current -band effective temperature computed using , where is the half-light radius and is the -band luminosity of the cluster within . The blue points show the zero-age main sequence (ZAMS) effective temperature computed using , where , is the total stellar mass within , is the -band mass-to-light ratio, and L⊙/M⊙ is the assumed ZAMS light-to-mass ratio. The blue points approximate the effective temperature for the cluster in its first Myr and are directly analogous to the blue squares in Figure 5 for M82 and the nuclear star clusters. On timescales longer than Myr, , as shown in Figure 1.
In order to estimate which clusters may have been optically-thick to the re-radiated FIR emission from dust, I assumed that and that the dust-to-gas ratio relative to the Galactic value is given by (see eqs. 6 & 7). Using this prescription for , I find that only six clusters in the sample are optically thick on the scale of their half-light radii (all are globulars, labeled in red), and that they are only marginally so. By the same calculation used in the panels of Figure 5 for , only NGC 6440, 6338, and 6441 would have , and although 47 Tuc, NGC 6266 (M62), and 6526 are optically thick at , (marginally) by that calculation on the scale of .
Motivated by the excellent radial profiles presented in McLaughlin & van der Marel (2005), and the fairly strong changes in and within each cluster, I was motivated to go a step further and attempt to calculate the fraction of the total mass that might reasonably have . In order to solve this problem fully, one would need to solve the radiation transport problem in spherical symmetry, with distributed sources, of emissivity , subject to the free function of the gas/dust density profile, . Moreover, one would need to infer the initial stellar density profile at ZAMS from the density profile we observe today. Because these steps are highly uncertain, I made the following crude approximation. I assume that at every radial position , the total flux carried by that shell is the volume integral of the sources :
| (30) |
At that same position, the total overlying optical depth is
| (31) |
For the required density and emissivity profiles, I used the power-law (-) models presented by McLaughlin & van der Marel (2005) for each cluster, which yield the three-dimensional emissivity profile
| (32) |
where and are provided for each cluster by the authors. I then assumed and , and solved equation (5) for using and in equations (30) and (31). This procedure accounts for the fact that both the total flux and optical depth vary strongly with , and allows one to make an estimate of the central temperature of the cluster where may be very different from , and may be much larger than .
The solid red dots in Figure 6 show the resulting central cluster temperature. The small red number shows the fraction of the mass that has temperature larger than K, . This calculation thus implies that only of the total mass of these clusters exceeds the ice-line temperature. Generically, it is the central regions, where the flux is still very high, and the overlying optical depth is very large, where obtains. I emphasize that this procedure is very crude since it (1) is subject to the uncertainties of a free function, , which I have specified to be , (2) does not in fact solve the transport equation with the non-gray opacity of dust, and (3) assumes that is unchanged from its initial distribution. Nevertheless, this procedure allows one to explore the obvious change in and , which undoubtedly lead to temperature profiles in clusters at formation.
I discuss a number of specific systems further in Section 6, but here note that none of the clusters highlighted in red, with are thought to have undergone core collapse since birth.
5.3 Galaxies & AGN
The formalism discussed so far for star clusters can be generalized to continuously star-forming galaxies by taking , where is the star formation rate per unit area, and is an IMF-dependent constant of order for standard IMFs. The effective and central temperatures of galaxies in formation are then (compare with eqs. 2 and 9; see the related discussion in Thompson, Quataert, & Murray 2005)
| (33) |
and
| (34) |
respectively, where , M⊙ yr-1 kpc-2, and M⊙ pc-2. Equation (34) assumes and equation (6).1010 10 Using decreases eqs. 33 and 34 to 86 K and 140 K, respectively.
As an application, in Figure 7 I show temperature as a function of stellar mass estimated for the compact high- galaxies from the sample of Van Dokkum et al. (2008) and Kriek et al. (2008). The filled black triangles show the current effective temperature , where is the current mass-to-light ratio of the stellar population found by Kriek et al. (2008), and and are the total stellar mass and effective radius. I then compute the dynamical timescale for each galaxy and assume that the star formation timescale is (open squares), (filled circles), (open circles). The flux at formation is then , where I approximate . The blue points show , the effective temperature during formation, while the red points show the solution to equation (5) assuming that () and , which approximates the estimate of equation (34) at high optical depths.
Although highly simplified, these estimates imply that all of these systems were K at formation and that many were K. And of the systems shown here likely attained temperatures in excess of , almost certainly suppressing planet formation by core accretion or gravitational instability.
Similar estimates can be made for actively star forming galaxies. Equations (33) and (34) show that it is the most gas-rich and highly star forming systems that are likely to suppress planet formation. These include the inner regions of Arp 220 and other local ULIRGs, high- submillimeter selected sources, and the highly star-forming clumps within high- galaxies like that in Q2346-BX 482 (Genzel et al. 2008; Murray et al. 2010). One can use the Schmidt law as derived by Kennicutt (1998) to connect and in actively star-forming galaxies. Equation (34) then allows an estimate of the critical gas surface density above which exceeds :
| (35) |
Such surface densities are in fact achieved in the inner regions of Arp 220 (Downes & Solomon 1998). Matsushita et al. (2009) show that this starburst is optically-thick at 435 m, thus justifying the estimate that , and Downes & Eckart (2007) find a true dust temperature of K for the inner disk. Herschel observations presented by Rangwala et al. (2011) show that the dust has optical depth of at 100 m, and multiple molecular line diagnostics indicate the presence and pervasiveness of hot dust and gas (see also Ott et al. 2011).

Again, equation (33) sets the fundamental temperature scale for the protoplanetary disks embedded in highly star-forming galaxies and starbursts. Since star formation surface density and gas/dust surface density are highly correlated through the Schmidt law, regions with M⊙ yr-1 kpc-2 will have and the temperature of the system will be higher than the effective temperature by a factor of . One sees from these simple estimates that, although extreme, many systems may reach this limit.
Since the compact high- galaxies presented in Figure 7 may be the cores of present-day ellipticals (Hopkins et al. 2009), our expectation for the prevalence of planets in these metal-rich systems should be adjusted accordingly strongly downward. Although rare in the local universe, the conditions producing in equation (35) were more common in the high- universe, and the subsequent high temperatures and suppression of planet formation via gravitational instability or core accretion should affect the present day planetary mass density.
Finally, AGN activity can also heat the medium above . For a BH luminosity of ergs s-1, for . Assuming an isothermal sphere for the stellar mass distribution in the central regions of galaxies, this corresponds to , where is the velocity dispersion, about % of the total bulge mass. Supermassive BHs may undergo significant growth during rapid star formation episodes on multi-kpc scales. The planet population may thus be affected by both the episode of BH growth and the star formation itself.
6 Discussion
6.1 Caveats, Complications, & Uncertainties
Radiation Transport — Equation (5) is highly approximate. It applies only in the limit of a an overlying column of matter without sources, makes the Eddington approximation, and assumes both an infinite plane-parallel atmosphere and gray opacity. A real embedded star cluster has a distribution of sources (stars), whose light is reprocessed locally into the infrared by absorption, and which contributes to the local flux in the atmosphere. The radial distribution of sources , the distribution of dusty gas with respect to those sources, , the variation in the IMF as a function of radius , the variation in the dust-to-gas ratio and thus the opacity, will all affect the radial run of temperature with optical depth, .
A detailed exploration of these effects is beyond the scope of this work, but I note here that the formalism of Hubeny (1990) for distributed sources in plane-parallel atmospheres can be generalized to spherical systems with non-gray opacities (see, e.g., Whelan et al. 2011). However, more detailed radiation transport models should be coupled to a self-consistent calculation of the dynamics of star-forming and disrupting clusters since would otherwise be a free function. In addition, since star formation may be spatially correlated within individual star clusters, the radiation transport problem is likely to be further complicated by multi-dimensional effects (e.g., Krumholz et al. 2012), and, further, by the dynamics of merging sub-clumps.
The Optical Depth & Turbulence — Recent calculations suggest that massive clusters may be disrupted by radiation pressure on dust grains, and this feedback mechanism has been suggested as a way to regulate star formation on galaxy scales (Murray et al. 2005; Thompson et al. 2005; Krumholz & Matzner 2010; Murray et al. 2010; Andrews & Thompson 2011; Hopkins et al. 2012). The parameter space over which this feedback mechanism may dominate largely overlaps with the parameter space discussed in this work (e.g., M⊙ pc-2 or M⊙ yr-1 kpc-2). If the gaseous medium is highly turbulent, and in particular, if the radiation field itself drives that turbulence, then the effective optical depth for the reprocessed IR radiation may be less than the simple estimate of equation (8) (see Murray et al. 2005; Hopkins et al. 2012). Recent simulations by Krumholz & Thompson (2012) of sustained radiation pressure driven Rayleigh-Taylor convection (in 2D) in fact suggest that in these environments the value of the effective optical depth is decreased by a factor of , as low optical depth channels through the overlying medium are formed and the radiation field more efficiently escapes. In principle, this should decrease the temperature below the approximation of equation (5), but this effect has yet to be quantified in the super star cluster environment.
IMF — Observations imply that the light-to-mass ratio of a ZAMS stellar population may vary. The value of I scale to throughout this work, L⊙/M⊙, is approximately appropriate for a Salpeter IMF from M⊙. More precisely, and L⊙/M⊙ (see Fig. 2). For limits of M⊙, unrealistic for the low-mass stellar field population (e.g., Kroupa et al. 1993; Kroupa 2001; Chabrier 2003), decreases to . For a Kroupa IMF L⊙/M⊙. A somewhat more bottom-heavy IMF below 1 M⊙, but not as steep as Salpeter, as observed in the Galactic bulge by Zoccali et al. (2000), would yield similar values for . Stolte et al. (2006) measure the present day mass function in the young compact Galactic star cluster NGC 3603 and find a slope of from M⊙. In Arches, Stole et al. (2005) find a similar slope at high masses, but with a significant turnover at M⊙. Such a flatter than Salpeter slope at high masses, if extended to M⊙, and taking Kroupa from M⊙, would increase over our nominal value by a factor of .
The value of and its time dependence also change if the stellar population is rotating (Ekström et al. 2012). Levesque et al. (2012) (e.g., their Fig. 6) show that reaches a maximum at Myr, effectively extending the life of the massive stars that dominate the bolometric output of the stellar population by Myr over the non-rotating population. At an age of 5 Myr, the rotating population is times brighter for the same stellar mass, and at 10 Myr it is times brighter. Rotation would thus increase the temperatures of the protoplanetary disks of star clusters, all else being equal.
The normalization, shape, and high-mass slope of the IMF may also change as a function of cluster mass and surface density. Murray (2010) presents an argument that it is precisely the FIR optically-thick star clusters with the highest values of and that will deviate most strongly from a standard IMF, with larger . Such a correlation — or to some power — would strongly increase and with respect to equations (2) and (9) in the highest surface density systems. As an example, super star cluster M82-F was argued by Smith & Gallagher (2001) to be strongly inconsistent with a standard Kroupa IMF, and requires a low-mass cutoff of M⊙. Such an IMF would increase for the ZAMS population, increasing the inferred temperature in the first few Myr of evolution. A strongly bottom-heavy IMF, as has been claimed in elliptical galaxies (Van Dokkum & Conroy 2010, 2011; Wegner et al. 2012), and which may be a function of velocity dispersion (Spiniello et al. 2012), would go the other way, decreasing by a factor of or more.
Finally, there is evidence for a bottom-heavy IMF in elliptical galaxies (Van Dokkum & Conroy 2010, 2011; Wegner et al. 2012), which may be a function of velocity dispersion (Spiniello et al. 2012), and which would decrease the temperature by decreasing relative to the fiducial value used throughout this work.
Time Dependence — The central temperature of the star cluster is likely to change as a function of time, as the gas is used up, the stellar population grows, the stellar population evolves dynamically, and as the cluster is disrupted, ejecting the remaining gas and perhaps unbinding or expanding the stellar distribution. A more realistic treatment would couple the evolution of throughout the cluster with a dynamical calculation of cluster disruption, as in the simplified models of Murray et al. (2010), or in the (much lower mass) cases of numerical star cluster formation with realistic thermodynamics (e.g., Bate 2010, 2011, 2012; Krumholz et al. 2012).
In any case, since the timescale for the embedded cluster phase is likely to be a multiple of the dynamical timescale, the average inner cluster temperature may decrease rapidly from to as the dusty column trapping the radiation disperses. Since this timescale is of order the timescale required for planet formation Myr, planet formation may be fully quenched by the fact that the medium is above , or merely delayed for Myr until cooler climes prevail, and giant planets form.
A related point is that the planet formation timescale is shortened in the cluster environment because of the increased heating of the surface layers by the cluster irradiation (Section 4.3), radioactivity of the (potentially) large-scale starburst environment (Lacki 2012a), the very large cosmic ray ionization rates and gamma-ray fluxes expected in those environments (Lacki et al. 2010; Papadopolous 2010; Papadopolous et al. 2011; Lacki 2012b), or the UV irradiation from nearby massive stars (see Section 1). All act to increase the size of the active accreting zone in layered disks (Gammie 2001), and hence speed both the accretion of the disk onto the host star, and potentially the migration of planets in formation.
6.2 RV & Transit Surveys in Galactic Globular Clusters & Open Clusters
As discussed in Section 6.1 there are substantial uncertainties in the estimates of (blue), and especially (red) in Figures 5, 6, and 7. Even so, they make it clear that globular clusters, star clusters in the local universe, compact high- galaxies, and nuclear star clusters were born very hot, and that many of these systems were likely optically thick at birth, leading to above the ice line temperature . Given the discussion of Section 4 one would thus expect that these systems should not have been able to form gas- and ice-giants by core-accretion during their first Myr of evolution, that formation of similar systems by gravitational instability would have been prohibited in all but the most massive disks, and that there should not have been a delivery mechanism for water to terrestrial planets on these short timescales.
In Figure 6, I highlight 47 Tucanae (; McLaughlin & van der Marel 2005), which has been the subject of an intensive observational campaign to find giant planets via transits (Gilliland et al. 2000; Weldrake et al. 2005). Using our nominal numbers for 47 Tuc — and — I find that of the mass had . Changes of a factor of in , , or the effective radius for the stars change this fraction from to .
Given these substantial uncertainties, it is worth considering the implications of the hypothesis that the lack of planets observed in 47 Tuc is a result of a high temperature at birth. There are several possibilities, depending on whether or not planets form predominantly by core accretion or gravitational instability, and what the true frequency of giant planets is as a function of metallicity, independent of birth environment. If planets form predominantly by core accretion, and if the lack of giant planets in 47 Tuc in the survey of Gilliland et al. (2000) is indeed entirely because in its first Myrs of evolution, then I predict that globular clusters with similar metallicity, but lower will harbor giant planets if they had . For this reason, I highlight NGC 6366 in Figure 6, which has a metallicity comparable to 47 Tuc (; McLaughlin & van der Marel 2005), but an average stellar surface density that is times smaller. NGC 6366 is the only relatively high-metallicity globular cluster with substantially below 47 Tuc cataloged in McLaughlin & van der Marel (2005), and it is thus an ideal case for testing planet formation as a function of surface density at nearly fixed metallicity.
A similarly important test is the globular cluster NGC 6121 (M4), where a 2.5 MJupiter mass planet has been inferred by Sigurdsson et al. (2003). NGC 6121 has , and a simple extrapolation of Fischer & Valenti’s correlation between planet frequency and metallicity would suggest that it should harbor very few giant planets. Is this planet’s existence in conflict with our hypothesis for 47 Tuc? No. As shown in Figure 6, the effective temperature of NGC 6121 was likely substantially below at birth as a result of its low metallicity and surface density with respect to 47 Tuc.
The planet in NGC 6121 can also be thought of as a test for gravitational instability, which would then have to operate in a radiation environment of K, implying a massive protoplanetary disk (see Section 4.2).
Several additional systems are worth discussing in this context. In particular, the more metal-rich globular clusters of the Galaxy listed in McLaughlin & van der Marel (2005) are NGC 6440, 6441, and 6388 with , , , respectively. These are the hottest three systems significantly above , shown in red in Figure 6. Therefore, these systems also present a test of the core-accretion scenario, and this paper. If 47 Tuc indeed formed no (or few) gas- and ice-giants because , then NGC 6440, 6441, and 6388 should be similarly devoid.
I emphasize that such a set of tests would be complicated by the many effects that may inhibit planet formation in dense clusters (see Section 1). Nevertheless, comparing the planet population at different metallicity and at different stellar surface density is one of the few ways of understanding these joint dependencies.
Finally, note that one of the most compact and metal-rich of the Galactic open clusters is NGC 6791, which has been the subject of a number of transit surveys (Section 1), has K and , using M⊙, pc, , , and taking (Platais et al. 2011 and references therein), and thus its planet population should not be strongly affected by the effects described in this work.
6.3 Observations of Protoplanetary Disks in Dense Stellar Environments
The simple calculations shown in Figure 3 and the discussion of Section 3 indicate that the vertical structure of protoplanetary disks in dense stellar environments should be strongly modified from that derived for passive or active disks without external irradiation. The work of Stolte et al. (2004), (2006), and (2010) and others use NIR excess to investigate the properties and incidence of disks within clusters like NGC 3603 and Arches. More detailed calculations of disks with self-consistent thermodynamics and structure are warranted for observations now and coming (e.g., JWST) of stars and their disks in the most massive and dense Galactic clusters.
As an example, using the data collected in Table 2 from Portegies-Zwart et al. (2010), Arches has K and K for . NGC 3603 has lower temperature, and is not optically-thick for , but still has K. Trumpler 14 and Westerland 1 have similar stellar surface densities and thus similar temperatures to NGC 3603. Figure 3 and the scalings of Section 3 imply that the protoplanetary disks in these systems should be strongly modified by their radiation environment.
6.4 The Maximum Temperature of Dense Stellar Systems
The maximum stellar surface density observed in star clusters, elliptical galaxies, globular clusters, and other dense stellar systems is (Hopkins et al. 2010)
| (36) |
If this stellar surface density was formed in a single burst, , , and . Taking the maximum dust-to-gas ratio observed in galaxies to be (Muñoz-Mateos et al. 2009) implies that the maximum temperature it might be possible to achieve within a star cluster is
| (37) |
Compare with Figure 2. This temperature is equivalent to the effective insolation at a distance of AU around star of Solar luminosity, and it is perhaps the largest value of the IR cluster insolation that can be obtained in the central regions of dense stellar systems. Although exceeds the condensation temperatures of magnetite ( K), troilite ( K), and approaches the condensations temperatures of feldspar and forsterite this value is still substantially below the sublimation temperatures of the primary refractory condensates, and so it should not be possible to directly inhibit the formation of rocky planets.
6.5 The Fraction of All Star Formation Occurring above a Given Stellar Surface Density
If massive dense star clusters and galaxies in formation inhibit the formation of gas and ice giant planets by core-accretion, as implied by Sections 4 and 5, then it is worth asking about the fraction of all star formation that has occurred above the critical surface density , such that , as estimated in equation (21). Such a calculation requires several ingredients. Equation (9) implies that
| (38) |
where I have assumed that , and is the metallicity normalized such that , which enters into the dust opacity per unit gram of gas in equation (6). Over the history of most of the star formation in the universe, one expects to vary by dex. The total range in is likely smaller, only varying by (at most) a factor of , and it may be approximately constant. The total range in is quite large, spanning from M⊙ pc-2. Naively, then, the fraction of all stars formed above depends primarily on the cluster mass function , but also and , with a much smaller dependence on .
Typical functions for for clusters yield , but with a cutoff at high masses that is dependent on the galaxy observed. It is natural to take the maximum mass to be a fraction of the Toomre mass in a marginally stable galactic disk of gas surface density and scale-height , , but the star formation efficiency as a function of the collapsed gas cloud may vary as a function of its mass. Similarly, the relationship between cluster mass or richness and its size is likely not a simple power-law over the range from M⊙ (e.g., see discussions in Murray 2009; Murray et al. 2010; Adams 2010). In particular, for M⊙ (Lada & Lada 2003) and for M⊙ with pc. For larger mass clusters the relationship apparently steepens, with ( M⊙) (Walcher et al. 2005; Murray 2009).
Given these various uncertainties and unknowns I take a simple tack and make an estimate for an average galaxy that dominates the star formation rate of the universe at redshift . Such star-forming galaxies have gas surface densities times the Galaxy, with commensurately higher star formation rates per unit area. Their metallicities are likely sub-Solar on average by a factor of a few. If one assumes that a typical cluster size is that , then the fraction of all star formation occuring with K is just where
| (39) |
is the critical cluster mass above which (see eq. 21), and and are the minimum and maximum cluster masses, respectively. Taking , 2, and 4 pc, , M⊙, and M⊙, %, 27%, and 17% of stars are born in clusters with , respectively. For , these fractions decrease to %, 18%, and 8%, respectively.
In this context, it is worth noting the recent work of Gieles et al. (2010) who provide an explanation for the relation for stellar systems above M⊙ (see their Fig. 3). They show that dynamical processes increase the half-light radii () of clusters of Gyr timescales. Their initial configuration starts with , a constant surface density at all masses equivalent to M⊙ pc-2 and an effective temperature at zero-age main sequence of K from equation (2). Since the timescale for significant dynamical evolution in these simulations is 10 Myr or longer I expect systems that start with this value for to have throughout the crucial planet formation epoch. If such an initial function for the relation was in fact generically valid for M⊙, the arguments presented in this paper would imply that more than 50% of all stars were born in an environment hostile to formation of gas and ice giant planets via core accretion or gravitational instability.
Finally, in a study of the structure of elliptical galaxies, and compact galaxies at high redshift, Hopkins et al. (2009) estimates that the total mass in present-day ellipticals with stellar surface densities in excess of is %.
7 Conclusions
The basic conclusions of this work are as follows:
1. Massive star clusters with standard IMFs that form in a single burst of star formation are hot for a time comparable to the planet formation timescale, reaching fluxes equivalent to an effective temperature of K for Myr (Figure 1; eq. 2).
2. Embedded dusty star clusters reach a temperature larger than because they are optically-thick to their own reradiated FIR emission. For surface densities above M⊙ pc-2, Galactic dust-to-gas ratio, and gas fractions at birth of order unity, the characteristic temperature of star clusters exceeds the ice line temperature (Figure 2; eqs. 9, 21). See the discussion of uncertainties and caveats in Section 6.1.
3. Protoplanetary disks in such clusters are strongly isotropically irradiated, and this cluster irradiation dominates the thermodynamics of both passive and active disks around Solar-type stars at semi-major axes beyond AU, changing the disk structure (Figure 3; eqs. 12-14 and 18 & 19).
4. In the most massive dense star clusters, the temperature of protoplanetary disks should exceed the temperature for water ice condensation at K (Figures 5 & 6) while the cluster is embedded. This decreases the total amount of condensable material by a factor of , prohibiting formation of gas- and ice-giant planets if they form by core accretion (Section 4.1), and prohibiting habitability.
5. Planet formation by gravitational instability will also be suppressed in protoplanetary disks within clusters because Toomre’s . Typical disk masses that could become gravitationally unstable are required to exceed times the Minimum Mass Solar Nebula (Figure 4; Section 4.2; eqs. 22-24).
6. In these highly-irradiated environments, the overall accretion rate should be enhanced, leading to shorter disk lifetimes and less time to build planets. The migration rates of planets in gas or planetesimal disks are also likely to be influenced (Section 4.3).
7. Even accounting for their low metallicities, 47 Tuc and several other Galactic globular clusters plausibly exceeded the limiting surface density for their central regions to exceed , and this may be a factor in explaining why 47 Tuc appears to have a paucity of hot Jupiters (Figure 6; Section 5.2). A test of this scenario would be an RV/transit survey of NGC 6366; with a metallicity similar to 47 Tuc, but a much lower surface density, it should have abundant giant planets. Conversely, the relatively more metal-rich globulars NGC 6440, 6441, or 6388, which had even higher temperatures than 47 Tuc at birth should be devoid of planets (Figure 6; Section 6.2; related discussion of NGC 6121). A mutual comparison between planet populations in clusters of different metallicities, but at fixed surface density, and of different surface densities, but at fixed metallicity, would be very valuable.
8. Rapidly star-forming galaxies also maintain very high temperatures. Those with average star formation rate surface densities M⊙ kpc-2 yr-1 have central temperatures that approach , and should thus globally suppress planet formation (eq. 34). AGN activity might too. Simple estimates suggest that the quiescent compact high- galaxies plausibly attained temperatures exceeding during formation (Figure 7). The idea that these systems might be completely devoid of giant planets and habitable planets is startling. Because these systems may be the cores of today’s elliptical galaxies, and because a component of the Galactic bulge and M31’s bugle may have formed in such an extreme starburst, one generically expects future surveys of the planet populations in these environments (e.g., via microlensing) to show a paucity of giant planets per star, even though (and, indeed, because) these systems are metal-rich.
9. Finally, although the estimate is uncertain, between % of the stellar mass density formed in a star cluster with temperature exceeding , and thus our expectations for the inventory of planets, and their incidence per star as a function of birth environment and metallicity may be significantly impacted.
Acknowledgments
I gratefully acknowledge helpful conversations with Scott Gaudi at an early stage in this project. I thank Kris Stanek, Andy Gould, and Tony Piro for encouragement, and Kaitlin Kratter, Chris Kochanek, Scott Gaudi, and Fred Adams for a critical reading of the text. This work is dedicated to my grandpa, Alan T. Thompson.
References
- Adams et al. (2004) Adams, F. C., Hollenbach, D., Laughlin, G., & Gorti, U. 2004, ApJ, 611, 360
- Adams et al. (2006) Adams, F. C., Proszkow, E. M., Fatuzzo, M., & Myers, P. C. 2006, ApJ, 641, 504
- Adams (2010) Adams, F. C. 2010, ARA&A, 48, 47
- D’Alessio et al. (1997) D’Alessio, P., Calvet, N., & Hartmann, L. 1997, ApJ, 474, 397
- Andrews & Thompson (2011) Andrews, B. H., & Thompson, T. A. 2011, ApJ, 727, 97
- Armitage (2000) Armitage, P. J. 2000, A&A, 362, 968
- Armitage (2010) Armitage, P. J. 2010, Astrophysics of Planet Formation, pp. 294. Cambridge, UK: Cambridge University Press, 2010
- Baltz & Gondolo (2001) Baltz, E. A., & Gondolo, P. 2001, ApJ, 559, 41
- Bate (2000) Bate, M. R. 2000, MNRAS, 314, 33
- Bate (2010) Bate, M. R. 2010, MNRAS, 404, L79
- Bate (2011) Bate, M. R. 2011, MNRAS, 417, 2036
- Bate (2012) Bate, M. R. 2012, MNRAS, 419, 3115
- Bell & Lin (1994) Bell, K. R., & Lin, D. N. C. 1994, ApJ, 427, 987
- Boley (2009) Boley, A. C. 2009, ApJ, 695, L53
- Bonnell & Bate (1994) Bonnell, I. A., & Bate, M. R. 1994, MNRAS, 269, L45
- Boss (1997) Boss, A. P. 1997, Science, 276, 1836
- Boss (2000) Boss, A. P. 2000, ApJ, 536, L101
- Burke et al. (2006) Burke, C. J., Gaudi, B. S., DePoy, D. L., & Pogge, R. W. 2006, AJ, 132, 210
- Cai et al. (2008) Cai, K., Durisen, R. H., Boley, A. C., Pickett, M. K., & Mejía, A. C. 2008, ApJ, 673, 1138
- Chabrier (2003) Chabrier, G. 2003, PASP, 115, 763
- Chiang & Goldreich (1997) Chiang, E. I., & Goldreich, P. 1997, ApJ, 490, 368
- Chung et al. (2006) Chung, S.-J., Kim, D., Darnley, M. J., et al. 2006, ApJ, 650, 432
- Cochran et al. (2002) Cochran, W. D., Hatzes, A. P., & Paulson, D. B. 2002, AJ, 124, 565
- D’Alessio et al. (2001) D’Alessio, P., Calvet, N., & Hartmann, L. 2001, ApJ, 553, 321
- D’Alessio et al. (1999) D’Alessio, P., Calvet, N., Hartmann, L., Lizano, S., & Cantó, J. 1999, ApJ, 527, 893
- Downes & Solomon (1998) Downes, D., & Solomon, P. M. 1998, ApJ, 507, 615
- Downes & Eckart (2007) Downes, D., & Eckart, A. 2007, A&A, 468, L57
- Durisen et al. (2007) Durisen, R. H., Boss, A. P., Mayer, L., et al. 2007, Protostars and Planets V, 607
- Ekström et al. (2012) Ekström, S., Georgy, C., Eggenberger, P., et al. 2012, A&A, 537, A146
- Fatuzzo & Adams (2008) Fatuzzo, M., & Adams, F. C. 2008, ApJ, 675, 1361
- Fischer & Valenti (2005) Fischer, D. A., & Valenti, J. 2005, ApJ, 622, 1102
- Fregeau et al. (2006) Fregeau, J. M., Chatterjee, S., & Rasio, F. A. 2006, ApJ, 640, 1086
- Gammie (1996) Gammie, C. F. 1996, ApJ, 457, 355
- Gammie (2001) Gammie, C. F. 2001, ApJ, 553, 174
- Genzel et al. (2008) Genzel, R., Burkert, A., Bouché, N., et al. 2008, ApJ, 687, 59
- Gieles et al. (2010) Gieles, M., Baumgardt, H., Heggie, D. C., & Lamers, H. J. G. L. M. 2010, MNRAS, 408, L16
- Gilliland et al. (2000) Gilliland, R. L., Brown, T. M., Guhathakurta, P., et al. 2000, ApJ, 545, L47
- Gonzalez (1997) Gonzalez, G. 1997, MNRAS, 285, 403
- Gonzalez et al. (2001) Gonzalez, G., Brownlee, D., & Ward, P. 2001, Icarus, 152, 185
- Gorti & Hollenbach (2009) Gorti, U., & Hollenbach, D. 2009, ApJ, 690, 1539
- Gorti et al. (2009) Gorti, U., Dullemond, C. P., & Hollenbach, D. 2009, ApJ, 705, 1237
- Han & Gould (1995) Han, C., & Gould, A. 1995, ApJ, 449, 521
- Hartman et al. (2005) Hartman, J. D., Stanek, K. Z., Gaudi, B. S., Holman, M. J., & McLeod, B. A. 2005, AJ, 130, 2241
- Hartman et al. (2009) Hartman, J. D., Gaudi, B. S., Holman, M. J., et al. 2009, ApJ, 695, 336
- Hidas et al. (2005) Hidas, M. G., Ashley, M. C. B., Webb, J. K., et al. 2005, MNRAS, 360, 703
- Holden et al. (2011) Holden, L., Landis, E., Spitzig, J., & Adams, F. C. 2011, PASP, 123, 14
- Hopkins et al. (2009) Hopkins, P. F., Bundy, K., Murray, N., et al. 2009, MNRAS, 398, 898
- Hopkins et al. (2010) Hopkins, P. F., Murray, N., Quataert, E., & Thompson, T. A. 2010, MNRAS, 401, L19
- Kennedy & Kenyon (2008) Kennedy, G. M., & Kenyon, S. J. 2008, ApJ, 673, 502
- Kriek et al. (2008) Kriek, M., van Dokkum, P. G., Franx, M., et al. 2008, ApJ, 677, 219
- Kiraga & Paczynski (1994) Kiraga, M., & Paczynski, B. 1994, ApJ, 430, L101
- Kratter & Murray-Clay (2011) Kratter, K. M., & Murray-Clay, R. A. 2011, ApJ, 740, 1
- Kratter et al. (2010) Kratter, K. M., Murray-Clay, R. A., & Youdin, A. N. 2010, ApJ, 710, 1375
- Kroupa et al. (1993) Kroupa, P., Tout, C. A., & Gilmore, G. 1993, MNRAS, 262, 545
- Kroupa (2001) Kroupa, P. 2001, MNRAS, 322, 231
- Kruijssen (2012) Kruijssen, J. M. D. 2012, arXiv:1208.2963
- Krumholz & Matzner (2009) Krumholz, M. R., & Matzner, C. D. 2009, ApJ, 703, 1352
- Krumholz & Thompson (2012) Krumholz, M. R., & Thompson, T. A. 2012, arXiv:1203.2926
- Krumholz et al. (2012) Krumholz, M. R., Klein, R. I., & McKee, C. F. 2012, ApJ, 754, 71
- Lacki et al. (2010) Lacki, B. C., Thompson, T. A., & Quataert, E. 2010, ApJ, 717, 1
- Lacki (2012) Lacki, B. C. 2012a, arXiv:1204.2584
- Lacki (2012) Lacki, B. C. 2012b, arXiv:1204.2580
- Lada & Lada (2003) Lada, C. J., & Lada, E. A. 2003, ARA&A, 41, 57
- Laughlin & Adams (1998) Laughlin, G., & Adams, F. C. 1998, ApJ, 508, L171
- Laughlin (2000) Laughlin, G. 2000, ApJ, 545, 1064
- Laws et al. (2003) Laws, C., Gonzalez, G., Walker, K. M., et al. 2003, AJ, 125, 2664
- Lecar et al. (2006) Lecar, M., Podolak, M., Sasselov, D., & Chiang, E. 2006, ApJ, 640, 1115
- Levesque et al. (2012) Levesque, E. M., Leitherer, C., Ekstrom, S., Meynet, G., & Schaerer, D. 2012, ApJ, 751, 67
- Levin (2007) Levin, Y. 2007, MNRAS, 374, 515
- Lissauer et al. (2009) Lissauer, J. J., Hubickyj, O., D’Angelo, G., & Bodenheimer, P. 2009, Icarus, 199, 338
- Lodders (2003) Lodders, K. 2003, ApJ, 591, 1220
- Matsushita et al. (2009) Matsushita, S., Iono, D., Petitpas, G. R., et al. 2009, ApJ, 693, 56
- Matzner & Levin (2005) Matzner, C. D., & Levin, Y. 2005, ApJ, 628, 817
- Mizuno (1980) Mizuno, H. 1980, Progress of Theoretical Physics, 64, 544
- Mochejska et al. (2002) Mochejska, B. J., Stanek, K. Z., Sasselov, D. D., & Szentgyorgyi, A. H. 2002, AJ, 123, 3460
- Mochejska et al. (2004) Mochejska, B. J., Stanek, K. Z., Sasselov, D. D., et al. 2004, AJ, 128, 312
- Mochejska et al. (2005) Mochejska, B. J., Stanek, K. Z., Sasselov, D. D., et al. 2005, AJ, 129, 2856
- Mochejska et al. (2006) Mochejska, B. J., Stanek, K. Z., Sasselov, D. D., et al. 2006, AJ, 131, 1090
- Montalto et al. (2007) Montalto, M., Piotto, G., Desidera, S., et al. 2007, A&A, 470, 1137
- Muench et al. (2002) Muench, A. A., Lada, E. A., Lada, C. J., & Alves, J. 2002, ApJ, 573, 366
- Muñoz-Mateos et al. (2009) Muñoz-Mateos, J. C., Gil de Paz, A., Boissier, S., et al. 2009, ApJ, 701, 1965
- Murray et al. (2005) Murray, N., Quataert, E., & Thompson, T. A. 2005, ApJ, 618, 569
- Murray (2009) Murray, N. 2009, ApJ, 691, 946
- Murray et al. (2010) Murray, N., Quataert, E., & Thompson, T. A. 2010, ApJ, 709, 191
- Murray (2011) Murray, N. 2011, ApJ, 729, 133
- Murray et al. (2011) Murray, N., Ménard, B., & Thompson, T. A. 2011, ApJ, 735, 66
- Nagamine et al. (2006) Nagamine, K., Ostriker, J. P., Fukugita, M., & Cen, R. 2006, ApJ, 653, 881
- Nascimbeni et al. (2012) Nascimbeni, V., Bedin, L. R., Piotto, G., De Marchi, F., & Rich, R. M. 2012, A&A, 541, A144
- Olczak et al. (2012) Olczak, C., Kaczmarek, T., Harfst, S., Pfalzner, S., & Portegies Zwart, S. 2012, arXiv:1207.2256
- Ott et al. (2011) Ott, J., Henkel, C., Braatz, J. A., & Weiß, A. 2011, ApJ, 742, 95
- Papadopoulos (2010) Papadopoulos, P. P. 2010, ApJ, 720, 226
- Papadopoulos et al. (2011) Papadopoulos, P. P., Thi, W.-F., Miniati, F., & Viti, S. 2011, MNRAS, 414, 1705
- Pasquini et al. (2012) Pasquini, L., Brucalassi, A., Ruiz, M. T., et al. 2012, arXiv:1206.5820
- Paulson et al. (2004) Paulson, D. B., Saar, S. H., Cochran, W. D., & Henry, G. W. 2004, AJ, 127, 1644
- Pickett et al. (2003) Pickett, B. K., Mejía, A. C., Durisen, R. H., et al. 2003, ApJ, 590, 1060
- Platais et al. (2011) Platais, I., Cudworth, K. M., Kozhurina-Platais, V., et al. 2011, ApJ, 733, L1
- Podolak & Zucker (2004) Podolak, M., & Zucker, S. 2004, Meteoritics and Planetary Science, 39, 1859
- Pollack et al. (1996) Pollack, J. B., Hubickyj, O., Bodenheimer, P., et al. 1996, Icarus, 124, 62
- Portegies Zwart et al. (2010) Portegies Zwart, S. F., McMillan, S. L. W., & Gieles, M. 2010, ARA&A, 48, 431
- Proszkow & Adams (2009) Proszkow, E.-M., & Adams, F. C. 2009, ApJS, 185, 486
- Quinn et al. (2012) Quinn, S. N., White, R. J., Latham, D. W., et al. 2012, arXiv:1207.0818
- Rafikov (2005) Rafikov, R. R. 2005, ApJ, 621, L69
- Rangwala et al. (2011) Rangwala, N., Maloney, P. R., Glenn, J., et al. 2011, ApJ, 743, 94
- Rice et al. (2011) Rice, W. K. M., Armitage, P. J., Mamatsashvili, G. R., Lodato, G., & Clarke, C. J. 2011, MNRAS, 418, 1356
- Rosvick & Robb (2006) Rosvick, J. M., & Robb, R. 2006, AJ, 132, 2309
- Santos et al. (2001) Santos, N. C., Israelian, G., & Mayor, M. 2001, A&A, 373, 1019
- Santos et al. (2004) Santos, N. C., Israelian, G., & Mayor, M. 2004, A&A, 415, 1153
- Sasselov & Lecar (2000) Sasselov, D. D., & Lecar, M. 2000, ApJ, 528, 995
- Semenov et al. (2003) Semenov, D., Henning, T., Helling, C., Ilgner, M., & Sedlmayr, E. 2003, A&A, 410, 611
- Sigurdsson et al. (2003) Sigurdsson, S., Richer, H. B., Hansen, B. M., Stairs, I. H., & Thorsett, S. E. 2003, Science, 301, 193
- Sirko & Goodman (2003) Sirko, E., & Goodman, J. 2003, MNRAS, 341, 501
- Spiniello et al. (2012) Spiniello, C., Trager, S. C., Koopmans, L. V. E., & Chen, Y. P. 2012, ApJ, 753, L32
- Spurzem et al. (2009) Spurzem, R., Giersz, M., Heggie, D. C., & Lin, D. N. C. 2009, ApJ, 697, 458
- Stolte et al. (2004) Stolte, A., Brandner, W., Brandl, B., Zinnecker, H., & Grebel, E. K. 2004, AJ, 128, 765
- Stolte et al. (2005) Stolte, A., Brandner, W., Grebel, E. K., Lenzen, R., & Lagrange, A.-M. 2005, ApJ, 628, L113
- Stolte et al. (2006) Stolte, A., Brandner, W., Brandl, B., & Zinnecker, H. 2006, AJ, 132, 253
- Stolte et al. (2010) Stolte, A., Morris, M. R., Ghez, A. M., et al. 2010, ApJ, 718, 810
- Thompson et al. (2005) Thompson, T. A., Quataert, E., & Murray, N. 2005, ApJ, 630, 167 [TQM]
- Throop & Bally (2005) Throop, H. B., & Bally, J. 2005, ApJ, 623, L149
- van Dokkum et al. (2008) van Dokkum, P. G., Franx, M., Kriek, M., et al. 2008, ApJ, 677, L5
- van Dokkum & Conroy (2010) van Dokkum, P. G., & Conroy, C. 2010, Nature, 468, 940
- van Dokkum & Conroy (2011) van Dokkum, P. G., & Conroy, C. 2011, ApJ, 735, L13
- van Saders & Gaudi (2011) van Saders, J. L., & Gaudi, B. S. 2011, ApJ, 729, 63
- Vorobyov & Basu (2010) Vorobyov, E. I., & Basu, S. 2010, ApJ, 714, L133
- Walcher et al. (2005) Walcher, C. J., van der Marel, R. P., McLaughlin, D., et al. 2005, ApJ, 618, 237
- Ward (1997) Ward, W. R. 1997, Icarus, 126, 261
- Ward (1997) Ward, W. R. 1997, ApJ, 482, L211
- Wegner et al. (2012) Wegner, G. A., Corsini, E. M., Thomas, J., et al. 2012, AJ, 144, 78
- Weldrake et al. (2005) Weldrake, D. T. F., Sackett, P. D., Bridges, T. J., & Freeman, K. C. 2005, ApJ, 620, 1043
- Whelan et al. (2011) Whelan, D. G., Johnson, K. E., Whitney, B. A., Indebetouw, R., & Wood, K. 2011, ApJ, 729, 111
- Weidenschilling (1977) Weidenschilling, S. J. 1977, Ap&SS, 51, 153
- Zhu et al. (2012) Zhu, Z., Hartmann, L., Nelson, R. P., & Gammie, C. F. 2012, ApJ, 746, 110
- Zoccali et al. (2000) Zoccali, M., Cassisi, S., Frogel, J. A., et al. 2000, ApJ, 530, 418