Modeling and Analysis of a Spectrum of the Globular Cluster NGC 2419
Abstract
NGC 2419 is the most distant massive globular cluster in the outer Galactic halo. It is unusual also due to the chemical peculiarities found in its red giant stars in recent years. We study the stellar population of this unusual object using spectra obtained at the 1.93-m telescope of the Haute-Provence Observatory. At variance with commonly used methods of high-resolution spectroscopy applicable only to bright stars, we employ spectroscopic information on the integrated light of the cluster. We carry out population synthesis modeling of medium-resolution spectra using synthetic stellar atmosphere models based on a theoretical isochrone corresponding accurately to the observed color-magnitude diagram. We study the influence of non-Local Thermodynamic Equilibrium for some chemical elements on our results. The derived age (12.6 Gyr), [Fe/H]=-2.25 dex, helium content Y=0.25, and abundances of 12 other chemical elements are in a good qualitative agreement with published high-resolution spectroscopy estimates for red giant members in the cluster. On the other hand, the derived element abundance, [ dex (the mean of , and ), differs from the published one ( dex) for selected red giants in the cluster and may be explained by a large dispersion in the -element abundances recently discovered in NGC 2419. We suggest that studies of the integrated light in the cluster using high-resolution spectrographs in different wavelength regions will help to understand the nature of these chemical anomalies.
1 Special Astrophysical Observatory, Russian Academy of Sciences, N.Arkhyz, KChR, 369167, Russia
2 Kazan Federal State University, Kremlevskaya street 18, Kazan, 420008, Russia
3 IRAP, Université de Toulouse, CNRS, 14 Avenue Edouard Belin, 31400 Toulouse, France
1 INTRODUCTION
Hubble Space telescope (HST) observations and the development of new powerful high-resolution spectrographs at large ground-based telescopes demonstrate that GCs do not consist of stars of a single age and metallicity (see the review paper by Gratton et al. (2012) and references therein). In addition to stars having a chemical composition similar to that of the Galactic halo, GCs contain stars built of the matter that has passed through the full -cycle and proton capture of light nuclei. Contrary to the field stars, they often show Sodium - Oxygen anti-correlations (Gratton et al. (2012)). Anomalies of chemical and stellar composition are found for many Galactic GCs. Explaining the origin and chemical evolution of stars in GCs is very important for understanding the processes of nucleosynthesis and chemical evolution in the early Universe.
Although deep stellar photometry is available for many Galactic GCs thanks to HST high-resolution images, high resolution spectroscopy in a wide spectral range for many faint stars in GCs is still very expensive. This is why we decided to explore the possibility of studying the detailed chemical composition in GCs using medium-resolution spectra. In the present paper, we fit medium-resolution spectra of NGC2419 integrated along different slit positions with stellar atmosphere models taking into account the stellar mass function.
NGC2419 is a unique massive GC () in the outer Galactic halo, at a distance of 84 kpc. Its large half-light radius ( pc, Ibata et al., 2011) is similar to that of ultra-compact dwarf galaxies. The stellar content and mass function, the chemical composition and the structure of NGC 2419 have been studied actively. The blue horizontal branch (BHB) of the cluster is very extended (di Criscienzo et al. (2011)). The stellar mass function and the properties of horizontal branch (HB) stars, Hertzsprung gap stars and blue stragglers have been explored in a number of papers using deep color-magnitude diagrams () (Harris et al. 1997, Dalessandro et al. 2008, di Criscienzo et al. 2011, Bellazzini et al. 2012). These studies gave information about the age and metallicity of NGC 2419. The Helium and alpha-element abundances were estimated in the aforementioned papers by comparison of the of NGC 2419 with model isochrones (Pietrinferni et al. (2004, 2006)). An unusually high mass-to-luminosity (M/L) and the possible presence of a black hole in the center of the cluster were suggested by investigators of its stellar dynamics (Ibata 2011a,b). Measurements of stellar velocities at higher spectral resolution (Baumgardt et al., 2009) did not favor the last hypothesis. So far detailed chemical compositions are known only for brightest red giant stars of NGC 2419 (Cohen et al. (2011), Shetrone et al. (2001)). In the latter papers the unusual chemical composition and other properties of the cluster were interpreted as a signature of its possible extragalactic origin.
In this paper we carry out population synthesis modeling of medium-resolution spectra of NGC2419. Our main aim was to obtain theoretical spectra in good agreement with the observed ones. This task is solved for the first time. The lowest resolution used in the literature for such a task was (Colucci et al., 2012). At variance with the population systhesis modeling of Schiavon et al. (2002), we use theoretical spectra of stars calculated using stellar atmosphere models. Medium resolution allows us to extend the method to extragalactic GCs at distances of Mpc.
In section 2 we describe our observational material and procedure of spectra reduction. In section 3 we explain our method of theoretical population synthesis. In section 4 we derive the age and metallicity of NGC2419 and a mean Helium abundance by comparison of theoretical and observed Balmer line profiles. In section 5 we describe how we derive chemical abundances for the main chemical elements by fitting absorption-line features in the observed spectra with theoretical ones. Our conclusions are formulated in section 6.
2 OBSERVATIONS AND DATA REDUCTION
Medium-resolution long slit () spectra of NGC 2419 were obtained with the spectrograph CARELEC (Lemaitre et al. (1990)) at the 1.93-m telescope of the Haute-Provence Observatory. The total exposure time was 2.6 h (Table 1), with a seeing of . The grism 300 grooves/mm and the slit width provided a resolution of Å pix-1, FHHMÅ and spectral range Å. He and Ne lamps were exposed at the beginning and the end of each night for wavelength calibration. The spectrophotometric standard star HR1544 (Hamuy et al., 1992, 1994) was observed for relative calibration of the spectral sensitivity of the spectrograph. Lick standard stars (Worthey et al. (1994), Table 1) were observed each night for calibration of radial velocities and spectrophotometric indices. Note that our observing program also included other distant Galactic GCs. Separate papers will be devoted to their spectroscopic analysis.
Data reduction and analysis were carried out using MIDAS (European Southern Observatory Munich Image Data Analysis System) (Banse et al., 1983) and IRAF (Image Reduction and Analysis Facility) 11 1 http://iraf.noao.edu/. Cosmic-ray rejection was made using the program filter/cosmic in MIDAS. A map of hot pixels was prepared prior to the masking process. The accuracy of the dispersion solution obtained using the He-Ne lamp is Å. Possible systematic uncertainties may arise due to differences in optical paths from the lamp to the spectrograph and from a position on the sky to the spectrograph. Such uncertainties were corrected using wavelengths of prominent emission night-sky lines, e.g. Å. One-dimensional spectra were extracted using the procedure apsum in IRAF. This program allows one to correct the curvature of spectra along the dispersion, which may arise due to a slight slope of the slit, or as a result of the influence of atmosphere dispersion if the slit position angle has a large parallactic angle (PA¿¿ 0).
The signal-to-noise ratio (S/N) achieved in the summed one-dimensional spectrum is in the middle of the spectral range. The heliocentric radial velocity of NGC 2419 derived by cross-correlation using radial velocity standard stars and the program fxcor in IRAF agrees well with the literature one: km s-1 (Harris, 1996)22 2 http://physwww.mcmaster.ca/ harris/mwgc.dat. For calculating this value using bright night-sky emission lines we took into account the heliocentric correction (Stumpff, 1980) and possible systematics of our wavelength scale with respect to the standard one.
3 MODELING OF INTEGRATED LIGHT SPECTRA OF GLOBULAR CLUSTERS
3.1 Selection and optimization of isochrones
Modeling the GC integrated light was based on synthetic spectra for stars with physical parameters corresponding to the selected isochrone. We use isochrones of Bertelli et al. (2009) having a wide ranges of age (), heavy element abundance () and Helium abundance ().
After initialization of a specified isochrone, its optimization was carried out to reduce the amount of calculations. For the stars (places of isochrones) which contribute less than to the cluster light we use the following maximum steps of temperature and surface gravity: and . For the other points the steps were twice as large. The places of isochrones with the initial stellar masses which contribute less than to the cluster mass were excluded from the calculations. Finally the resulting isochrones contained 55-65 points. So possible errors of modeling caused by the optimization procedure were reduced to of the continuum flux.
3.2 Theoretical spectra of stars
We used a modified package ( Shimansky et al., 2003) for calculating synthetic blanketed spectra of stellar atmospheres. Plane-parallel, hydrostatic stellar atmosphere models for a given initial set of parameters (, , ) were obtained by interpolation of a model grid of Castelli & Kurucz (2004) using a method described in Suleimanov (1996). We used the solar chemical composition and isotopic abundance of some chemical elements (Anders & Grevesse, 1989).
For each stellar atmosphere we derived fluxes propagating in three basic directions with angles to the stellar surface , , . Then the stellar surface was divided into sectors with a step of for all orienting angles. For each corner the area and the angle of visibility were calculated. The radiation intensity of the sector reaching an observer was found by interpolation of the specific intensities in the three basic angles according to the actual visibility angle. The integrated stellar radiation was obtained by integration of the radiation from each sector according to the area and local radial velocities caused by the rotation of the star and radial tangential macro-turbulence. Finally, the obtained spectra were broadened according to the instrumental spectral-line profile of the spectrograph, using a Gaussian function with a half-width corresponding to the resolution.
Before normalization, spectra with and without atomic lines and molecular bands were calculated simultaneously in the spectral range –Å. Modeling the spectra with different wavelength steps has shown that Å is the maximum value when errors in the line profiles are less than of the continuum flux. We took into account all sources of continuous opacity tabulated in the packages (Suleimanov, 1992) and (Sakhibullin & Shimansky, 1997), approximately 570000 atomic lines from the list of Kurucz (1994) and 28 molecular bands in the optical spectral range calculated according to the theory of Nersisyan et al. (1989) kindly provided by Ya.V. Pavlenko. We used the empirical oscillator strengths calculated by Shimansky (2011) for the 750 most intense lines.
Additionally, we found that it was necessary to take into consideration the molecule, powerful bands of which are seen in the spectrum of NGC 2419 in the range –Å. Therefore we included calculation of the opacities for 75000 molecular bands and from the catalogs of Kurucz (1994) in the package . Modeling of the Balmer-line profiles was done using of the Stark broadening theories of Vidal, Cooper & Smith (1973) and Griem (1960). For the other lines we calculated the standard Voigt profile taking into account the following information: Doppler broadening of lines due to thermal motion of atoms, microturbulent velocity , natural damping, Stark broadening according to the approximation of Kurucz & Furenlid (1979) and the van der Waals broadening constants defined using the classical formula Unsold (1955) with the the scaling factor in the range – (Shimansky, 2011).
3.3 Non-LTE effects
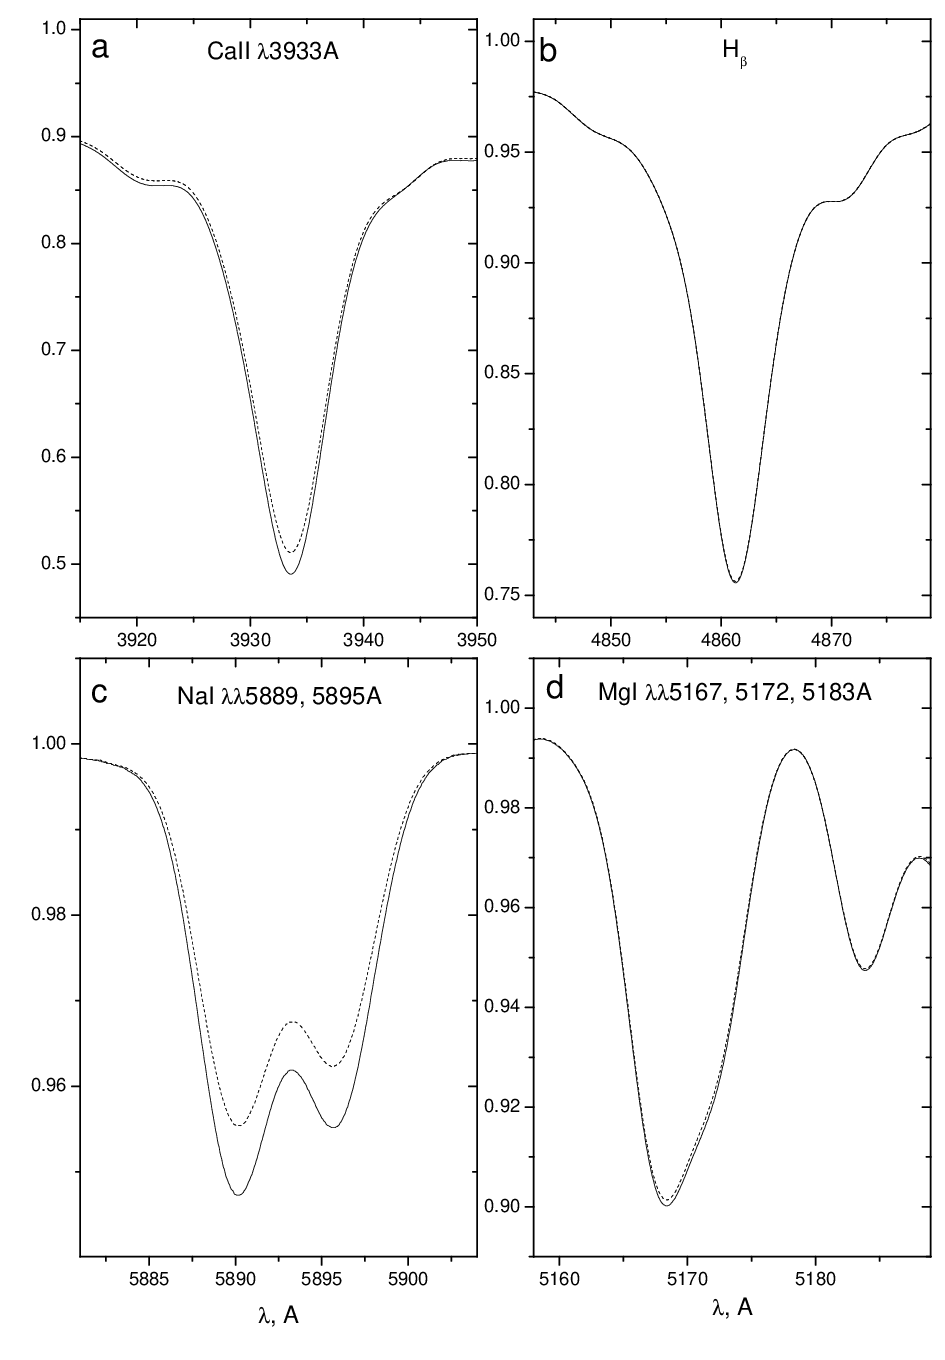
We modeled the line profiles of chemical elements taking into account departures from Local Thermodynamic Equilibrium (LTE) according to the methods developed by Ivanova et al. (2004) and Shimansky et al. (2008) for binary stellar systems. The non-LTE atomic populations for each atmosphere model were calculated using the linearization method by Auer & Heasley (1976) with the package of Sakhibullin (1983). We used: -level model of the atom (Shimansky et al., 2008), -level model of the atom (Mashonkina et al., 2000), -level model of the atom (Shimansky et al., 2000), - level model of the ion (Shimansky, 2002), -level model of the atom (Menzhevitski et al., 2012), -level model of the atom (Ivanova et al., 2000) and -level model of the ion (Ivanova et al., 2002). The influence of non-LTE effects on line profiles for different chemical elements in the summed spectrum of NGC 2419 is shown in Fig.1 for the physical parameters and chemical composition obtained by us (see Sec. 4). Note that non-LTE effects do not affect the HI line intensities (increase by of the central line depth) due to the dominance of HI in almost all stellar atmospheres of the cluster. Lines of heavy elements are enhanced with very different amplitudes taking into account non-LTE effects. The intensity of the resonance doublet Å grows a lot (up to of the central depth). As a result, the sodium abundance is reduced by dex. The non-blended resonance line Å is significantly influenced by non-LTE effects (up to of the central depth). On the other hand, the lines and do not change. Unfortunately, we have no near-IR spectra containing the lines , having significant non-LTE corrections.
3.4 Calculation of integrated spectra
The calculated spectra for stars belonging to the selected isochrone were summed according to their radii and initial mass function . In this work the Chabrier (2005) initial mass function (IMF) was used
where . It gives a good approximation of the stellar luminosity function (LF) found in the literature for NGC 2419 (Bellazzini et al., 2012). The Chabrier IMF matches well the theoretical mass distributions of Padoan & Nordlund (2004) for lowest mass stars. Finally, normalization of the integrated spectrum was done by division of the spectrum with its lines and molecular bands by the corresponding continuum.
4 EVOLUTIONARY PARAMETERS OF NGC 2419
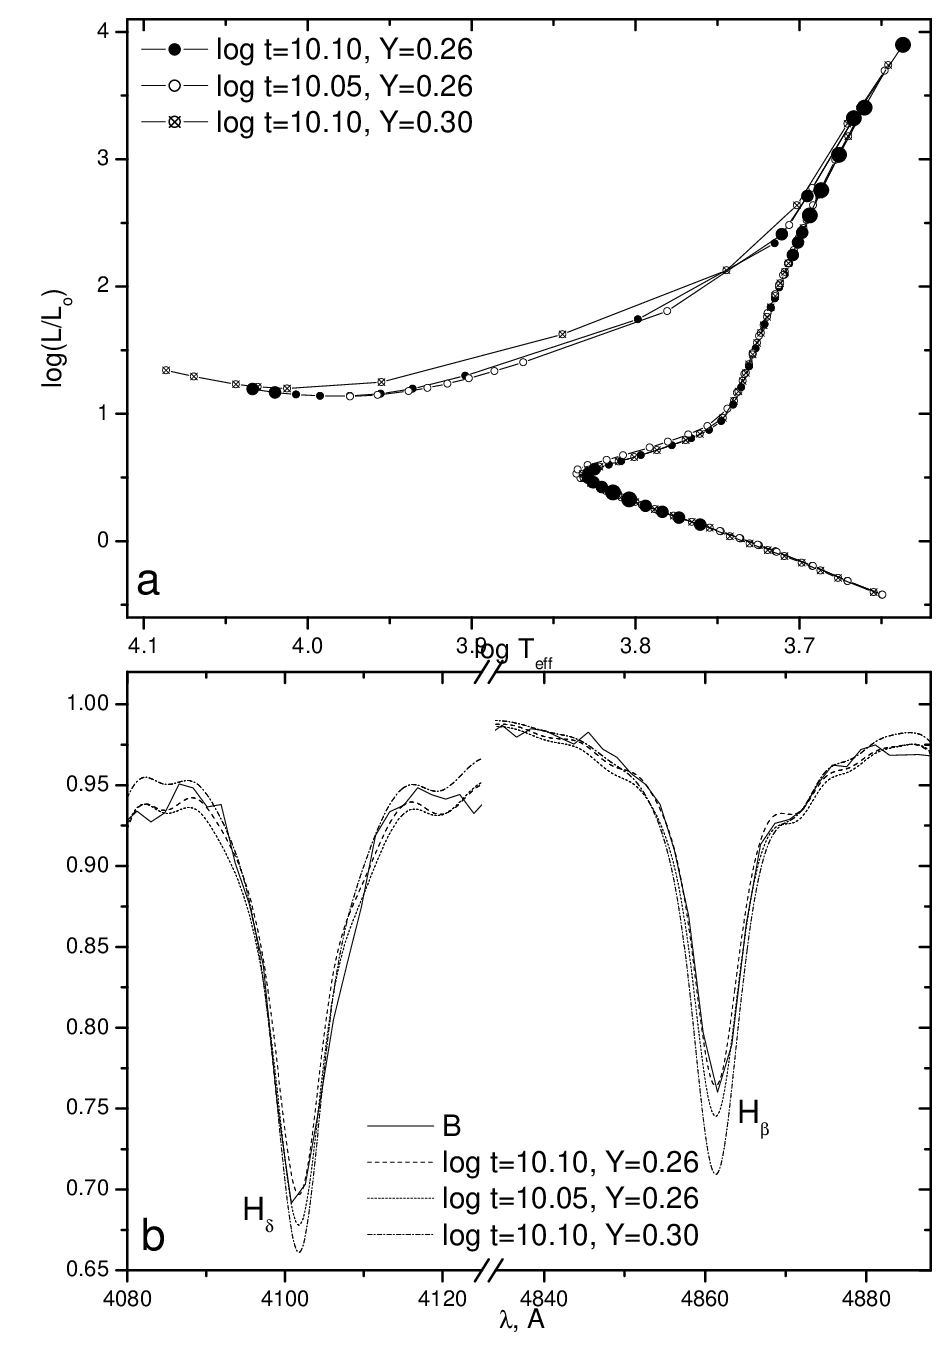
The isochrone used for the cluster is defined by its parameters (age , helium abundance and metallicity )33 3 The abundance of chemical elements according to their mass is defined as follows: , where corresponds to the hydrogen abundance, stands for the Helium abundance, and means the heavier elements abundance. The values for the Sun are and (Anders & Grevesse, 1989) which may be derived by comparison of the observed and theoretical spectra. The index of heavy-element abundance is related to the chemical composition in the atmospheres of stars belonging to the cluster (): . It can be obtained with an accuracy of dex from the analysis of synthetic spectra (see below). To define the initial and we adopt the metallicity from the literature (Bellazzini et al., 2012). Note that chemical elements synthesized in deep stellar layers of some red giant and blue horizontal branch (BHB) stars may be delivered to the surface and change the initial chemical composition (e.g. Smiljanic et al., 2007). However, our analysis shows that an upper limit for the contribution of these stars to the total flux in the spectral range –Å is only . We show in Fig. 2 the contribution of different parts of the isochrone to the total spectrum. If we assume that chemical anomalies due to the mixing effect do not exceed dex, the errors are (Pereira et al., 2011) and the determined abundances of chemical elements for the cluster are close to their initial values.
We derive and as follows. We vary them until the theoretical profiles for the lines , , fit the observed ones, because the content influences the shape of the Balmer lines. Additionally, it is important to ensure that the theoretical profiles for the lines Å and Å fit well the observed ones for a given Ca content. If the ionization balance between and is reached, our calculations are considered to be near completion. In Fig. 2 (a) we present isochrones for different ages and . The best-fit age and He abundance for NGC 2419 are and . In Fig. 2 (b) we show the theoretical line profiles and compared to the observed ones. When reducing the age, the temperature of stars increases, and the Main sequence turn-off point (MSTO) gets bluer. This leads to an increased contribution of early-type Main Sequence -dwarfs to the integrated light of the cluster. These stars have strong Balmer lines. As a result of reducing the age, all lines appear to be more intense simultaneously in the doppler cores and in the wings. On the other hand, increasing the He abundance does not influence strongly the shape of the isochrone (position of the Main Sequence, sub-giant and giant branches) but it increases the luminosity of hot HB stars. It is known that the doppler cores of the Balmer lines are deep in the spectra of such stars, because gas pressure is not strong in their atmospheres. Therefore, increasing leads to a sharp increase of the central intensities of the Balmer lines and a weakening of their wings. Note that increases less than (see Fig. 2 (b)). In summary, and influence differently the line profiles, and this fact allows us to disentangle these two parameters.
Finally, we obtained and . With these values the central depths and the equivalent widths () for the observed and theoretical HI line profiles agree with an accuracy of and , respectively. The obtained age of NGC 2419 agrees well with the results of published photometric studies. Bellazzini et al., 2012 analyzed narrow-band stellar photometry. They argue that the age of the cluster is in the range – using isochrones of Dotter et al. (2007) with [Fe/H], , and of Pietrinferni et al. (2004) with [Fe/H], , . The same age range – was obtained earlier by Harris et al. (1997) using HST stellar photometry data.
5 CHEMICAL COMPOSITION OF NGC 2419
We determined the mean chemical abundances in stellar atmospheres in a regular way by fitting the observed line profiles with theoretical ones. However the moderate spectral resolution did not allow us to determine the abundances using individual lines and molecular bands merging in blends. This is why we determined the abundance of each element taking into account the agreement between the observed and theoretical spectra in all blends containing its lines in the studied spectral range. In this fitting process all chemical elements were divided into 5 groups:
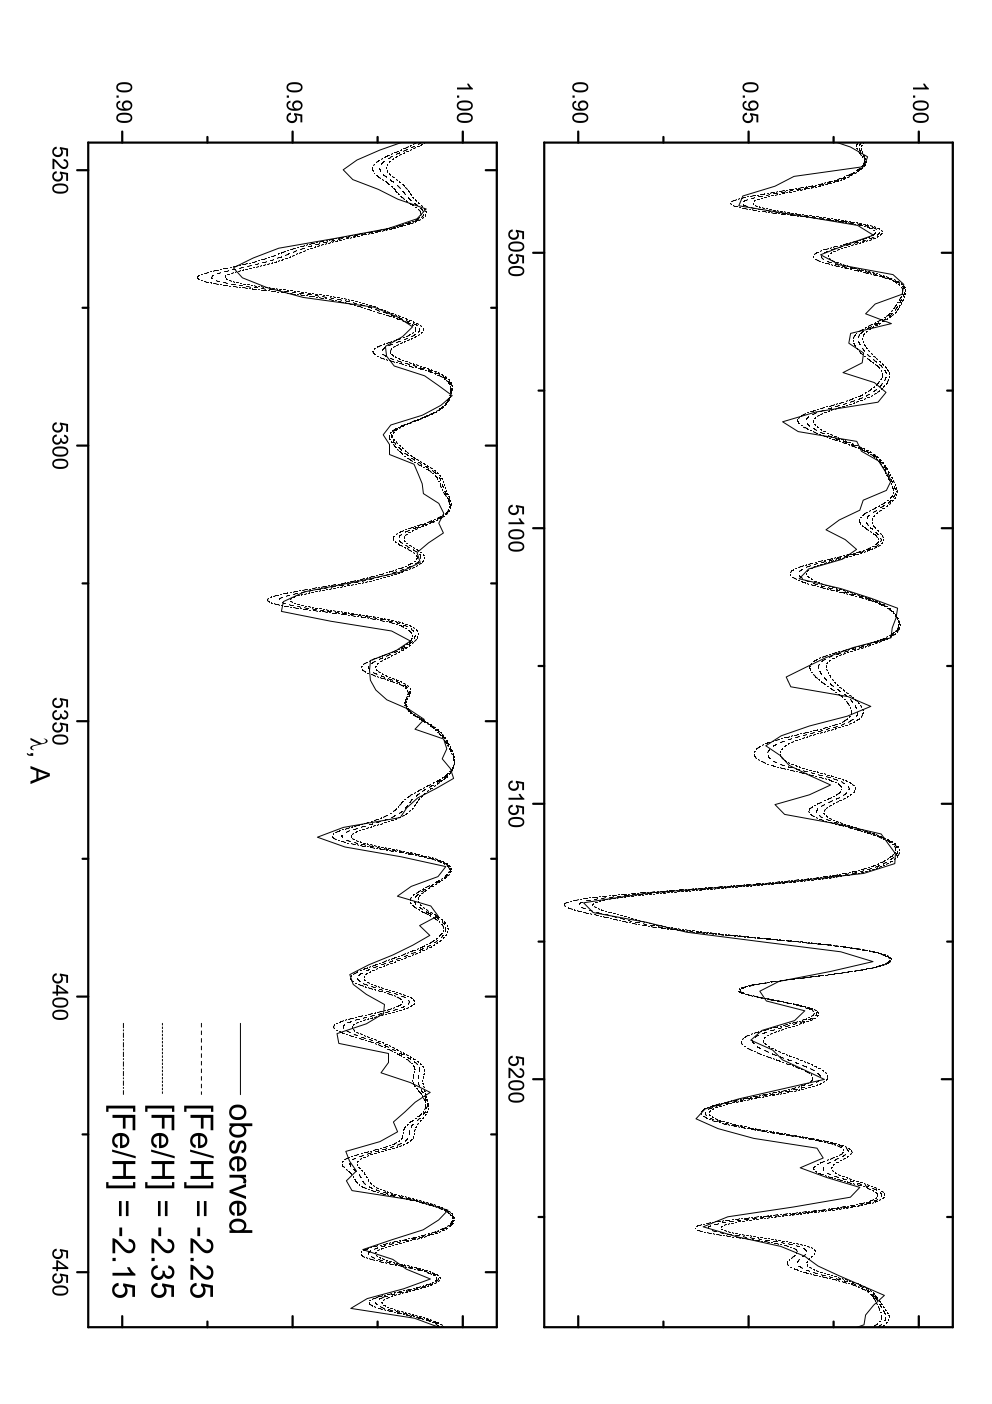
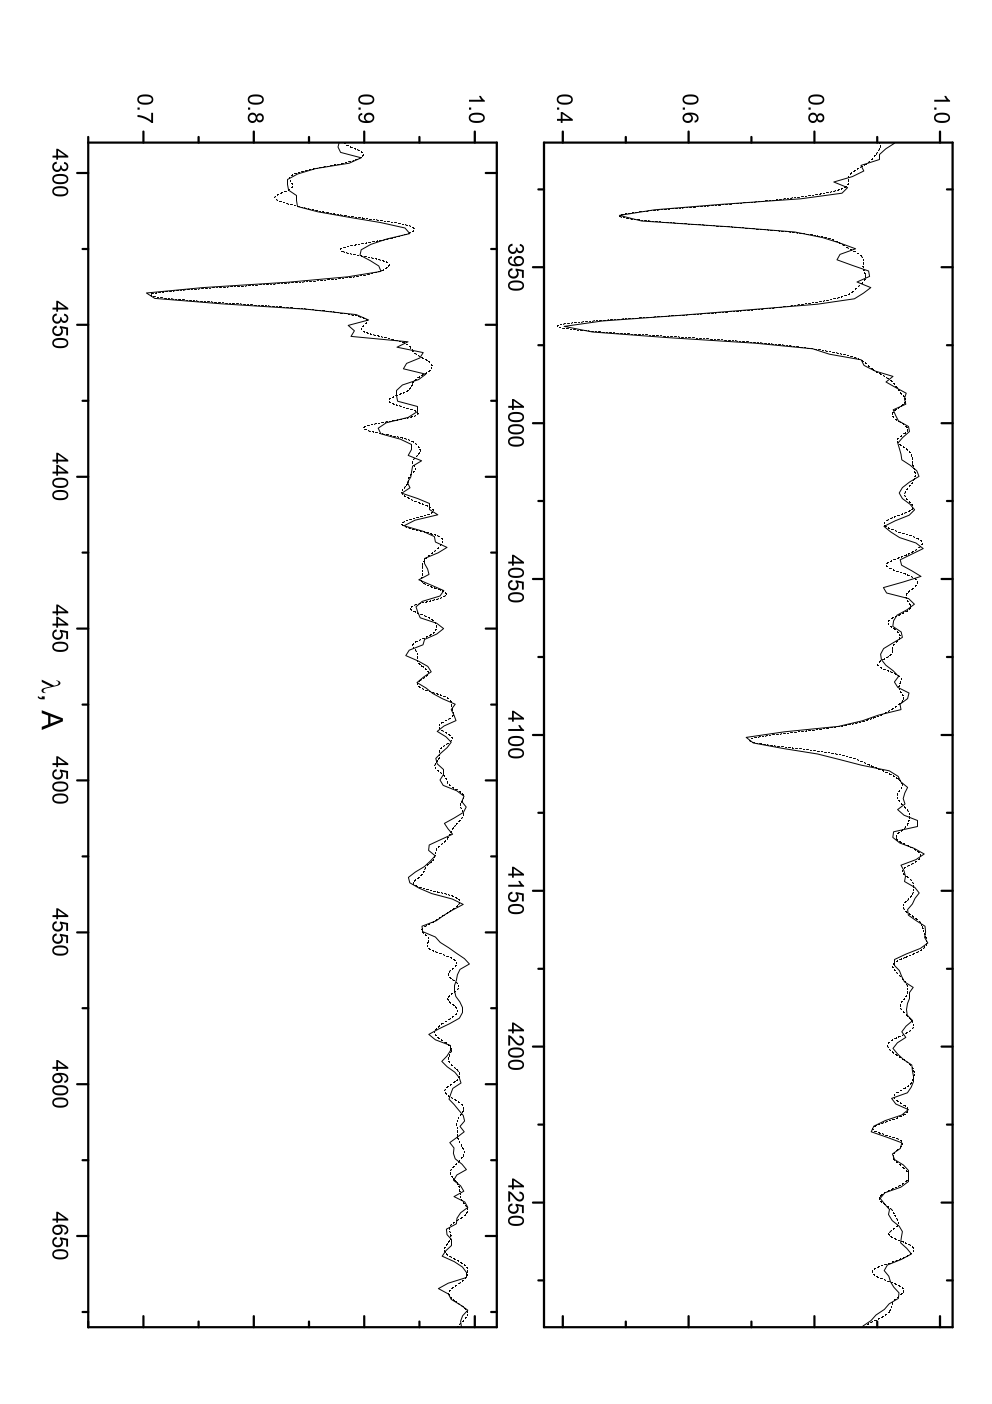
1) This group is composed of elements (, , ) with lines and molecular bands dominating in spectra. It is possible to derive unambiguous estimates of the abundances using these lines. They are accurate (up to dex). Comparison of the observed and the theoretical spectra calculated for different is shown in Fig. 3.
2) This group consists of elements (, , , , , , ) with weak and blended lines and molecular bands. Their abundances were derived taking into account the abundances for the elements of the first group derived by us. The accuracy of abundances in this case is lower ( dex).
3) This group consists of elements with spectroscopic features too weak to be detected in the studied spectral range. However, they influence the molecular and ionization equilibrium of other elements. It is possible to obtain their approximate abundances from the analysis of this equilibrium. For example, we argue that part of the C atoms forms the molecule if the O abundance is enhanced. This reduces the intensity of the molecular bands and . Therefore, testing the equilibrium between different observed and theoretical intensities of these bands allows one to estimate abundances of all group elements. The abundances are interdependent.
4) Sodium () with lines strongly distorted by interstellar components was considered in this group.
5) This group consists of elements (, , , ) which do not have lines detectable at medium resolution. However, they influence the equilibrium of electrons in stellar atmospheres. Abundances of these elements were considered to be equal to that of other elements of this group.
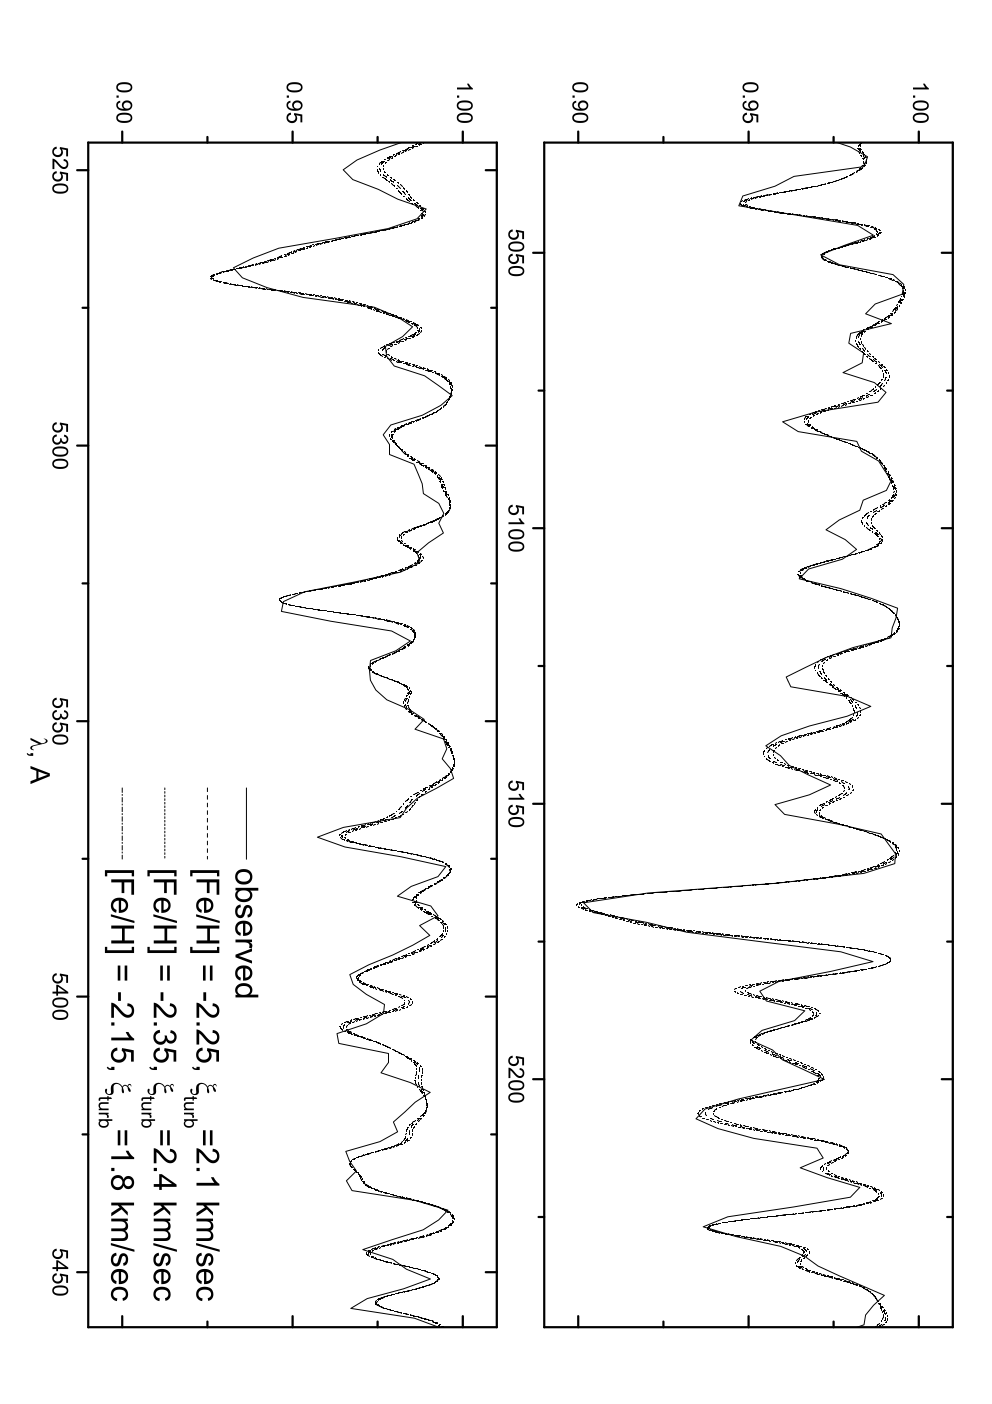
The microturbulent velocity was considered to be equal for all stars of the cluster. We derived it from the best fit of weak and strong Fe lines in the observed spectra. Comparison between the observed and theoretical spectra calculated with different and is shown in Fig. 4. As a result of this analysis, a mean microturbulent velocity was defined to be km/s. Note that it is not quite correct to use such value , bearing in mind a variety of stellar luminosities and temperatures in the cluster. Nevertheless, our calculations have shown that the hottest MSTO stars (K, ) and red giant branch (RGB) stars (–K, –) are the main contributors to the observed spectrum. For such stars our adopted value of corresponds well to the typical values found in the literature (Cayrel et al., 2004, Luck & Heiter, 2005).
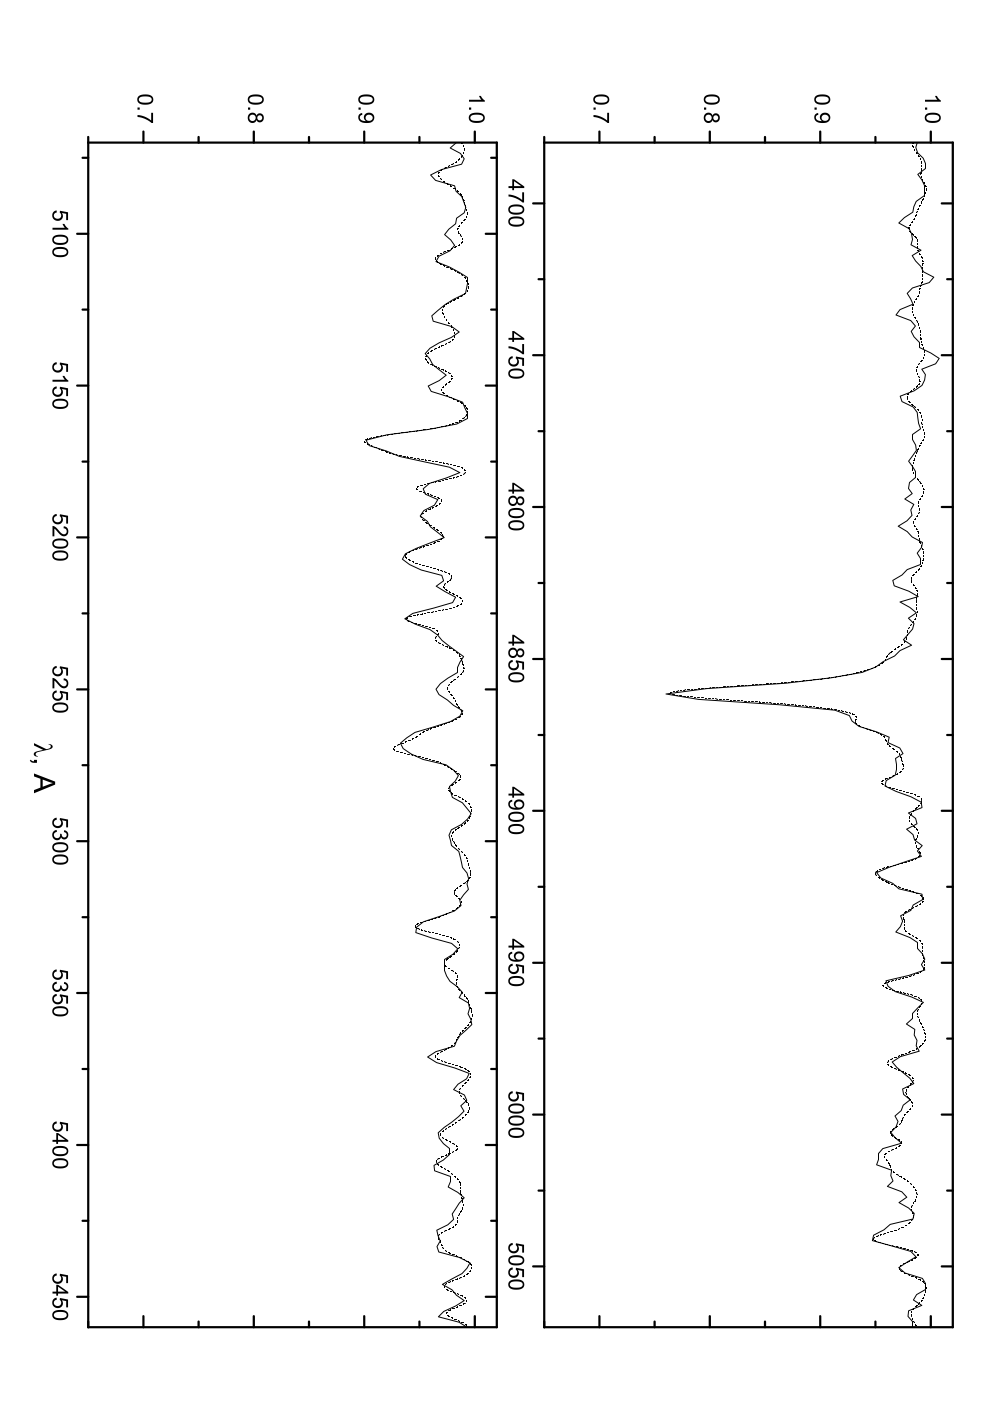
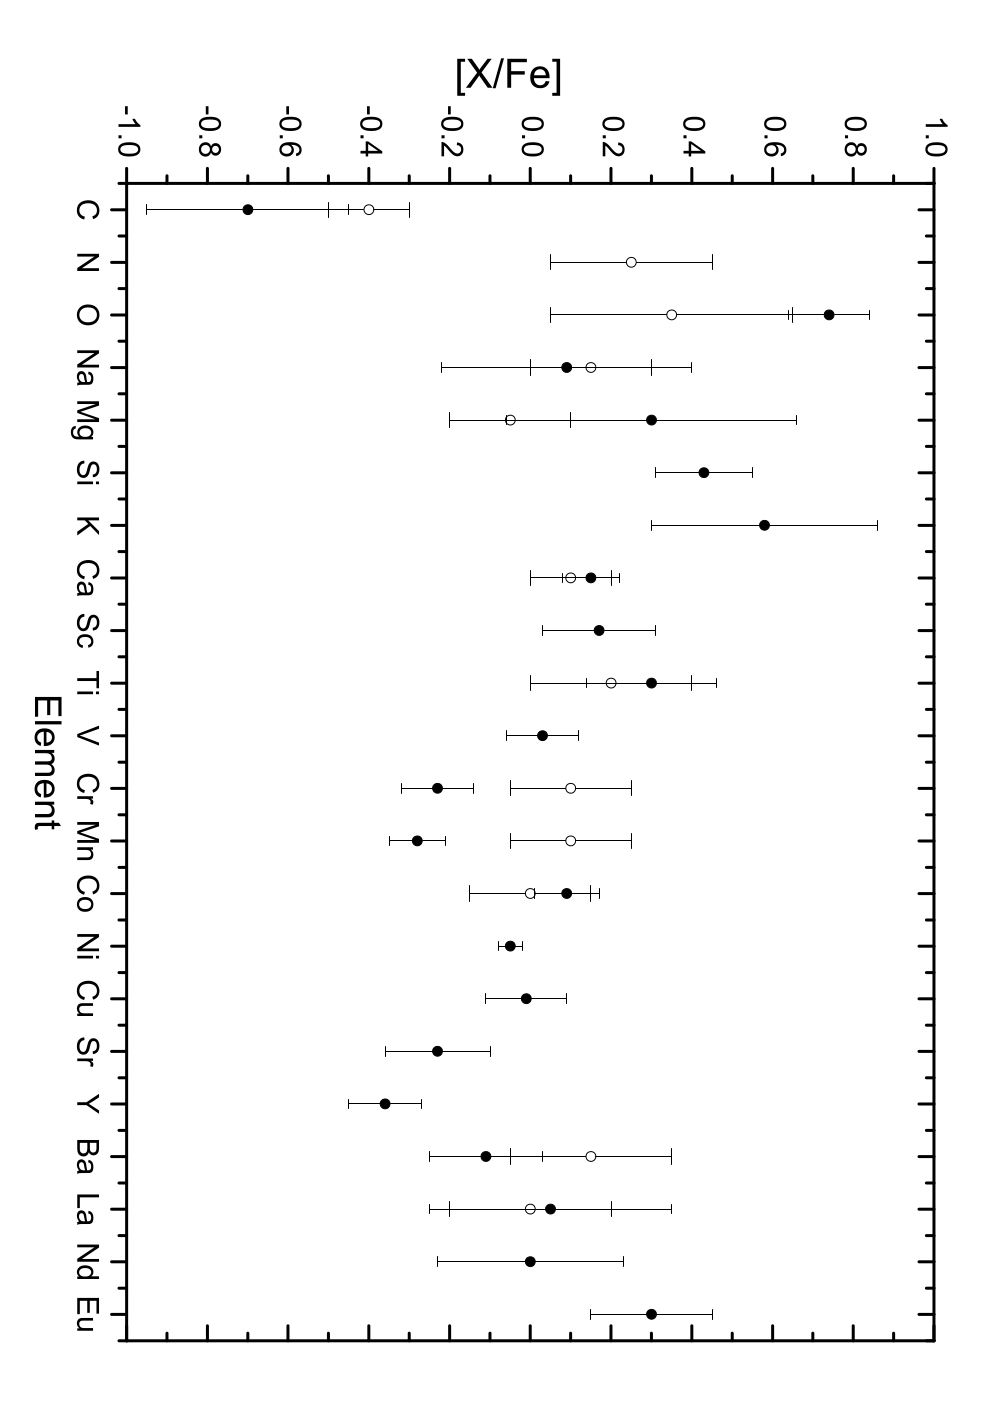
A final comparison of the observed and theoretical spectra is shown in Fig. 5. The obtained abundances are presented in Fig. 6 and Table 2 in comparison with the data from Cohen et al. (2011) and Shetrone et al. (2001).
One may conclude that the derived chemical composition of NGC 2419 agrees qualitatively with the data published for individual stars in the cluster. Cohen et al. (2011) obtained on average dex higher O and Mg abundance for red giants in NGC 2419. The abundances of other elements agree with our estimates within the errors ( dex). It is worth noting that the O abundance was estimated indirectly by us, using the influence of this element on the molecular bands , . This estimate may not be very accurate. Note that Cohen et al. (2011) determined studying the infrared triplet Å which is influenced strongly by non-LTE effects. We suggest that to obtain an accurate O abundance it is important to resort to non-LTE analysis. We derived the abundance of Mg using a strong not-blended line Å and a total flux distribution in the range of the index (Å). The abundance of Mg in Cohen et al. (2011) was determined at high spectral resolution using strong lines including Å. We calculated non-LTE corrections for in atmospheres of different stars of the cluster and obtained values less than dex. The reason for the high found in the literature was not clear to us. It is worth noting that there are significant variations of the Mg abundance in the red giants studied by Cohen et al. (2011), Shetrone et al. (2001) and differences in the methods of measuring and the theoretical calculation of strong lines in the literature and in our analysis. When we finished writing this paper, papers by Mucciarelli et al. (2012) and Cohen & Kirby (2012) were published. A large dispersion of and abundances for RGB stars in NGC 2419 was discovered by these authors and may partially explain the reason of the low derived by us.
The chemical composition of NGC 2419 has features distinguishing it from typical old GCs, or from a number of field stars in our Galaxy (Borkova & Marsakov, 2005, Pritzl & Venn (2005), Venn et al., 2004, see also discussion in Cohen et al. (2011)). According to the present theory of chemical evolution for our Galaxy, (see the classical results of Samland (1998) and later studies of chemical evolution of Alibes et al., 2001 and Kobayashi et al., 2006) there should be overabundances of , , , , , and of an order – dex for stars with metallicity [Fe/H] dex. Additionally, a deficit of [Na/Fe], [Al/Fe] of the order dex is also expected. Other elements (including ) have solar X/Fe abundance ratios . Table 2 shows that both estimates of the C abundance for NGC 2419 indicate its extreme deficit dex which cannot be explained by supply of the material synthesized in the last stages of evolution on its surface. Overabundances of , in stars of the cluster (– dex) appear to be much less than the ones suggested by Samland (1998). has a value close to the Solar one.
6 CONCLUSION
We have carried out theoretical population synthesis modeling for NGC 2419, an unusual GC in the outer Galactic halo, using medium-resolution spectra. To solve the task we developed a new method which may be applied to medium-resolution spectra () with high signal-to-noise ratio () in a wide spectral range Å. The efficiency of this method is higher for higher spectral resolution, wider spectral range and larger . The example considered in this paper is almost limiting for these parameters. We used as an initial approximation the isochrone, the IMF, and distribution the cluster stars according to their masses, radii, and using the published theoretical isochrone corresponding best to the observed (Dalessandro et al., 2008; Bellazzini et al., 2012). We summed the synthetic blanketed stellar spectra calculated using the models of stellar atmospheres according to the Chabrier (2005) IMF which gives a good approximation of the stellar LF found in the literature for NGC 2419 (Bellazzini et al., 2012). Fitting of the observed spectra by the theoretical ones was made iteratively in several stages. Finally, we adopted the chemical composition of stars corresponding to the selected isochrone. To determine the age and helium content of the stars we analyzed mainly the depth and the shape of the wings of HI lines, because these are independent of other parameters. Then we varied the Fe abundance, since these lines dominate the optical spectrum, even at low metallicity. After optimization of the aforementioned main parameters (age, , He and Fe abundance), we fitted the C, Mg, and Ca abundances. We found that molecular bands , and lines are some of the most prominent features in the spectrum of NGC 2419. To derive abundances of other chemical elements it was necessary to analyze blends of many lines. Finally, we managed to estimate abundances of 14 elements including 3 alpha-elements (Ca, O, Mg) and Ti. We obtained age=12.6 Gyr, [Fe/H] dex, and [/Fe] as the mean of , and . The derived chemical composition (except for the alpha-elements) agrees well with the published one, which was obtained using high-resolution spectra for 8 RGB stars of the cluster (Cohen et al. (2011), Shetrone et al. (2001)), and confirms the conclusion about the chemical peculiarity of NGC 2419. The abundance of Mg () derived by us agrees within the errors with a mean value for 49 RGB stars obtained by Mucciarelli et al. (2012) () using high-resolution spectroscopy.
The method presented here employs information from all the stars in the cluster, and may be successfully applied to integrated-light spectroscopic studies of extragalactic GCs. It is still impossible to obtain deep , or high-resolution, high spectra for such objects. In these cases, an initial approximation for the age may be derived using Lick indices, or full spectral fitting using simple stellar population models (see e.g. Sharina et al. (2010) and references therein).
ACKNOWLEDGEMENTS. S.M.E. acknowledges partial support by the Russian Foundation for Basic Research (RFBR) grant 11-02-00639, and a Russian-Ukrainian RFBR grant 11-02-90449; support of the Ministry of Education and Science of the Russian Federation, the contract 14.740.11.0901 and proposal 2012-1.5-12-000-1011-004. S.V.V. acknowledges support by the RFBR grant 10-02-01145-a. We thank Th. H. Puzia for interesting comments.
References
- [1] A. Alibes, J. Labay, R. Canal, 2001, A&A, 370, 1103
- [2] E. Anders, N. Grevesse, Geochimica et Cosmochimica Acta, 1989, 53, 197
- [3] L.H. Auer, J. Heasley, 1976, ApJ, 205, 165
- [4] K. Banse, Ph. Crane, Ch. Ounnas, D. Ponz 1983, // MIDAS, in Proc. of DECUS, Zurich, p. 87
- [5] H. Baumgardt, P. Cote, M. Hilker, M. Rejkuba, S. Mieske, S.G. Djorgovski, P. Stetson, 2009, MNRAS, 396, 2051
- [6] M. Bellazzini, E. Dalessandro, A. Sollima, R. Ibata, 2012, MNRAS, 423, 844
- [7] G. Bertelli, E. Nasi, L. Girardi, P. Marigo, 2009, A&A, 508, 355
- [8] T. V. Borkova, V. A. Marsakov, 2005, Astronomy Reports, 49, 405
- [9] F. Castelli, R.L. Kurucz, 2004, IAU Symp. 210 ”Modeling of Stellar Atmospheres”. A20
- [10] R. Cayrel, E. Depagne, M. Spite et al., 2004, A&A, 416, 1117
- [11] G. Chabrier, 2005, The initial mass function 50 years later, Astrophysics and Space Science Library, 327, 41
- [12] J.G. Cohen, E.N. Kirby, 2012, ApJ 760, 86
- [13] J.G. Cohen, W. Huang, E.N. Kirby, 2011, ApJ 740, 60
- [14] J. E. Colucci, R. A. Bernstein, S. A. Cameron, A. McWilliam, ApJ, 2012, 746, 29
- [15] E. Dalessandro, B. Lanzoni, F.R. Ferraro, F. Vespe, M. Bellazzini, R.T. Rood, 2008, ApJ 681, 311
- [16] A. Dotter, B. Chaboyer, D. Jevremovic et al., 2007, AJ, 134, 376
- [17] M. di Criscienzo, F. D’Antona, A. P. Milone, P. Ventura, V. Caloi, R. Carini, A. D’Ercole, E. Vesperini, G. Piotto, 2011, MNRAS 414, 3381
- [18] R. Gratton, E. Carretta, A. Bragaglia, 2012, A&ARv, 20, 50
- [19] H.R. Griem, 1960, ApJ, 132, 883
- [20] M. Hamuy, N.B. Suntzeff, S. R. Heathcote, A. R. Walker, P.Gigoux, M. M. Phillips, 1992, PASP, 104, 533
- [21] M. Hamuy, N.B. Suntzeff, S. R. Heathcote, A. R. Walker, P.Gigoux, M. M. Phillips, 1994, PASP, 106, 566
- [22] W.E. Harris, 1996, AJ, 112, 1487 (2010 edition)
- [23] W.E. Harris et al., 1997, ApJ, 114, 1030
- [24] R. Ibata, A. Sollima, C. Nipoti, M. Bellazzini, S.C. Chapman, E. Dalessandro, 2011, ApJ, 738, 186
- [25] R. Ibata, A. Sollima, C. Nipoti, M. Bellazzini, S.C. Chapman, E. Dalessandro, 2011, ApJ, 743, 43
- [26] D.V. Ivanova, N.A. Sakhibullin, V.V. Shimansky, 2004, Astronomy Reports, 48, 476
- [27] D.V. Ivanova, N.A. Sakhibullin, V.V. Shimansky, 2002, Astronomy Reports, 46, 390
- [28] D.V. Ivanova, V.V. Shimansky, Astronomy Reports, 44, 376
- [29] C. Kobayashi, H. Umeda, K. Nomoto et al., 2006, ApJ, 653, 1145
- [30] R.L. Kurucz, I. Furenlid, Sample Spectral Atlas for Sirius, 1979, SAO Special Rep., 387, 1
- [31] R.L. Kurucz, SAO CD-Roms, (Cambridge, MA02138, USA)
- [32] G. Lemaitre, D. Kohler, D. Lacroix, J.-P. Meunier, A. Vin, Astron. Astrophys., 1990, 228, 546
- [33] R.E. Luck, U. Heiter, 2005, AJ 129, 1063
- [34] L.I. Mashonkina, V.V. Shimansky, N.A. Sakhibullin, 2000, Astronomy Reports, 44, 790
- [35] V.S. Menzhevitski, V.V. Shimansky, N.N. Shimanskaya, 2012, Astrophysical Bulletin, 67, 245
- [36] A. Mucciarelli, M. Bellazzini, R. Ibata, T. Merle, S. C. Chapman, E. Dalessandro, A. Sollima, 2012, MNRAS, 426, 2889
- [37] S.E. Nersisyan, A.V. Shavrina, A.A. Yaremchuk, 1989, Astrofizika, 30, 247
- [38] P. Padoan, A. Nordlund, 2004, ApJ, 617, 559
- [39] C.B. Pereira, J.V. Sales Silva, C. Chavero et al., 2011, A&A, 533, 51
- [40] A. Pietrinferni, S. Cassisi, M. Salaris, F. Castelli, 2006, ApJ, 642, 797
- [41] A. Pietrinferni, S. Cassisi, M. Salaris, F. Castelli, 2004, ApJ, 612, 168
- [42] B.J. Pritzl, K.A. Venn, M. Irwin, 2005, AJ, 130, 2140
- [43] M. Samland, 1998, ApJ, 496, 155
- [44] N.A. Sakhibullin, V.V. Shimansky, Astronomy Reports, 41, 378
- [45] N.A. Sakhibullin, 1983, Trudy Kazan. gor. astron. obs., 48, 9
- [46] R.P. Schiavon, S. M. Faber, B.V. Castilho, J.A. Rose, ApJ , 2002, 580, 850
- [47] M.E. Sharina, R. Chandar, T.H. Puzia, P. Goudfrooij, E. Davoust, 2010, MNRAS, 405, 839
- [48] M.D. Shetrone, P. Cote, W.L. Sargent, 2001, ApJ 548, 592
- [49] V.V. Shimansky, S.A. Pozdnyakova N.V. Borisov, I.F. Bikmaev et al, 2008, Astronomy Letters, 34, 423
- [50] V.V. Shimansky, N.V. Borisov, N.N. Shimanskaya, Astronomy Reports, 2003, 47, 763
- [51] V.V. Shimansky, L.I. Mashonkina, N.A. Sakhibullin, 2000, Astronomy Reports, 44, 530
- [52] V.V. Shimansky, 2002, Astronomy Reports, 46, 127
- [53] N.N. Shimanskaya, I.F. Bikmaev, V.V. Shimansky, 2011, Astrophysical Bulletin, 66, 255
- [54] R. Smiljanic, G.F. Porto de Mello, L. da Silva, 2007, A&A, 468, 679
- [55] P. Stumpff, 1980, A&A Suppl. Ser., 1980, 41, 1
- [56] V.F. Suleimanov, 1996, Astronomy Letter, 22, 92
- [57] V.F. Suleimanov, Astron. Astrophys. Trans., 1992, 2, 197
- [58] A. Unsold, 1955, Physik der Sternatmospheren, (Springer, Berlin–Gottingen–Heidelberg, 1955
- [59] K.A. Venn, M. Irwin, M.D. Shetrone, C.A. Tout, V. Hill, E. Tolstoy, 2004, AJ, 128, 1177
- [60] C.R. Vidal, J. Cooper, E.W. Smith, 1973, A&A Suppl. Ser., 25, 37
- [61] G. Worthey, S.M. Faber, J.J. Gonzalez, D. Burnstein, 1994, ApJ Suppl. Ser., 94, 687
| Object | Data | Exposition, sec. | Slit position, degr. |
|---|---|---|---|
| NGC 2419 | 1.12.08 | 4x600, 300 | 111 + scan |
| 2x1200 | 180 | ||
| 3.12.08 | 2x1800, 600 | 148 | |
| HR1544 | 1.12.08 | 2 | 180 |
| HR8924 | 1.12.08 | 1 | 180 |
| HR1805 | 1.12.08 | 2 | 180 |
| HR2002 | 1.12.08 | 2 | 180 |
| HR3422 | 1.12.08 | 2 | 180 |
| HR3418 | 3.12.08 | 2 | 180 |
| HR3905 | 3.12.08 | 2 | 180 |
| elem. | |||||
|---|---|---|---|---|---|
| He | -0.05 | 0.05 | |||
| C | -2.65 | 0.10 | -2.82 | 0.25 | |
| N | -2.00 | 0.20 | |||
| O | -1.90 | 0.30 | -1.38 | 0.10 | |
| Na | -2.10 | 0.15 | -2.03 | 0.31 | |
| Mg | -2.30 | 0.15 | -1.82 | 0.36 | -2.02 |
| Si | -1.69 | 0.12 | |||
| K | -1.54 | 0.28 | |||
| Ca | -2.15 | 0.10 | -1.97 | 0.07 | -2.21 |
| Sc | -1.95 | 0.14 | |||
| Ti | -2.05 | 0.20 | -1.82 | 0.16 | -2.10 |
| V | -2.09 | 0.09 | |||
| Cr | -2.15 | 0.15 | -2.35 | 0.09 | |
| Mn | -2.15 | 0.15 | -2.40 | 0.07 | |
| Fe | -2.25 | 0.10 | -2.12 | 0.07 | -2.32 |
| Co | -2.25 | 0.15 | -2.03 | 0.08 | |
| Ni | -2.17 | 0.03 | |||
| Cu | -2.13 | 0.01 | |||
| Sr | -2.35 | 0.13 | |||
| Y | -2.48 | 0.09 | -2.29 | ||
| Ba | -2.10 | 0.20 | -2.23 | 0.14 | -2.47 |
| La | -2.25 | 0.20 | -2.07 | 0.30 | |
| Nd | -2.12 | 0.23 | |||
| Eu | -1.82 | 0.15 |