GRBs have preferred jet opening angles and bulk Lorentz factors
Abstract:
We recently found that Gamma–Ray Burst energies and luminosities, in their comoving frame, are remarkably similar. This, coupled with the clustering of energetics once corrected for the collimation factor, suggests the possibility that all bursts, in their comoving frame, have the same peak energy (of the order of a few keV) and the same energetics of the prompt emission (of the order of erg). The large diversity of bursts energies is then due to the different bulk Lorentz factor and jet aperture angle . We investigated, through a population synthesis code, what are the distributions of and compatible with the observations. Both quantities must have preferred values, with log–normal best fitting distributions and and . Moreover, the peak values of the and distributions must be related – =const: the narrower the jet angle, the larger the bulk Lorentz factor. We predict that 6% of the bursts that point to us should not show any jet break in their afterglow light curve since they have . Finally, we estimate that the local rate of GRBs is 0.3% of all local SNIb/c and 2.5% of local hypernovae, i.e. SNIb/c with broad absorption lines.
May 07-11, 2012
Munich, Germany
1 Introduction
The spectral energy correlations in GRBs are still matter of hot debate. The isotropic equivalent energy of the prompt phase of long GRBs correlates with the rest frame peak of the spectrum [1], [2]: . A similar correlation (obeyed also by short events – [11]) exists between the isotropic equivalent luminosity and [24]: .
If GRBs emit their radiation within a jet of opening angle , the true energy can be estimated [7]. For 30 GRBs with known , is tightly correlated with [8], [9].
The presence of outliers of the correlation [3], [20], [23] [5] and the presence of possible instrumental biases [4], [19], caution about the use of these correlations either for deepening into the physics of GRBs or for cosmological purposes. However, even if instrumental selection effects are present, it seems that they cannot produce the correlations we see [10] [21], [15]. Moreover, a correlation between and is present within individual GRBs as a function of time [6], [12], [13] [14].
A new piece of information recently added to the puzzle is that the energetics in the comoving frame (i.e. , and ) are similar for all GRBs [15]. For about 30 GRBs we [15] found that () and ; in the comoving frame 3.5 erg, 5 erg s-1 and 6 keV (see [17] for a theoretical interpretation). These results suggest that the and correlations are a sequence of different factors.
The comoving true energy turns out to be erg. In [15] we argued that to have consistency between the and the correlations we need = constant. The distribution of is centered around =65 (130) in the case of a wind (uniform) density distribution of the circum–burst medium.
These new findings prompted us to explore the possibility that the and the correlations result from all bursts having the same comoving and but different and . Specifically, we [16] ask whether and/or have preferential values or not, and if there is a relation between them. To this aim we have performed extensive numerical simulations, along the guidelines explained below.
2 Simulation set up
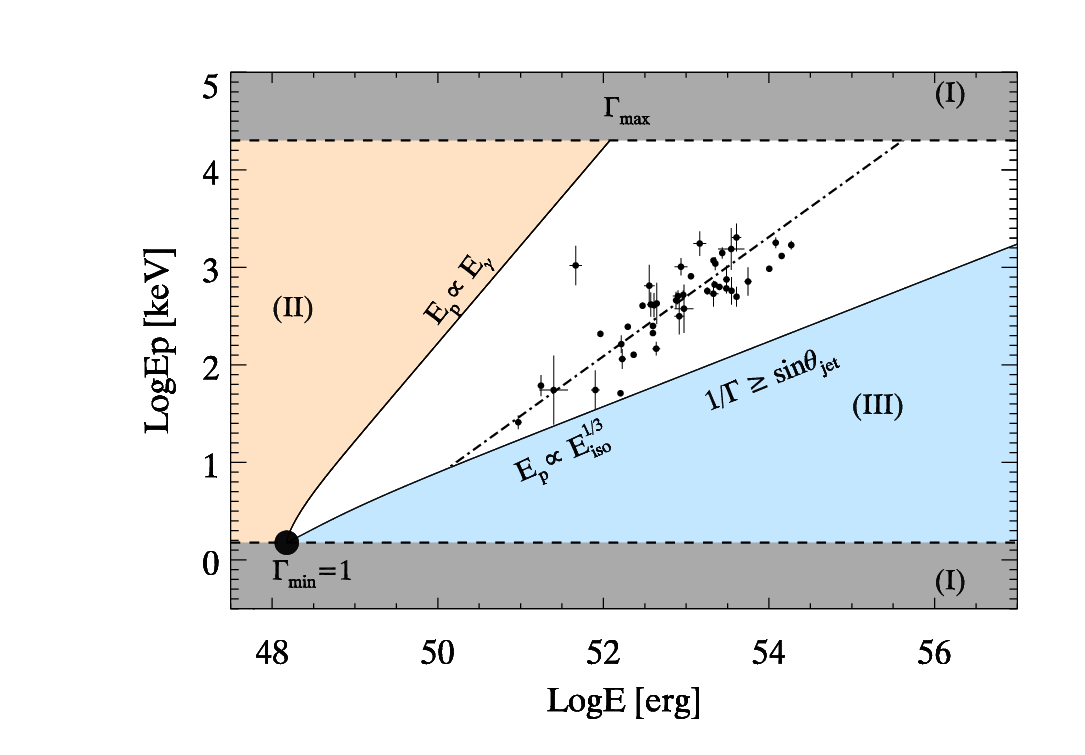
Fig. 1 shows the plane. The black points are GRBs belonging to the complete Swift sample of [22]. The large black dot corresponds to our main assumptions, i.e. all bursts, in the comoving frame, emit erg at 1.5 keV independent of their . is smaller (2) than the mean value derived in [15], in order to be able to reproduce GRBs lying quite close to the line. GRBs with different would lie on the line, giving rise to the relation. Then, by assuming a given aperture angle we can calculate . The GRB will move to the right by the quantity if 1/, and by the quantity otherwise. In the latter case, the relation between and becomes . This implies that region (III) of Fig. 1 is forbidden. The other forbidden regions are region (II) because this would correspond to , and region (I) because we assume 18000. All our simulated bursts will then lie on the white part of the plane. The distribution of the simulated bursts in this plane depends on the chosen distributions of and . We thus have a tool to find what are the best fitting distributions.
The steps are: i) select a redshift from the assumed redshift distribution (that is taken from [22], which includes an evolutionary term); ii) select a and calculate and ; iii) select a and calculate ; iv) chose a viewing angle and decide if it is pointing at us or not; v) calculate the peak flux in the appropriate band (assuming a typical Band spectrum) and decide if the burst belongs to the complete Swift sample [22] or not. Bursts in this sample have a peak flux larger than 2.6 ph cm-2 s-1, and almost 90% of them have a measured redshift. The steps are repeated until the number of simulated Swift bursts matches the real ones. Finally, we repeat 1,000 times each simulation to see how many times we can get a reasonable agreement with several observational constraints. First, we compare the simulated points of the complete Swift sample with the real ones in the plane. Then we compare them also in the observed planes –Fluence and –Peak Flux (irrespective if the redshift is known or not). Finally, we compare the distribution of simulated vs real flux and fluences of the BATSE and GBM bursts (down to limiting values that are not affected by incompleteness).
| Distrib. | sample | Mode | Mean | Median | ||
|---|---|---|---|---|---|---|
| ALL | 0.9160.001 | 1.7420.002 | 2.5∘ | 8.7∘ | 5.7∘ | |
| PO | 0.8740.010 | 3.3080.013 | 12.7∘ | 40.0∘ | 27.3∘ | |
| PO Swift | 0.5270.032 | 1.4100.043 | 3.1∘ | 4.7∘ | 4.1∘ | |
| ALL | 1.4750.002 | 4.5250.002 | 11 | 274 | 92 | |
| PO | 1.4520.020 | 2.8370.025 | 2 | 49 | 17 | |
| PO Swift | 0.9750.060 | 5.3980.083 | 85 | 355 | 221 |
2.1 Results
We performed several simulations considering first that both and have no preferred values, i.e. assuming that they are distributed as power–laws, changing the corresponding slopes. None of these cases is in agreement with the data. Then we assumed a broken power law either for or for , or for both. For the latter case we do find some agreement, but the distribution of the simulated points in the plane describes a linear correlation, instead of the observed . We then tried log–normal distributions both for and . In addition we assumed that there is a relation between the average values of the two distributions. The best results are obtained with =constant (Fig. 2). Note that the slope of the correlation of bright bursts is harder than for faint ones (see the blue points in Fig. 2). But, curiously, these bright GRBs sample the distribution of the whole ensemble of bursts (yellow points) better than the fainter ones. This is because, if we improve our detector sensitivity, we preferentially see GRBs with larger opening angles. This makes them less energetic and enhances their probability to point at us. Fig. 3 shows (left panel) the distribution of of all simulated bursts (black), those pointing at us (blue) and those (red) that are pointing at us and have a peak flux larger than 2.6 ph cm-2 s-1 (i.e. the flux limit of the complete Swift sample). The green points correspond to the few GRBs of measured (left) or (right). Tab. 1 reports the parameters of the best fitting log–normal distributions values of and for all bursts (ALL), for those pointing at us (PO) and for those pointing at us with peak flux larger than 2.6 ph cm-2 s-1 (the flux limit of the complete Swift sample) (PO Swift).
3 Conclusions
The crucial assumption of this study is that all bursts have the same =1.5 keV and erg. Although there could be a dispersion of these values, our results still hold if the width of this dispersion is not larger than the dispersion of the observed quantities. The fact that these values are independent of suggests that the dissipation mechanism giving rise to the prompt emission is not the transformation of bulk kinetic into random energy. If our assumption is true, then the relation is produced by the distribution of values, and must be linear (both and are proportional to ). In turn, the relation results from a distribution of jet aperture angles, with the caveat that, for small values of , the radiation collimation angle is 1, not . These bursts will never have a jet–break in the light curve of their afterglow, and could be mistaken as outliers. In our simulations we find that these should be about 6% of the GRBs pointing at us. Another important outcome of our study is that we can calculate the fraction of all GRBs (whether aligned or misaligned) with respect to SN Ibc, as a function of redshift. Taking the recent estimates of the SN Ibc of [18], we find that, locally (i.e. up to 1), GRBs are 0.3% of all SN Ibc.


References
- [1] L. Amati, F. Frontera, M. Tavani et al., Intrinsic spectra and energetics of BeppoSAX Gamma–Ray Bursts with known redshifts, A&A 390 (2002) 81
- [2] L. Amati, F. Frontera & C. Guidorzi, Extremely energetic Fermi gamma–ray bursts obey spectral energy correlations, A&A 508 173
- [3] D.L. Band & R. Preece, Testing the Gamma–Ray Burst Energy Relationships, ApJ 627 (2005) 319
- [4] N.R. Butler, D. Kocevski & J.S. Bloom, Generalized Tests for Selection Effects in Gamma–Ray Burst High–Energy Correlations, ApJ 694 (2009) 76
- [5] A.C. Collazzi, B.E. Schaefer, A. Goldstein & R.D. Preece, A Significant Problem with Using the Amati Relation for Cosmological Purposes, ApJ 747 (2012) 39
- [6] C. Firmani, J.I. Cabrera, V. Avila-Reese et al., Time–resolved spectral correlations of long–duration –ray bursts, MNRAS 393 (2009) 1209
- [7] D.A. Frail, S.R. Kulkarni & R. Sari, Beaming in Gamma-Ray Bursts: Evidence for a Standard Energy Reservoir, ApJ 562 (2001) L55
- [8] G. Ghirlanda, G. Ghisellini & D. Lazzati, The Collimation-corrected Gamma–Ray Burst Energies Correlate with the Peak Energy of Their Spectrum, ApJ 616 (2004) 331
- [9] G. Ghirlanda, L. Nava L., G. Ghisellini & C. Firmani, Confirming the –ray burst spectral–energy correlations in the era of multiple time breaks, A&A 466 (2007) 127
- [10] G. Ghirlanda, L. Nava L., G. Ghisellini, C. Firmani & J.I. Cabrera, The – plane of long gamma-ray bursts and selection effects, MNRAS 387 (2008) 319
- [11] G. Ghirlanda, L. Nava L., G. Ghisellini, A. Celotti & C. Firmani, Short versus long gamma–ray bursts: spectra, energetics, and luminosities, A&A 496 (2009) 585
- [12] G. Ghirlanda, L. Nava L. & G. Ghisellini, Spectral–luminosity relation within individual Fermi gamma rays bursts, 2010, A&A, 511, 43
- [13] G. Ghirlanda, G. Ghisellini & L. Nava, Short and long gamma-ray bursts: same emission mechanism?, MNRAS 418 (2011a) L109
- [14] G. Ghirlanda, G. Ghisellini & L. Nava, Spectral evolution of Fermi/GBM short gamma–ray bursts, MNRAS 410 (2011b) L97
- [15] G. Ghirlanda, L., Nava, L., G. Ghisellini et al., Gamma–ray bursts in the comoving frame, MNRAS 420 (2012a) 483
- [16] G. Ghirlanda, G. Ghisellini G., R. Salvaterra et al., The faster the narrower: characteristic bulk velocities and jet opening angles of Gamma Ray Bursts, subm to MNRAS (2012b)
- [17] D. Giannios, The peak energy of dissipative gamma–ray burst photospheres, MNRAS 422 (2012) 3092
- [18] V. Grieco, F. Matteucci F., Meynet G. et al., Metallicity effects on the cosmic SNIb/c and GRB rates, MNRAS in press (2012) arXiv:1204.2417
- [19] D. Kocevski, On the Origin of High–energy Correlations in Gamma–Ray Bursts, ApJ 747 (2012) 146
- [20] E. Nakar & T. Piran, Outliers to the peak energy–isotropic energy relation in gamma–ray bursts, MNRAS 360 (2005) L73
- [21] L. Nava, G. Ghirlanda G., Ghisellini & C. Firmani, Peak energy of the prompt emission of long gamma–ray bursts versus their fluence and peak flux, MNRAS 391 (2008) 639
- [22] R. Salvaterra, S. Campana, S.D. Vergani, et al., A Complete Sample of Bright Swift Long Gamma–Ray Bursts. I. Sample Presentation, Luminosity Function and Evolution, ApJ 749 (2012) 68
- [23] A. Shahmoradi & R.J. Nemiroff, The possible impact of gamma-ray burst detector thresholds on cosmological standard candles, MNRAS 411 (2011) 1843
- [24] D. Yonetoku, T. Murakami, T. Nakamura, et al., Gamma–Ray Burst Formation Rate Inferred from the Spectral Peak Energy–Peak Luminosity Relation, ApJ 609 (2004) 935