Swift observations of the ultraluminous X-ray source XMMU J004243.6+412519 in M31
Abstract
We report on a multi-wavelength study of the recently discovered X-ray transient XMMU J004243.6+412519 in M31, based on data collected with Swift and the 1.8-m Copernico Telescope at Cima Ekar in Asiago (Italy) between 2012 February and August. Undetected in all previous observations, in 2012 January XMMU J004243.6+412519 suddenly turned on, showing powerful X-ray emission with a luminosity of erg s-1 (assuming a distance of 780 kpc). In the following weeks, it reached a luminosity higher than erg s-1, in the typical range of ultraluminous X-ray sources (ULXs). For at least 40 days the source luminosity remained fairly constant, then it faded below erg s-1 in the following 200 days. The source spectrum, which can be well described by multi-color disk blackbody model, progressively softened during the decay (the temperature changed from keV to 0.4 keV). No emission from XMMU J004243.6+412519 was detected down to 22 mag in the optical band and to 23–24 mag in the near ultraviolet. We compare the properties of XMMU J004243.6+412519 with those of other known ULXs and Galactic black hole transients, finding more similarities with the latter.
Keywords:
accretion, accretion discs – galaxies: individual: M31 – X-rays: binaries – X-rays: galaxies – X-rays: individual: XMMU J004243.6+4125191 Introduction
Ultra luminous X-ray sources (ULXs; Long & van Speybroeck 1983; Helfand 1984; Fabbiano 1989) are observed in nearby galaxies as point-like, off-nuclear X-ray sources with isotropic luminosity larger than the Eddington limit for spherical accretion of fully ionised hydrogen onto a 10- compact object ( erg s-1). The nature of these objects remains a major astrophysical puzzle. Some ULXs have been identified with X-ray bright supernovae, other with background active galactic nuclei, but most of them are suspected to be accreting black holes (BHs) of stellar origin (see Feng & Soria 2011 for a recent review). However, their luminosities are typically too high to be explained by accretion processes on stellar-mass black holes without violating standard Eddington limit arguments. Three main different possibilities have been proposed to explain the nature of ULXs. (1) They are intermediate-mass BHs (with mass in excess of 100 ) in accretion (Colbert & Mushotzky, 1999); a strong case for the existence of such objects is HLX-1 in ESO 243-49, for which the luminosity exceeds erg s-1 (Farrell et al., 2009; Davis et al., 2011). (2) They are accreting stellar-mass BHs (5–20 ) with substantial beaming of their X-ray emission (King et al., 2001) or emitting above their Eddington limit (Begelman, 2002; Begelman, King & Pringle, 2006). (3) They are massive BHs (30–80 ) formed in low-metallicity environments from massive progenitors and accreting at or slightly above their Eddington limit (Mapelli, Colpi & Zampieri 2009; Zampieri & Roberts 2009; Belczynski et al. 2010). Other possibilities are that the anomalously high luminosity of these objects is due to a combination of these factors, or that the population of ULXs is composed by different kind of sources.
Observations of ULXs’ counterparts in energy bands other than X-ray have proven difficult because of their extragalactic nature. In X-rays, ULXs have been extensively observed during the last decade with high-spectral-resolution satellites such as Chandra and XMM-Newton. High-quality spectra taken with such satellites have shown that many bright persistent sources emit a spectrum commonly well fit by a Comptonization model plus a disc (Stobbart, Roberts & Wilms 2006; Roberts 2007; Gladstone, Roberts & Done 2009). These spectral properties appear consistent with super-Eddington or marginally super-Eddington accretion onto a stellar-mass or a more massive BH (e.g. Gladstone, Roberts & Done 2009; Pintore & Zampieri 2012). Quasi-periodic oscillations (QPOs) similar to the ones observed in the emission of Galactic BH binaries (see e.g. Casella, Belloni & Stella 2005) have been detected in X-rays in a few ULXs (Mucciarelli et al. 2006; Strohmayer et al. 2007; Strohmayer & Mushotzky 2003; Strohmayer & Mushotzky 2009; Feng, Rao & Kaaret 2010). Some efforts have been made to make use of scaling arguments valid for Galactic BH binaries (see e.g. Shaposhnikov & Titarchuk 2009) in order to constrain the masses of ULXs from characteristic time-scales. Results are, however, highly uncertain, as all these estimates are based upon tentative identifications of the timing features and the use of scaling laws that are known to hold only for a limited number of objects (e.g. Middleton, Sutton & Roberts 2011).
Despite the substantial body of work that has been done in the last decade, transient ULXs in particular still represent a poorly know population. Only few ULXs with transient behaviour have been detected so far and only a handful of them have been studied in detail. Examples of well-studied genuine ULX transients are CXOM31 J004253.1+411422 in M31 (hereafter M31 ULX-1), CXOU 133705.1–295207 in M83 and CXOU J132518.2–430304 in NGC5128 (Kaur et al., 2012; Soria et al., 2012; Sivakoff et al., 2008). In 2012 January a new X-ray source with a luminosity of erg s-1 was discovered by XMM-Newton in M31 (XMMU J004243.6+412519; Henze, Pietsch & Haberl 2012b). Seven days after its discovery, it reached a luminosity of erg s-1, which made it the second most luminous ULX in M31 (Henze, Pietsch & Haberl, 2012c). During the outburst the source was repeatedly observed by Swift and other instruments. Here we present the analysis of the several Swift XRT and UVOT observations performed between 2012 March and August with the aim to explore the nature of this source. We also present the results of deep optical observations taken on 2012 July 18 with the 1.8-m Copernico Telescope at Cima Ekar (Asiago, Italy) and the analysis of serendipitous observations of the source region collected in recent years by Swift and Chandra.
In Section 2 we describe the Swift observations used in our study and we present the results of the spectral and timing analysis of the X-ray data in Section 3. In Section 4 we report on the Swift/UVOT and Copernico optical and ultraviolet observations of the source. In Section 5 we present the upper limits on the pre-outburst X-ray flux of XMMU J004243.6+412519 obtained from our inspection of Chandra and Swift archival observations. Discussion follows in Section 6.
2 Swift observations and data reduction
The Swift payload includes a wide-field instrument, the coded-mask gamma-ray Burst Alert Telescope (Barthelmy et al., 2005, BAT;), and two narrow-field instruments, the X-Ray Telescope (Burrows et al., 2005, XRT;) and the Ultra-Violet/Optical Telescope (Roming et al., 2005, UVOT;). In this work we made use of only the narrow-field instruments data.
The XRT uses a front-illuminated CCD detector sensitive to photons between 0.2 and 10 keV. Two main readout modes are available: photon counting (PC) and windowed timing (WT). PC mode provides two dimensional imaging information and a 2.507-s time resolution; in WT mode only one-dimensional imaging is preserved, achieving a time resolution of 1.766 ms. The UVOT is a 30-cm modified Ritchey-Chrétien reflector using a microchannel-intensified CCD detector which operates in photon counting mode. A filter wheel accommodates a set of optical and ultraviolet (UV) filters and the wavelength range is 1700--6000 Å. The data were processed and filtered with standard procedures and quality cuts11 1 See http://swift.gsfc.nasa.gov/docs/swift/analysis/ for more details. using ftools tasks in the heasoft software package (v. 6.12) and the calibration files in the 2012-02-06 caldb release.
Following the discovery of XMMU J004243.6+412519 (2012 January; Henze, Pietsch & Haberl 2012b), the source was observed by Swift ten times in about three weeks, until it came out of visibility in 2012 March. At the end of 2012 May, XMMU J004243.6+412519 became visible again for Swift and the monitoring was resumed with many further pointings, mostly off-axis (see also Henze et al. 2012). Around mid 2012 August, the source flux became too low for the typical sensitivity of a 2-ks XRT snapshot. For this reason, after the visibility gap we consider only the sixteen observations taken up to 2012 September 01. A summary of the observations used in this work is given in Table 1.
| Observation | XRT | UVOT | Start / end time (UT) | Exposure | |
|---|---|---|---|---|---|
| mode | filtera | (YYYY-MM-DD hh-mm-ss) | (ks) | ||
| 00032286002 | PC | 2012-02-19 00:47:34 | 2012-02-19 23:23:57 | 3.9 | |
| 00032286003 | PC | 2012-02-23 18:49:39 | 2012-02-23 22:13:56 | 3.3 | |
| 00032286004 | WT | – | 2012-02-24 13:54:21 | 2012-02-24 15:35:02 | 0.5 |
| 00032286005 | WT | 2012-02-28 04:50:00 | 2012-02-28 08:17:00 | 3.0 | |
| 00032286009 | WT | 2012-03-02 03:02:59 | 2012-03-02 03:45:40 | 2.5 | |
| 00032286006 | PC | 2012-03-02 04:54:08 | 2012-03-02 14:58:57 | 6.3 | |
| 00032286007 | PC | 2012-03-03 00:09:07 | 2012-03-03 16:37:58 | 7.1 | |
| 00032286008 | WT | 2012-03-03 01:41:44 | 2012-03-03 06:57:00 | 2.7 | |
| 00032286010 | PC | 2012-03-04 04:52:27 | 2012-03-04 21:21:57 | 4.3 | |
| 00032286011 | WT | 2012-03-07 10:00:31 | 2012-03-07 12:01:00 | 3.1 | |
| 00035336052 | PC | 2012-05-24 14:55:42 | 2012-05-24 21:36:56 | 4.3 | |
| 00032286012 | WT | 2012-05-28 11:55:26 | 2012-05-28 15:37:59 | 4.1 | |
| 00035336053 | PC | – | 2012-06-01 18:28:39 | 2012-06-01 23:43:57 | 4.0 |
| 00035336054 | PC | 2012-06-09 06:20:09 | 2012-06-09 11:22:57 | 2.0 | |
| 00035336055 | PC | – | 2012-06-17 03:17:31 | 2012-06-17 08:14:56 | 2.1 |
| 00035336056 | PC | 2012-06-25 00:42:19 | 2012-06-25 18:40:57 | 1.9 | |
| 00035336058 | PC | 2012-07-09 16:01:04 | 2012-07-09 19:30:55 | 1.1 | |
| 00035336059 | PC | – | 2012-07-11 06:36:01 | 2012-07-11 06:37:49 | 0.1 |
| 00035336060 | PC | 2012-07-15 11:37:32 | 2012-07-15 11:55:55 | 1.1 | |
| 00035336061 | PC | 2012-07-19 02:11:18 | 2012-07-19 15:23:56 | 2.1 | |
| 00035336062 | PC | 2012-07-27 18:33:47 | 2012-07-27 20:25:54 | 2.3 | |
| 00035336063 | PC | – | 2012-08-05 03:03:49 | 2012-08-05 11:19:53 | 2.0 |
| 00035336064 | PC | – | 2012-08-12 11:32:21 | 2012-08-12 21:20:56 | 0.9 |
| 00035336065 | PC | 2012-08-20 21:29:05 | 2012-08-20 23:24:55 | 2.1 | |
| 00035336066 | PC | 2012-08-28 13:49:33 | 2012-08-28 14:05:53 | 1.0 | |
| 00035336067 | PC | 2012-09-01 13:58:43 | 2012-09-01 14:24:55 | 1.6 | |
- a
: central wavelength 3465 Å, FWHM 785 Å; : central wavelength 2600 Å, FWHM 693 Å; : central wavelength 2246 Å, FWHM 498 Å; : central wavelength 1928 Å, FWHM 657 Å.
3 X-ray data analysis
We extracted the PC source events from a circle with a radius of 20 pixels (1 XRT pixel corresponds to about ) and the WT data from a pixels box along the image strip. To estimate the background, we extracted PC and WT events from regions far from the position of XMMU J004243.6+412519. The ancillary response files (arf) were generated with xrtmkarf, and they account for different extraction regions, vignetting and point spread function corrections. We used the latest available spectral redistribution matrix (rmf) in caldb. The spectral channels were grouped so as to have bins with a minimum number of 20 photons. The spectral analysis was performed with the xspec 12.7 fitting package; (Arnaud, 1996); the abundances used are those of Anders & Grevesse (1989) and photoelectric absorption cross-sections are from Balucinska-Church & McCammon (1992).
Initially we focus our analysis on the 2012 February–March data (see Table 1). For a preliminary look at the data, we fit all spectra simultaneously (in the 0.5–10 keV energy range) with the hydrogen column density tied between all observations using a simple power law (e.g. Henze, Pietsch & Haberl 2012c). While this simultaneous modelling yields a rather high reduced of 1.37 for 553 degrees of freedom (dof), the test shows that, as can be seen in Fig. 1, the spectra of XMMU J004243.6+412519 are all very similar in this set of XRT observations (see also Henze, Pietsch & Haberl 2012a).

Thus, in order to achieve better statistics and higher signal-to-noise ratio, we merged the data from all the observations and accumulated combined PC and WT spectra. In the following, we concentrate on the PC total spectrum (24.9 ks, about 7900 counts, 99.4% of which are attributable to XMMU J004243.6+412519), because of the intrinsically higher signal-to-noise ratio of the PC data with respect to the WT ones. The combined spectrum was fit adopting several phenomenological models frequently used in literature for ULXs (e.g. Roberts 2007; Feng & Soria 2011): a diskbb, a powerlaw, a diskbb+powerlaw, and a diskbb+comptt, all corrected for interstellar absorption. All these models but the power law provide statistically good fits. However, the improvement given by the combination of two models is not significant in comparison with a single diskbb model ( for 231 dof against, for instance, for 229 dof for the diskbb+powerlaw). We also tried to fit more sophisticated Comptonization models (comptt and simpl in xspec) to the data, but the count statistics of the spectrum is not sufficient to provide good-enough constraints on the model parameters. Hence, it seems appropriate to describe the pre-gap PC spectrum of XMMU J004243.6+412519 in terms of a simple diskbb model. The best fitting parameters show that the disc is relatively hot ( keV) and the luminosity is quite high ( erg s-1 for a distance of 780 kpc; Holland 1998; Stanek & Garnavich 1998). The results are summarised in Table 2.
| Modela | / Norm.b | Observed fluxc | Luminosityc | (dof) | ||||
|---|---|---|---|---|---|---|---|---|
| ( cm-2) | (keV) | (keV) | ( erg cm-2 s-1) | ( erg s-1) | ||||
| phabs*powerlaw | – | – | – | 1.46 (231) | ||||
| phabs*diskbb | – | – | 1.07 (231) | |||||
| phabs*cutoffpl | – | – | 1.03 (230) | |||||
| phabs*bknpower | – | 1.00 (229) | ||||||
| phabs*(powerlaw+diskbb) | – | 1.03 (229) | ||||||
| phabs*(cutoffpl+diskbb) | 1.00 (228) |
- a
xspec model.
- b
diskbb normalisation: , corresponding to a face-on disk.
- c
In the 0.5–10 keV energy range; for the luminosity we assumed a distance to M31 of 780 kpc (Holland, 1998; Stanek & Garnavich, 1998).
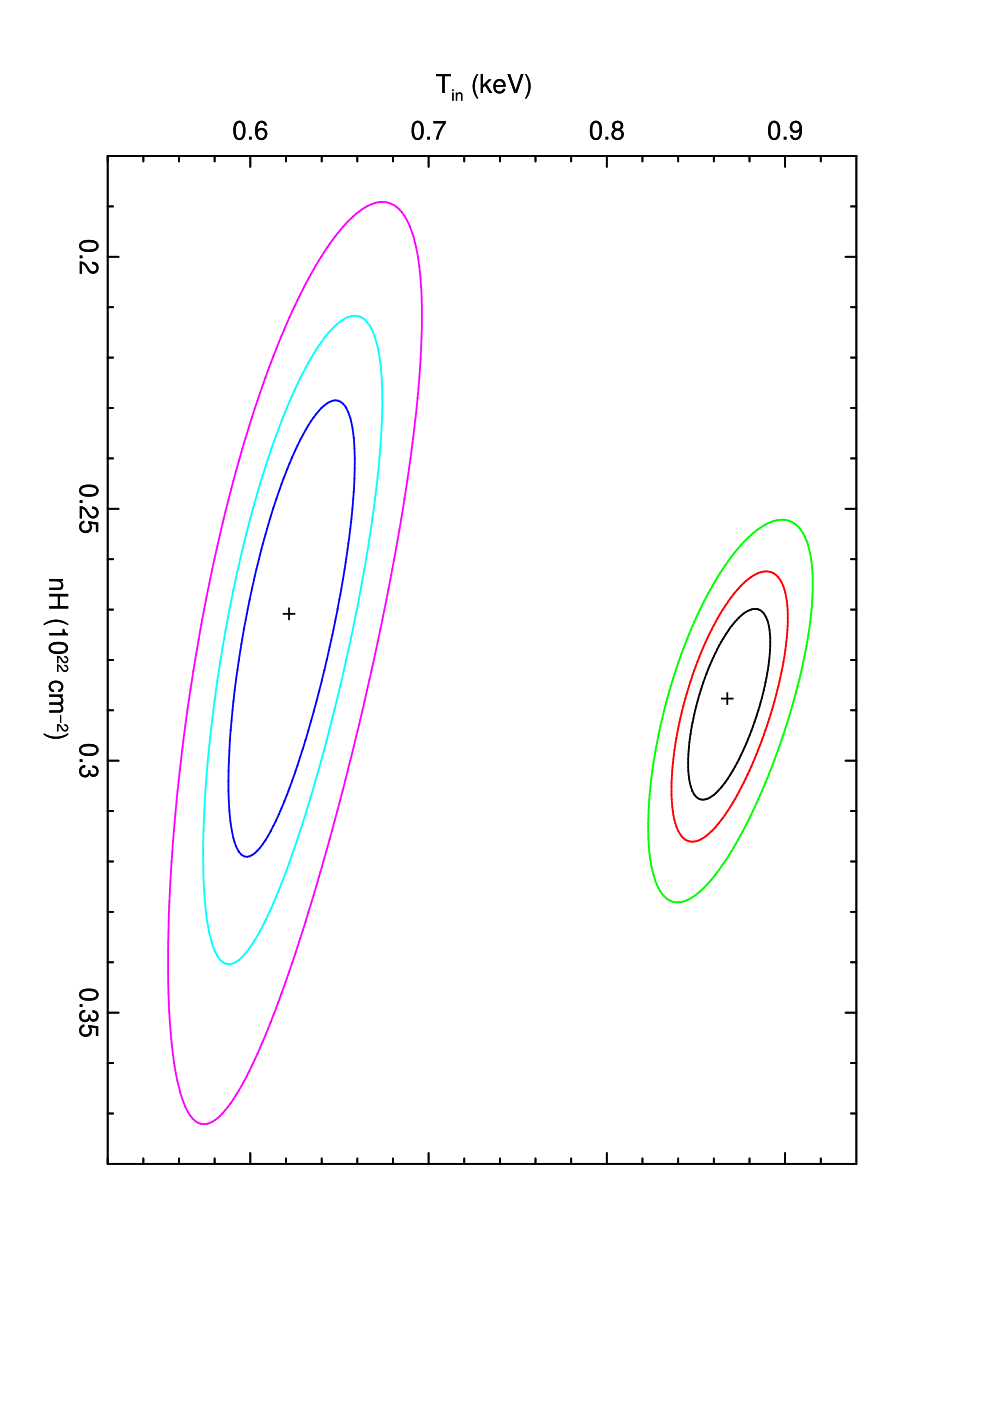
Similarly, for the second batch of data (collected starting from 2012 May; see Table 1) we extracted a cumulative PC spectrum (23.7 ks, about 1600 counts, 99.2% of which are attributable to XMMU J004243.6+412519). We tested the same single-component22 2 Owing to the lower count statistics, this time we did not consider more complicated (two-component) models. spectral models reported in Table 2, obtaining the parameters shown in Table 3. In general, they appear to have values of the column density consistent with those of the pre-gap state and significantly lower fluxes/luminosities. In particular the post-gap average spectrum is well described by a diskbb component with an (average) temperature (0.6 keV) smaller than that of the pre-gap combined spectrum. In Fig. 2 we show the phabs*diskbb model fit to the pre- and post-visibility gap combined PC spectra. The softening suggested by the spectral parameters and Fig. 2 is apparent from the contour plots shown in Fig. 3.
| Modela | / Norm.b | Observed fluxc | Luminosityc | (dof) | ||||
|---|---|---|---|---|---|---|---|---|
| ( cm-2) | (keV) | (keV) | ( erg cm-2 s-1) | ( erg s-1) | ||||
| phabs*powerlaw | – | – | – | 1.45 (66) | ||||
| phabs*diskbb | – | – | 0.98 (66) | |||||
| phabs*cutoffpl | – | – | 0.98 (65) | |||||
| phabs*bknpower | – | 0.99 (64) |
- a
xspec model.
- b
diskbb normalisation: , corresponding to a face-on disk.
- c
In the 0.5–10 keV energy range; for the luminosity we assumed a distance to M31 of 780 kpc (Holland, 1998; Stanek & Garnavich, 1998).

In order to study the source flux evolution over time, we fit all the PC spectra from the individual observations or from small groups of observations. When the source flux dropped below erg cm-2 s-1, around mid 2012 July, in order to accumulate sufficient statistics for meaningful spectral fits, we combined data from a few contiguous observations; namely, we obtained a spectrum from observations 00035336058–61 and another one from observations 00035336062–64. We fit all the spectra simultaneously adopting the phabs*diskbb model with the hydrogen column density (which is consistent with a single value in both the pre- and post-gap cumulative spectra) tied between observations ( for 676 dof). We plot the resulting long-term light curve and the inferred temperatures in Fig. 4. We show both the absorbed and unabsorbed fluxes. As can be seen from Fig. 4 the effect of the interstellar absorption is larger on the softer spectra from the post-gap observations. Progressive spectral softening and flux decay are evident during the post-gap observations. The flux decreased by a factor of 5 over 70 days (by a factor of 10 over 150 days with respect to the pre-gap flux), while the disk temperature changed from keV to 0.4 keV.
Although, owing to the long visibility gap, the available data do not allow us to perform an accurate modelling of the decay shape, we tried a number of simple models to fit the light curve of XMMU J004243.6+412519. We fixed at the time the source was observed for the first time to exceed the ULX threshold (MJD 55947.51; Henze, Pietsch & Haberl 2012c). An exponential function of the form gives a rather poor fit ( for 10 dof). The best-fitting parameters for the observed (absorbed) flux are erg cm-2 s-1 and -folding time d.
Among the other models tested, a broken-power-law model provides the better fits for the evolution of both the absorbed ( for 8 dof) and unabsorbed fluxes ( for 8 dof). Assuming as MJD 55947.51, for the observed flux, the break occurs at () d, when the index changes from to ; the flux at the break time is erg cm-2 s-1. For the unabsorbed flux, the best-fitting parameters are: , and d for the break epoch (with an unabsorbed flux of erg cm-2 s-1). The steeper decay of the absorbed flux is due to the fact that the absorption affects the softer (later) spectra more. We stress that the fit parameters depend on the assumed time origin. The uncertainties introduced by making different (reasonable) assumptions can be larger than the statistical errors reported here. For instance, assuming at MJD 55942 (the day after the discovery of the source at a luminosity of erg s-1; Henze, Pietsch & Haberl 2012b), we find for the observed flux: , , d for the break epoch and flux at the break time of erg cm-2 s-1.
In the last observations (segments 00035336065, 00035336066 and 00035336067), XMMU J004243.6+412519 was not detected. The upper limits on the XRT count rate derived from the deeper observations (6065 and 6067) are of 0.1 counts s-1 (0.3–10 keV, following Kraft, Burrows & Nousek 1991). Assuming the spectrum of the closest observations (6062–6064, keV), this corresponds to upper limits on the observed flux of erg cm-2 s-1 and of erg s-1 on the luminosity (for 780 kpc).

For the timing analysis we concentrate on the data in WT mode (total exposure: 16.0 ks; see Table 1), since their time resolution of 1.7 ms (corresponding to a Nyquist frequency of 280 Hz) makes it possible to search for fast time variability. For each observation we computed a power density spectrum (PDS) in the energy band 0.3–10 keV by using intervals up to 925-s long and averaging the individual spectra for each observation. The PDS did not reveal any significant variability from XMMU J004243.6+412519: neither broad-band components nor narrow features were detected; no significant evolution of the PDS in time could be detected as well.
To improve the statistics, we produced a single PDS averaging all the WT data. The PDS was normalised according to Leahy et al. (1983), so that powers due to Poissonian counting noise have an average value of 2. Since PDS created from data taken in WT mode show a drop-off at high frequencies33 3 This effect is mostly visible above 50 Hz and is related to the read-out method of the XRT detector, see http://www.swift.ac.uk/analysis/xrt. and since also the averaged PDS from all the WT observations did not show any significant feature, we rebinned our data at a Nyquist frequency of 17 Hz (rebin factor of 16) using data stretches 925-s long to obtain a new average PDS. The PDS is well fit by a constant component equal to 2.286 0.006 (reasonably describing the Poissonian noise) with a best-fitting = 169.56 for 152 dof. Hence we conclude that no significant variability is detected from the source. It is not possible, however, to exclude that the emission from the source has a certain level of variability hidden by photon counting statistics or on time-scales not accessible to our data ( Hz).
Apart from the flux decay on the scale of weeks, the emission from XMMU J004243.6+412519 does not show signs of strong aperiodic variability either. There is only some evidence of moderate variability on the 1-ks-scale, with a rms variance of percent in the WT data. This is probably related to some level of variability of the local astrophysical background and could account for the fact that the Poissonian noise level observed in the PDS is slightly higher than the expected value (2 with the Leahy normalisation). For the pre-gap PC light curves (a similar analysis of the post-gap data is hampered by the low count rates) the 3 upper limits on the rms variability range from approximately 12 percent to 20 percent.
4 Optical and ultraviolet observations
The Swift/UVOT observed XMMU J004243.6+412519 simultaneously with the XRT. The data were taken with the , , and filters (see Table 1). The analysis was performed on the individual and stacked (for each filter) images with the uvotsource task, which calculates the magnitude through aperture photometry within a circular region (we used a 3-arcsec radius) and applies specific corrections due to the detector characteristics.
No source was detected at the position of XMMU J004243.6+412519 in any of the UVOT observations and filters, before or after the visibility gap. The 3 limits before the visibility gap are in the stacked images mag (total exposure: 13.4 ks), mag (total exposure: 5.6 ks) and (total exposure: 18.2 ks). After the gap, XMMU J004243.6+412519 was observed only with the filter; the 3 limit from the stacked image is (total exposure: 23.2 ks) All magnitudes are in the AB system (Oke & Gunn, 1983); see Poole et al. (2008) for more details on the UVOT photometric system and Breeveld et al. (2011) for the most updated zero-points and count rate to flux conversion factors.

The above magnitudes have not been corrected for extinction. At the position of XMMU J004243.6+412519, the total line-of-sight optical extinction estimated from background infrared emission is mag (Schlegel, Finkbeiner & Davis, 1998), while the X-ray fits, adopting the relation cm-2 by Predehl & Schmitt (1995), yield higher values in the range –5.0. Indicatively, mag corresponds to mag, mag , mag, and mag (Fitzpatrick & Massa, 2007).
The field of XMMU J004243.6+412519 was also observed with the 1.8-m Copernico Telescope at Cima Ekar in Asiago (Italy) on 2012 July 18. Three images of 20 minutes were taken in both the and band filters. The data were reduced following standard prescriptions. After removal of the detector signature (bias and flat field corrections), the images were astrometrically calibrated performing a polynomial interpolation starting from the positions of the NOMAD star catalogue (Zacharias et al., 2005). The accuracy is . The three calibrated frames in each filter were then averaged and the resulting band image is shown in Fig. 5.
Instrumental magnitudes were measured on the images through the point-spread function (PSF) fitting technique. The photometric calibration was performed using reference stars from the catalogue of M31 compiled by Magnier et al. (1992), homogeneously distributed around the source position. The internal accuracy of this calibration is 0.1 mag in both bands. No source at the position of XMMU J004243.6+412519 was detected in any of the two filters down to a limiting magnitude of 21.7 and 22.2 in the and band filters, respectively (see Fig. 5). In fact, the background emission from M31 is highly variable inside the error box, so that the actual limiting magnitude varies from 21.5 to 21.9 in and from 21.6 to 22.8 in , depending on the position.
5 Pre outburst observations
As noted by Henze, Pietsch & Haberl (2012b); Henze, Pietsch & Haberl (2012c), no source compatible with the position of XMMU J004243.6+412519 was listed in any X-ray catalogue. We have searched the XMM-Newton, Chandra, and Swift public archives for possible previous bright states of XMMU J004243.6+412519 in recent years, but the source was never detected. Since the XMM-Newton observations are rather sparse, in the following we summarise only the upper limits obtained from the much more intense coverage (from 1999 November to 2012 January) with Chandra and Swift.
5.1 Chandra
The distribution of the 93 Chandra observations (from 1999 November 30 to 2011 August 25) covering the field of XMMU J004243.6+412519 can be seen in Fig. 6; 54 observations were carried out with the HRC-I instrument (Murray et al., 2000), 39 with the ACIS (I or S; Garmire et al. 2003). Typical exposures are for the HRC-I 1–5 ks in the 1999–2011 observations and 20 ks in the more recent ones, and 5 ks for the ACIS pointings; the deepest upper limit (see Fig. 6) was obtained from a 38-ks ACIS-I observation carried out on 2001 October 05 (obs. ID: 1575; MJD 52187).
For each observation, an upper limit on the count rate from XMMU J004243.6+412519 was computed using the ciao tool aprates and taking into account the point-spread function fraction in the apertures within which the counts were extracted. In order to convert limits on the count rates from the different detectors into upper limits on the unabsorbed flux, we used the NASA/HEASARC pimms tool assuming a soft power-law spectrum with photon index and absorption cm-2. The corresponding upper limits on the luminosity (assuming a distance of 780 kpc) range from to erg s-1 and are shown in Fig. 6.


5.2 Swift
In the period between 2006 September 01 and 2012 January 01, Swift serendipitously imaged with the XRT (in PC mode) the position of XMMU J004243.6+412519 119 times for a total exposure of 370 ks. The spread of the observations can be seen in Fig. 7 while the exposure time for each year is given in Table 4.
We examined each observation, but the source was never detected, nor it was detected in the total and yearly total images. For each year and for the total data set, we computed 3 upper limits on the count rate (following Kraft, Burrows & Nousek 1991). These upper limits (Table 4) can be directly compared with the average (and fairly constant) PC rate observed in 2012 February–March, () counts s-1. In particular, the last Swift observation performed before the discovery of XMMU J004243.6+412519 (obs. ID: 00035336051; 2012 January 01) yields an upper limit of counts s-1, implying for the source a flux increase of 150 or more during 2012 January/February.
| Year | Observations | Total exposure | Count rate upper limita |
|---|---|---|---|
| (ks) | (counts s-1) | ||
| 2006 | 2 | 9.9 | 0.0010 |
| 2007 | 19 | 58.3 | 0.00038 |
| 2008 | 23 | 65.3 | 0.00023 |
| 2009 | 28 | 86.2 | 0.00028 |
| 2010 | 27 | 98.5 | 0.00031 |
| 2011 | 19 | 47.9 | 0.00066 |
| 2012 | 1 | 4.1 | 0.0025 |
| 2006–2012 | 119 | 369.5 | 0.00016 |
- a
At a confidence level of 3.
6 Discussion and Conclusions
XMMU J004243.6+412519 is a transient X-ray source in M31 that, at its maximum, reached luminosity in the ULX range. Undetected in all previous X-ray observations, in February 2012 it suddenly started to show powerful X-ray emission. After reaching the maximum, the source luminosity remained fairly constant at erg s-1 for at least 40 days, then it faded below erg s-1 in the following 200 days. The decay, accompanied by a spectral softening, can be described by a broken power-law with a break time of 100 days. No broad components nor narrow features (in the form of quasi-periodic oscillations) were detected in the power density spectra up to 280 Hz. We searched also for optical and near-UV emission from XMMU J004243.6+412519, but no no source was detected at its position down to a sensitivity limit of 22 in the and bands, and of 23–24 in the near UV.
In the following, we discuss the properties of XMMU J004243.6+412519 only in the context of an accreting black hole in M31. The large absorption column and the lack of an optical counterpart exclude a foreground object. In terms of a background object, the best candidates are an active galactic nucleus or a tidal disruption event. However, no active galactic nucleus has been observed to vary in X-rays by more than two orders of magnitude, while a tidal disruption event is ruled out by the flux evolution, that does not follow the characteristic decay of such events (Burrows et al., 2011).
Our spectral analysis of the Swift PC data showed that the energy spectrum of XMMU J004243.6+412519 can be fit using a disc component, and that the combination of a disk component and a power law that is commonly used to describe both the spectra of some ULXs and of Galactic BH binaries is not statistically needed (see also Barnard, Garcia & Murray 2012). However we cannot exclude the possibility that an additional component is not detected because of the low counting statistics. Along its outburst XMMU J004243.6+412519 showed only moderate and slow spectral changes in contrast with what is usually seen in transient BH binaries in outburst (see e.g. Motta, Belloni & Homan 2009).
The transient ULXs observed so far appear to have rather different properties and XMMU J004243.6+412519 is not an exception in this picture. The source presents similarities with other transients, but it cannot be definitely associated to any of them.
M31 ULX-1 was observed to reach a peak luminosity of erg s-1 (Kaur et al., 2012) followed by a decrement in flux with an -folding time-scale of 40 days (Middleton et al. 2012). A blue optical counterpart to M31 ULX-1 was detected during the outburst, but not in quiescence, pointing towards emission from an irradiated accretion disc. This suggests a low mass companion star transferring matter via Roche lobe overflow. The spectral properties of M31 ULX-1 are roughly described by a single disc component around a 10- BH with a spin of .44 4 The dimensionless spin parameter , where and are the angular momentum and mass of the black hole, respectively. On the other hand, contrarily to what we observed in XMMU J004243.6+412519, the best description of the spectra is obtained with the addition of a second component which represents an optically thick medium (namely a low temperature corona described by a comptt) close to the BH. It can be associated to the photosphere of a wind ejected by the inner regions of the disc, that is expected to set in at super-Eddington accretion rate. Indeed, the softer component of the spectrum can be also described by a slim disc model, indicating that advection may be important. The disc component becomes more important when the total luminosity decreases, suggesting that the wind unveils progressively the inner regions of disc when the accretion rate drops.
Also M83 ULX-1 (Soria et al., 2012) showed a long term evolution similar to XMMU J004243.6+412519 but, as in the case of M31 ULX-1, the energy spectrum is significantly different from XMMU J004243.6+412519. Undetected ( erg s-1) before 2011, M83 ULX-1 was discovered by Chandra and it was seen to reach a peak luminosity comparable to that of M31 ULX-1 ( erg s-1). Its spectral properties are modelled by a cold disc plus a power law without evidence of curvature at high energy, opposite to what is commonly seen in ULXs. In addition, the source does not show hints of a decline of the emission for at least 100 days after discovery and no spectral transitions were observed. Again contrarily to XMMU J004243.6+412519, a blue optical counterpart is observed, but only during the outburst, pointing to reprocessed emission from the outer accretion disc and the companion star, a red giant or AGB star with mass (Soria et al. 2012).
Finally, the ULX in NGC5128, discovered by Chandra in the 2009, was observed at a luminosity of – erg s-1. The outburst lasted for at least 70 days, but the source was no longer observed. It is an intriguing ULX because it experienced spectral state variations between a very high state, dominated by a power law with a photon index higher than 2.2, and a high/soft state, dominated by an accretion disc of 1 keV, consistent with the behaviour of the Galactic BH XRBs (Sivakoff et al. 2008).
One possible interpretation of the spectra-timing properties of XMMU J004243.6+412519 can be given by making an hypothesis on the nature of the source. If it is a stellar-mass BH transient, we can assume that most of the outburst evolution of the source could not be observed due to its distance from the observer. In this scenario, the source would be visible from Earth only during its brightest phases, which for many BH transients (e.g. H 1743–322, XTE J1650–754, GRO J1655–40) is encountered during the soft spectral states (Belloni, Motta & Muñoz-Darias, 2011). In the soft states the energy spectrum is strongly dominated by a soft disk component (that sometimes is the only component visible in the X-ray spectrum) while the fast time variability is usually consistent with zero. These properties are consistent with what we reported on XMMU J004243.6+412519. The duration of this high-luminosity phase in a Galactic BH transient is variable depending on the source and on the properties of the single outburst. However, the average length of such periods (few months) is absolutely consistent with the duration of the outburst of XMMU J004243.6+412519 (see e.g. the case of the Galactic BH transients XTE J1550–754, Kubota & Done 2004 and GRO J1655–40, Motta et al. 2012).
Assuming that at maximum luminosity XMMU J004243.6+412519 was in a disc-dominated state and that it was radiating at a significant fraction of (say 0.6), the mass of the BH would be 12 . For small inclinations (45), a similar value is obtained from the normalisation of the disc component obtained from the fit of the combined pre-gap PC spectrum, assuming that the inner disc radius is truncated at 6 gravitational radii and that the disc spectrum has a standard color correction factor (see eq. [2] in Zampieri & Roberts 2009; see also Lorenzin & Zampieri 2009 and references therein). This is consistent with the hypothesis that XMMU J004243.6+412519 could be indeed an accreting stellar-mass black-hole binary observed in its soft state.
The upper limits in optical bands are sufficiently deep to place interesting constraints on the donor mass. Assuming no extinction and a distance modulus of 24.47 mag for M31 (from the NASA/IPAC Extragalactic Database),55 5 See http://ned.ipac.caltech.edu/. the upper limit in the band translates into an upper limit on the absolute magnitude . Taking binary evolution effects and X-ray irradiation into account, a stellar-mass BH accreting through Roche lobe overflow is consistent with this upper limit if the donor is a main sequence star of 8–10 or a giant of 8 (Patruno & Zampieri, 2010). In fact, for a donor below 5 , the disc is no longer stable (Dubus et al., 1999; Patruno & Zampieri, 2008), in agreement with the transient nature of the source.
Acknowledgments
PE wishes to dedicate this paper to his mother for all intents and purposes, Maria Pastorcich; she died on March 24, 2012, but her spirit and smile live on in everyone who knew her. This research is based on observations with the NASA/UKSA/ASI mission Swift and with the Copernico Telescope at Cima Ekar, Asiago (Italy), operated by INAF–Astronomical Observatory of Padua. We also used data and software provided by the Chandra X-ray Center (CXC, operated for NASA by SAO) and the ESA’s XMM-Newton Science Archive (XSA). We thank Anna Wolter for useful comments on the manuscript, Fabio Pizzolato for helpful discussions, and the referee, Knox Long, for valuable comments. This work was partially supported by the Italian Space Agency through ASI–INAF contracts I/009/10/0 and I/004/11/0. FP and LZ acknowledge financial support from INAF through grant PRIN-2011-1.
References
- Anders & Grevesse (1989) Anders E., Grevesse N., 1989, Geochim. Cosmochim. Acta, 53, 197
- Arnaud (1996) Arnaud K. A., 1996, in Jacoby, G. H. and Barnes, J., eds., Astronomical Data Analysis Software and Systems V. Vol. 101 of ASP Conf. Ser., San Francisco CA, p. 17
- Balucinska-Church & McCammon (1992) Balucinska-Church M., McCammon D., 1992, ApJ, 400, 699
- Barnard et al. (2012) Barnard R., Garcia M. R., Murray S. S., 2012, Astron. Tel., 3937
- Barthelmy et al. (2005) Barthelmy S. D. et al., 2005, Space Science Reviews, 120, 143
- Begelman (2002) Begelman M. C., 2002, ApJ, 568, L97
- Begelman et al. (2006) Begelman M. C., King A. R., Pringle J. E., 2006, MNRAS, 370, 399
- Belczynski et al. (2010) Belczynski K., Bulik T., Fryer C. L., Ruiter A., Valsecchi F., Vink J. S., Hurley J. R., 2010, ApJ, 714, 1217
- Belloni et al. (2011) Belloni T. M., Motta S. E., Muñoz-Darias T., 2011, Bulletin of the Astronomical Society of India, 39, 409
- Breeveld et al. (2011) Breeveld A. A., Landsman W., Holland S. T., Roming P., Kuin N. P. M., Page M. J., 2011, in J. E. McEnery, J. L. Racusin, N. Gehrels ed., Gamma Ray Bursts 2010. Vol. 1358 of AIP Conf. Proc., Melville NY, p. 373
- Burrows et al. (2005) Burrows D. N. et al., 2005, Space Science Reviews, 120, 165
- Burrows et al. (2011) Burrows D. N. et al., 2011, Nature, 476, 421
- Casella et al. (2005) Casella P., Belloni T., Stella L., 2005, ApJ, 629, 403
- Colbert & Mushotzky (1999) Colbert E. J. M., Mushotzky R. F., 1999, ApJ, 519, 89
- Davis et al. (2011) Davis S. W., Narayan R., Zhu Y., Barret D., Farrell S. A., Godet O., Servillat M., Webb N. A., 2011, ApJ, 734, 111
- Dubus et al. (1999) Dubus G., Lasota J.-P., Hameury J.-M., Charles P., 1999, MNRAS, 303, 139
- Fabbiano (1989) Fabbiano G., 1989, ARA&A, 27, 87
- Farrell et al. (2009) Farrell S. A., Webb N. A., Barret D., Godet O., Rodrigues J. M., 2009, Nature, 460, 73
- Feng et al. (2010) Feng H., Rao F., Kaaret P., 2010, ApJ, 710, L137
- Feng & Soria (2011) Feng H., Soria R., 2011, New A Rev., 55, 166
- Fitzpatrick & Massa (2007) Fitzpatrick E. L., Massa D., 2007, ApJ, 663, 320
- Garmire et al. (2003) Garmire G. P., Bautz M. W., Ford P. G., Nousek J. A., Ricker Jr. G. R., 2003, in Truemper, J. E. and Tananbaum, H. D., eds., X-Ray and Gamma-Ray Telescopes and Instruments for Astronomy, Vol. 4851 of Proc. SPIE. SPIE, Bellingham WA, p. 28
- Gladstone et al. (2009) Gladstone J. C., Roberts T. P., Done C., 2009, MNRAS, 397, 1836
- Helfand (1984) Helfand D. J., 1984, PASP, 96, 913
- Henze et al. (2012a) Henze M., Pietsch W., Haberl F., 2012a, Astron. Tel., 3959
- Henze et al. (2012b) Henze M., Pietsch W., Haberl F., 2012b, Astron. Tel., 3890
- Henze et al. (2012c) Henze M., Pietsch W., Haberl F., 2012c, Astron. Tel., 3921
- Henze et al. (2012) Henze M., Pietsch W., Haberl F., Greiner J., 2012, Astron. Tel., 4125
- Holland (1998) Holland S., 1998, AJ, 115, 1916
- Kaur et al. (2012) Kaur A., Henze M., Haberl F., Pietsch W., Greiner J., Rau A., Hartmann D. H., Sala G., Hernanz M., 2012, A&A, 538, A49
- King et al. (2001) King A. R., Davies M. B., Ward M. J., Fabbiano G., Elvis M., 2001, ApJ, 552, L109
- Kraft et al. (1991) Kraft R. P., Burrows D. N., Nousek J. A., 1991, ApJ, 374, 344
- Kubota & Done (2004) Kubota A., Done C., 2004, MNRAS, 353, 980
- Leahy et al. (1983) Leahy D. A., Darbro W., Elsner R. F., Weisskopf M. C., Kahn S., Sutherland P. G., Grindlay J. E., 1983, ApJ, 266, 160
- Long & van Speybroeck (1983) Long K. S., van Speybroeck L. P., 1983, in Lewin W. H. G., van den Heuvel E. P. J., eds., Accretion-Driven Stellar X-ray Sources, Cambridge University Press, Cambridge, p. 141
- Lorenzin & Zampieri (2009) Lorenzin A., Zampieri L., 2009, MNRAS, 394, 1588
- Magnier et al. (1992) Magnier E. A., Lewin W. H. G., van Paradijs J., Hasinger G., Jain A., Pietsch W., Truemper J., 1992, A&AS, 96, 379
- Mapelli et al. (2009) Mapelli M., Colpi M., Zampieri L., 2009, MNRAS, 395, L71
- Middleton et al. (2011) Middleton M. J., Sutton A. D., Roberts T. P., 2011, MNRAS, 417, 464
- Middleton et al. (2012) Middleton M. J., Sutton A. D., Roberts T. P., Jackson F. E., Done C., 2012, MNRAS, 420, 2969
- Motta et al. (2009) Motta S., Belloni T., Homan J., 2009, MNRAS, 400, 1603
- Motta et al. (2012) Motta S., Homan J., Muñoz-Darias T., Casella P., Belloni T. M., Hiemstra B., Mèndez, M. 2012, MNRAS, in press (eprint: astro-ph.HE/1209.0327)
- Mucciarelli et al. (2006) Mucciarelli P., Casella P., Belloni T., Zampieri L., Ranalli P., 2006, MNRAS, 365, 1123
- Murray et al. (2000) Murray S. S. et al., 2000, in Truemper J. E., Aschenbach B., eds., X-Ray Optics, Instruments, and Missions III, Vol. 4012 of Proc. SPIE. SPIE, Bellingham WA, p. 68
- Oke & Gunn (1983) Oke J. B., Gunn J. E., 1983, ApJ, 266, 713
- Patruno & Zampieri (2008) Patruno A., Zampieri L., 2008, MNRAS, 386, 543
- Patruno & Zampieri (2010) Patruno A., Zampieri L., 2010, MNRAS, 403, L69
- Pintore & Zampieri (2012) Pintore F., Zampieri L., 2012, MNRAS, 420, 1107
- Poole et al. (2008) Poole T. S. et al., 2008, MNRAS, 383, 627
- Predehl & Schmitt (1995) Predehl P., Schmitt J. H. M. M., 1995, A&A, 293, 889
- Roberts (2007) Roberts T. P., 2007, Ap&SS, 311, 203
- Roming et al. (2005) Roming P. W. A. et al., 2005, Space Science Reviews, 120, 95
- Schlegel et al. (1998) Schlegel D. J., Finkbeiner D. P., Davis M., 1998, ApJ, 500, 525
- Shaposhnikov & Titarchuk (2009) Shaposhnikov N., Titarchuk L., 2009, ApJ, 699, 453
- Sivakoff et al. (2008) Sivakoff G. R. et al., 2008, ApJ, 677, L27
- Soria et al. (2012) Soria R., Kuntz K. D., Winkler P. F., Blair W. P., Long K. S., Plucinsky P. P., Whitmore B. C., 2012, ApJ, 750, 152
- Stanek & Garnavich (1998) Stanek K. Z., Garnavich P. M., 1998, ApJ, 503, L131
- Stobbart et al. (2006) Stobbart A.-M., Roberts T. P., Wilms J., 2006, MNRAS, 368, 397
- Strohmayer & Mushotzky (2003) Strohmayer T. E., Mushotzky R. F., 2003, ApJ, 586, L61
- Strohmayer & Mushotzky (2009) Strohmayer T. E., Mushotzky R. F., 2009, ApJ, 703, 1386
- Strohmayer et al. (2007) Strohmayer T. E., Mushotzky R. F., Winter L., Soria R., Uttley P., Cropper M., 2007, ApJ, 660, 580
- Zacharias et al. (2005) Zacharias N., Monet D. G., Levine S. E., Urban S. E., Gaume R., Wycoff G. L., 2005, VizieR Online Data Catalog, 1297, 0
- Zampieri & Roberts (2009) Zampieri L., Roberts T. P., 2009, MNRAS, 400, 677