Stochastic dynamic model of a growing network based on self-exciting point process
Abstract
We put under experimental scrutiny the preferential attachment model that is commonly accepted as a generating mechanism of the scale-free complex networks. To this end we chose citation network of Physics papers and traced citation history of 40,195 papers published in one year. Contrary to common belief, we found that citation dynamics of the individual papers follows the superlinear preferential attachment, with the exponent . Moreover, we showed that the citation process cannot be described as a memoryless Markov chain since there is substantial correlation between the present and recent citation rates of a paper. Basing on our findings we constructed a stochastic growth model of the citation network, performed numerical simulations based on this model and achieved an excellent agreement with the measured citation distributions.
pacs
01.75.+m, 02.50.Ga, 89.75.Fb, 89.75.DaThe field of growing complex networks (informational, social, biological, etc.) attracted increasing interest in the physics community during past decade [1, 2, 3]. Many of these networks are believed to achieve stationary state and to become scale-free [1, 4, 5]. The static characteristics of growing networks such as clustering coefficient, community structure, and degree distribution were extensively studied both theoretically and empirically [1, 2, 3] while the dynamics of these networks was studied mostly theoretically. It is widely believed that they are generated by the preferential attachment [1] (cumulative advantage [5]) mechanism. The latter assumes that new links are distributed between existing nodes with probability where is the attractivity i.e., the expected number of links acquired by a node in a short time interval [1]. From the perspective of a single node, the number of incoming links grows according to the inhomogeneous Markov process with the rate
| (1) |
where is the number of existing links, is the ”initial attractivity”, is the attachment exponent, is the age of the node, and is the aging function [2, 6]. In fact, Eq. 7 describes the stochastic multiplicative growth process
| (2) |
where is the actual number of newly acquired links during time interval and is its stochastic component.
The direct way to verify Eq.7 is to measure -distributions for the sets of nodes with the same degree , to find , and to check how depends on . Previous studies that were aimed at this goal [8, 9, 10, 11], focussed on the citations to scientific papers as one of the best documented networks and a prototype for the study of dynamic behavior of growing networks [12]. Since the above studies were restricted to relatively small or inhomogeneous data sets, they had to apply indirect averaging procedures, such as numerical integration [8, 9] or moving average [10, 11]. These procedures are prone to quantization errors and yield inconclusive results.
Our goal is the direct measurement of the average growth rate of the node degree in a complex network (Eq.7) and the assessment of its stochastic part (Eq.2) as well. Following the accepted practice [8, 9, 10, 11] we chose a network of citations to scientific papers. We performed high-statistics and time-resolved study of the citation dynamics of a very large set of papers that is field- and age-homogeneous (one scientific discipline, one publication year). Basing on our findings we constructed a stochastic model of citation dynamics with no ”hidden” parameters such as fitness [13] or relevance [14]. Then we performed numerical simulation based on our model and verified that the real and simulated citation networks have the same microscopic and macroscopic characteristics.
We used the Thomson-Reuters ISI Web of Science, chose 82 leading Physics journals, excluded review articles, comments, editorial, etc., and analyzed citation history of all 40,195 original research Physics papers published in these journals in one year -1984. For each paper we determined - the total number of citations accumulated after years (), and - the number of citations gained by the same paper in the year . For every citing year we grouped all papers into 40 logarithmically-spaced bins, each bin containing the papers with close . Figure 1 shows statistical distributions of for several such bins and for two selected years. For each bin we found the mean, , and the variance, .


Figure 2 shows that dependence is well accounted for by Eq.7 where , and are fitting parameters. We found that the aging function follows the power-law decay, ; the initial attractivity is almost time-independent, ; (iii) the exponent gradually increases with time from to . Although the deviation of from unity is small, it is significant and contrasts the assumption of linearity commonly accepted by the practitioners of the preferential attachment model [1, 4, 5, 14, 15]. Indeed, while the linear preferential attachment generates the scale-free network with the power-law degree distribution, the superlinear preferential attachment tends to generate the ”winner-takes-all” network [6, 2].


For comparison, we performed similar measurements for the Mathematics and Economics papers published in the same year (1984). We found that the citation dynamics for both these disciplines is also well accounted for by Eq.7. The and turn out to be almost the same as those for Physics while the aging function is different (see Supplementary Material). Similar and were found in the US patent citation studies [16]. This suggests universal microscopic mechanism of citation accumulation whereas the variations in total citation counts between scientific fields can be attributed to different initial conditions (the number of citations gained during first couple of years after publication) and to different growth rates of the number of publications.
In what follows we analyze another key ingredient of the preferential attachment model - the Markov chain assumption. Since Eq.7 postulates that the citation rate depends only on the number of previous citations , it follows that the statistical distribution of additional citations , gained by the papers with the same during a time window , should be nothing else but the Poissonian:
| (3) |
To the best of our knowledge, statistical distribution of additional citations was not measured so far. This new kind of measurements (Fig.1) reveals that the -distributions are broader than the Poissonian. To quantify this broadening we used the variance-to-mean ratio, , also known as index of dispersion or Fano factor. Figure 3 shows that for small , as expected for the Poisson distribution, while for large .


This strong deviation from the Poissonian indicates that Eq.7 misses some important factor which determines the growth of citation networks. We reasoned that the missing factor is related to citation history of papers. To probe this conjecture we considered the temporal autocorrelation of the annual citations, . Since the typical citation history of a paper is too short (10-15 years), the measurement of autocorrelation for a single paper is unreliable. Therefore, we measured autocorrelation in the sets of papers that at certain citing year have the same number of previous citations . Specifically, we found the number of citations garnered by each paper in such set during the current year and the last year- and , correspondingly, and calculated the Pearson autocorrelation coefficient
| (4) |
Here, are the standard deviations of the and distributions, respectively (), and the averaging is performed over all papers in the set. This was done for all and . Figure 4 shows that grows with . For moderately cited papers, , the autocorrelation is weak while for highly cited papers, , the autocorrelation is strong: .

The empirical function
| (5) |
fits well our measurements. Strong temporal autocorrelation of citations violates the underlying assumption of the preferential attachment model [1, 5, 4]: it turns out that citations dynamics is not a Markov process since it depends on past history.
We suggest a more realistic growth model that is based on the the first-order linear autoregression,
| (6) |
where is the latent citation rate and is given by Eq.5. The actual number of citations is given by Eq.3. Equation 6 introduces positive feedback between successive citations of the same paper, in other words, it approximates the citation dynamics of a paper by the inhomogeneous self-exciting point process [17]. (Similar ideas were discussed in Refs. [11, 18].) The resulting preferential attachment model replaces Eq.7 by Eq.6 in such a way that the stochastic term in Eq.2 reduces to the Poissonian noise. Equation 6 states that the latent citation rate of a paper [7] depends not only on the total number of accumulated citations but on the recent citation rate as well. This accounts for the ”sleeping beauties”: the papers that initially had small number of citations but suddenly became popular. While the conventional preferential attachment model (Eq.7) yields predominance of the ”first-movers” [19], our more realistic model allocates a fair share of citations to ”sleeping beauties”.
To verify the multiplicative stochastic model described by Eq.6 we chose all Physics papers published in the same year (1984), fixed a certain citing year (1986), measured the number of total and last year citations, and , and calculated for each paper using Eq.6 with experimentally measured parameters and . Then we run numerical simulations assuming Poisson process with the rate given by Eq.6, found the number of citations of each paper in the year , and calculated the cumulative distribution of citations. The procedure was repeated for the next year and so on. Figure 5a shows that this algorithm closely reproduces the actual citation distribution for each citing year. This means that Eq.6 yields an excellent description not only of the microscopic citation dynamics but of the macroscopic citation distribution as well. On another hand, the numerical simulation that assumes only Poisson process and ignores correlations, does not reproduce well our measurements (Fig. 5b).


What are the implications of our study? We find that the cumulative citation distribution is neither stable nor stationary but develops in time. Immediately after publication the spread of initial conditions (journal circulation numbers) yields convex cumulative distribution of citations that can be fitted equally well by the (discrete) power-law [20, 21, 22] or log-normal [10, 24, 31, 23] functions. Thereafter, citation dynamics of most papers is dominated by the first term in Eq.6 in such a way that the citation history of papers that managed to garner less than 50-70 citations is completed after 10-15 years. However, the papers with more than 50-70 citations continue to be cited even after 10-15 years, their dynamics being determined by the second term in Eq.6 which does not decay with time. In other words, while the bulk of the citation distribution becomes stable, the tail grows. In the course of time its shape changes from the convex to concave in such a way that for the most part of the time the tail looks straight in the log-log coordinates. Although such power-law tail was previously considered as a fingerprint of the scale-free network, at least for citation network it turns out to be a transient phenomenon. The intrinsic scale of the citation network, , is clearly revealed in the microscopic dynamics (Fig.4). We conclude that the almost power-law degree distribution of citations that was previously interpreted as the indication of the scale-free network [1, 3, 5, 20] arises from the interplay between aging [26], multiplicative stochastic process (Eq.2), and superlinear preferential attachment.
The two-term Eq. 6 implies that scientific papers constitute two broad classes with respect to their longevity [10]. The citation rate of the 90 of the papers achieves its maximum in 2-3 years after publication and decays to zero in 10-15 years. Citation dynamics of these papers is the aftereffect of their initial hit and is more or less predictable since the impact of these papers is probably limited to several research groups and does not propagate further. However, citation rate of of the papers that overcome the tipping point [22] of citations is determined more by their recent citation history. It seems that these papers have a continuing impact [27]which propagates from one research group to another in a cascade process like in epidemics [28]. This diffusion of scientific knowledge [29] extends the paper longevity to much more than 10-15 years.
In summary, our measurements indicate that the mechanism that generates complex networks may be more sophisticated than the memoryless linear preferential attachment assumed so far. We propose a stochastic growth model that considers the evolution of the node degree as an inhomogeneous self-exciting point process. In the context of citations, the model is fully verified by our microscopic and macroscopic measurements and can serve for prognostication of the future citation behavior of a paper, group of papers, or of a journal impact factor.
We are grateful to S. Redner, N. Shnerb, and A. Scharnhorst for insightful discussions.
References
- [1] R. Albert and A.L. Barabasi, Rev. Mod. Phys. 74, 47 (2002).
- [2] S.N. Dorogovtsev and J.F.F. Mendes, Adv. Phys. 51, 1079 (2002).
- [3] M. E. J. Newman, SIAM review, 45, 167 (2003); Physics Today, 33, November (2008).
- [4] H.A. Simon, Biometrika 42, 425 (1955).
- [5] D. de Solla Price, Science 149, 510 (1965); J. Am. Soc. for Inform. Science 27, 292 (1976).
- [6] P. L. Krapivsky, S. Redner, and F. Leyvraz, Phys. Rev. Lett. 85, 4629 (2000).
- [7] Q.L. Burrell, J. Am. Soc. for Inform. Science, 54, 372 (2003).
- [8] H. Jeong, Z. Neda, and A.L. Barabasi, Europhys. Lett. 61, 567 (2003).
- [9] Y.-H. Eom, C. Jeon, H. Jeong, and B. Kahng, Phys. Rev. E 77, 056105 (2008).
- [10] S. Redner, Physics Today 58, 49 (2005).
- [11] M. Wang, G. Yu, and D. Yu, Physica A 387, 4692 (2008).
- [12] A. Scharnhorst, K. Borner, and P. van den Besselaar, Models of Science Dynamics (Springer, Berlin, 2012).
- [13] G. Bianconi and A.L.Barabasi, Phys. Rev. Lett. 86, 5632 (2001).
- [14] M. Medo, G. Cimini, and S. Gualdi, Phys. Rev. Lett. 107, 238701 (2011).
- [15] S. Valverde, R.V.Sole, M.A.Bedau, and N. Packard, Phys. Rev. E.76, 056118 (2007).
- [16] G. Csardi, K.J. Strandburg, L. Zalanyi, J.Tobochnik, and P. Erdi, Physica A 374, 783 (2007).
- [17] A. G. Hawkes, Biometrika 58, 83 (1971).
- [18] C. Cattuto, V. Loreto, and V.D.P.Servedio, Europhys. Lett. 76, 208 (2006).
- [19] M. E. J. Newman, Europhys. Lett. 86, 68001 (2009).
- [20] S. Redner, Eur. Phys. J. B 4, 131 (1998).
- [21] M.L. Wallace, V. Lariviere, and Y. Gingras, J. Informetrics 3, 296 (2009).
- [22] G.J. Peterson, S. Presse, and K.A. Dill, Proc. Natl. Acad. Sci. USA 107, 16023 (2010).
- [23] A.M. Petersen, F. Wang, and H.E. Stanley, Phys. Rev. E 81, 036114 (2010).
- [24] M.J. Stringer, M. Sales-Pardo, and L.A.N. Amaral, PLoS ONE 3, e1683, (2008).
- [25] F. Radicchi, S. Fortunato, and C. Castellano, Proc. Natl. Acad. Sci. USA 105, 17268 (2008).
- [26] S. N. Dorogovtsev and J. F. F. Mendes, Phys. Rev. E 62, 1842 (2000).
- [27] M. Golosovsky and S.Solomon, Eur. Phys. J 205, 303 (2012).
- [28] W. Goffman and V.A. Newill, Nature 204, 225 (1964).
- [29] A.B. Jaffe and M. Trajtenberg, Proc. Natl. Acad. Sci. USA 93, 12671 (1996).
- [30] S.C. Bradford, Engineering 137, 85 (1934). Reprint: Journal of Information Science, 10, 176 (1985).
- [31] F. Radicchi, S. Fortunato, and C. Castellano, Proc. Natl. Acad. Sci. USA 105, 17268 (2008).
Supplementary material: Methodology
To find time evolution of the number of citations of Physics papers we used the Thomson-Reuters ISI Web of Science. We chose a certain publishing year (1984) that on the one hand is distant enough from now, while on another hand, the contents of the most part of the papers published in this year is available now in the electronic format. We considered the fields of Physics, Astrophysics, Optics, Crystallography, and Material Science and excluded popular science and review journals. We performed the search using 82 journals with the highest annual number of publications and considered only articles, letters and notes while the editorial material, comments, and reviews were excluded. To find Physics papers in the multidisciplinary Nature and Science journals we looked through the titles of all publications in 1984 and chose only those that by our opinion fall under Physics category.
How representative is this list of journals? To answer this question we invoke Bradford’s law [30] stating that few largest journals contain the dominant part of papers in the field. Figure 6 shows that the rank-size distribution for the set of largest 82 journals exhibits the power-law dependence with cut-off. Extrapolation to yields that these 82 journals contain of all Physics papers published in 1984.

Supplementary material: The list of Physics journals
Physical Review A,B,C,D; Physical Review Letters; Japanese Journal of Applied Physics A,B; Journal of Physics*; Physics Letters A,B; Acta Crystallographica*; Journal of Chemical Physics; Physica Status Solidi*; Nuclear Instruments*; Astrophysical Journal; Journal of Physical Chemistry; Journal of Applied Physics; Journal de Physique*; Chemical Physics Letters; Nuclear Physics*; Journal of the Optical Society of America*; Solid State Communications; Zeitschrift fur Physik*; Applied Physics Letters; Applied Optics; Surface Science; Journal of the Physical Society of Japan; Journal of Vacuum Science*; Journal of Non-Crystalline Solids; Journal of Crystal Growth; Comptes Rendu de’l Academie des Sciences Serie II *; Thin Solid Films; Journal of Materials Science; American Journal of Physics; Physics of Fluids; Nuovo Cimento*; Review of Scientific Instruments; Physica ?; Chemical Physics; Optics Communications; Journal of Magnetism and Magnetic Materials; Journal of Luminescence; Journal of Fluid Mechanics; Philosophical Magazine*; Physica Scripta; Canadian Journal of Physics; Journal of Statistical Physics; Optics Letters; Applied Spectroscopy*; Solid State Ionics; Plasma Physics and Controlled Fusion; Journal of Physics and Chemistry of Solids; Journal of Computational Physics; Communications in Mathematical Physics; Zeitschrift fur Kristallographie*; Nature, Science.
Supplementary material: Homogeneity of Physics
The homogeneity of our data set with respect to citations is ensured by the fact that the papers in different Physics subdisciplines are published in the same journals. These journals impose a certain standard of the reference list length that provides a natural scale for citations in this scientific discipline. Indeed, assume the cohort of all papers that were published in the same year and consider citation distribution for this cohort after many years. Since all these papers will be cited predominantly by the papers in the same discipline, and neglecting the annual growth of the number of publications, the mean number of citations would be equal to the average length of the reference list. This condition of stationarity was the rationale for our choice of the whole Physics discipline rather than a single subdiscipline.
This homogeneity of Physics with respect to citations is also revealed from the inspection of the cumulative citation distributions for the papers published in different Physics journals. Indeed, in the researcher’s perception the theoretical and experimental papers could have different citation pattern. To find out to what extent this is true we chose three large Physics journals that do not have page limitation- Physical Review B (PRB), Journal of Aplied Physics (JAP), and Review of Scientific Instruments (RSI). As seen from the reader/author’s perspective, PRB publishes theoretical and experimental papers in fair proportion, JAP is more biased towards experimental papers, and RSI publishes almost exclusively experimental papers. Figure 7 shows cumulative citation distribution for the papers published in these journals in the decade 1980-1989. Although these distributions look different they almost collapse after rescaling where is a journal-specific constant [31]. This means that the growth model for citations of the papers published in these three journals is actually the same and only the scale (initial conditions, namely, the number of citations garnered by a paper during first 2-3 years after publication) is different.


The homogeneity of the Physics discipline with respect to citations becomes evident also from the consideration of the list of the most cited Physics papers. As an example we chose fifteen most cited papers published in the decade of 1980-1989 and cited by 2008. Notably, the list below is not dominated by a single subdiscipline. Although the theoretical papers prevail, the experimental papers are represented fairly well (26.6). (The absence of several Nobel prize-winning papers that appeared during this period is explained by the fact that they quickly became common knowledge).
- •
C.T. Lee, W.T. Yang, R.G. Parr, ”Development of the Cole-Salvetti correlation-energy formula into a functional of the electron-density”, Phys.Rev.B (1988); 22031 citations.
- •
A.D. Becke, ”Density-functional exchange-energy approximation with correct asymptotic- behavior”, Phys.Rev.A (1988); 14383 cit.
- •
N. Walker, D.Stuart, ”An empirical-method for correcting diffractometer data for absorption effects”, Acta Crystallographica A (1983); 8499 cit.
- •
S.H. Vosko, L. Wilk, M. Nusair, ”Accurate spin-dependent electron liquid correlation energies for local spin-density calculations - a critical analysis”, Canadian Journal of Physics (1980); 8234 cit.
- •
T.H. Dunnig, ”Gaussian-basis sets for use in correlated molecular calculations .1. the atoms boron through neon and hydrogen”, J. Chem.Phys. (1989); 8186 cit.
- •
J.G. Bednorz, K.A. Muller, ”Possible high- superconductivity in the Ba-La-Cu-O system”, Zeitschrift fur Physik-Condensed matter, (1986); 7407 cit.
- •
S.Kirkpatrick, C.D. Gelatt, M.P. Vecchi, ”Optimization by simulated annealing”, Science (1983); 6907 cit.
- •
W.L. Jorgensen, J. Chandrasekhar, J.D. Madura, R.W. Impey, M.L. Klein, ”Comparison of simple potential functions for simulating liquid water”, J.Chem.Phys. (1983); 6838 cit.
- •
J.P.Perdew, A. Zunger, ”Self-interaction correction to density- functional approximations for many-electron systems”, Phys.Rev. B (1981); 6784 cit.
- •
J.P.Perdew, ”Density-functional approximation for the correlation-energy of the inhomogeneous electron-gas”, Phys.Rev.B (1986); 6429 cit.
- •
H.D.Flack, ”On enantiomorph-polarity estimation”, Acta Crystallographica A (1983); 6381 cit.
- •
H.J.C. Berendsen, J.P.M. Postma, W.F. Vangusteren, A.Dinola, J.R. Haak, ”Molecular-dynamics with coupling to an external bath”, J. Chem.Phys. (1984); 5877 cit.
- •
H.W. Kroto, J.R. Heath, S.C. Obrien, R.F. Curl, R.E. Smalley, ”C-60 - buckminsterfullerene”, Nature (1985); 5861 cit.
- •
D.M. Ceperley, B.J. Alder, ”Ground-state of the electron-gas by a stochastic method”, Phys.Rev.Lett. (1980); 5499 cit.
- •
G. Binnig, C.F. Quate, C. Gerber, ”Atomic force microscope”, Phys.Rev.Lett. (1986); 5364 cit.
Supplementary material: Comparison to other disciplines
We performed similar studies using Mathematical and Economics papers. Unlike Physics study where we tried to cover the whole field in order to achieve good statistics, here we adopted a different choice and considered only pure Mathematical and pure Economics papers. The resulting data set is more homogeneous but does not have enough statistics due to relatively small number of papers. We used the Thomson Reuters ISI Web of Science, chose all relevant Math journals (500 titles), considered all original research Math papers published in these journals in one year -1984 excluding review articles, comments, editorial, etc. This left 6313 Math papers. A similar search in the field of Economics (165 relevant journals) yielded 3043 original research papers published in 1984. We analyzed citation history of these papers from 1984 to 2011.
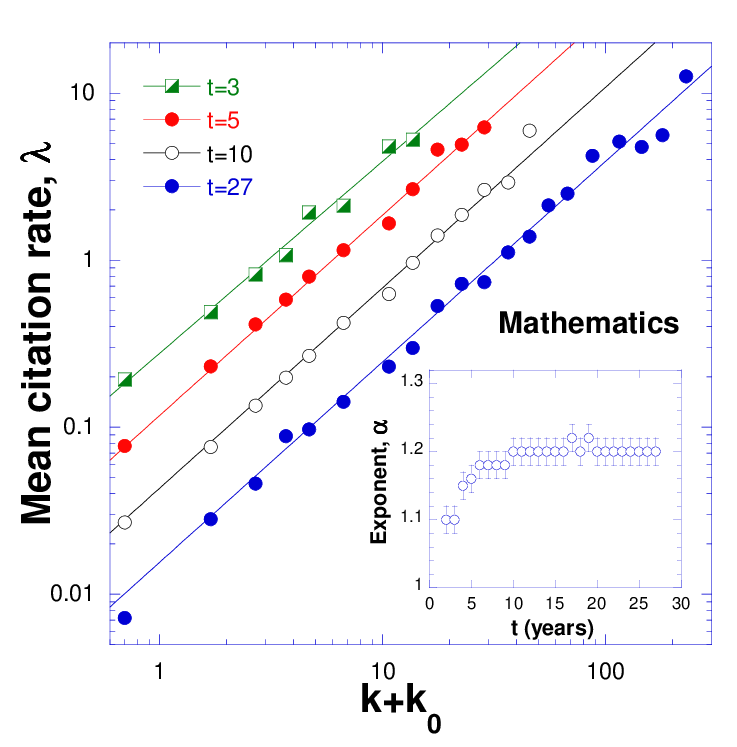
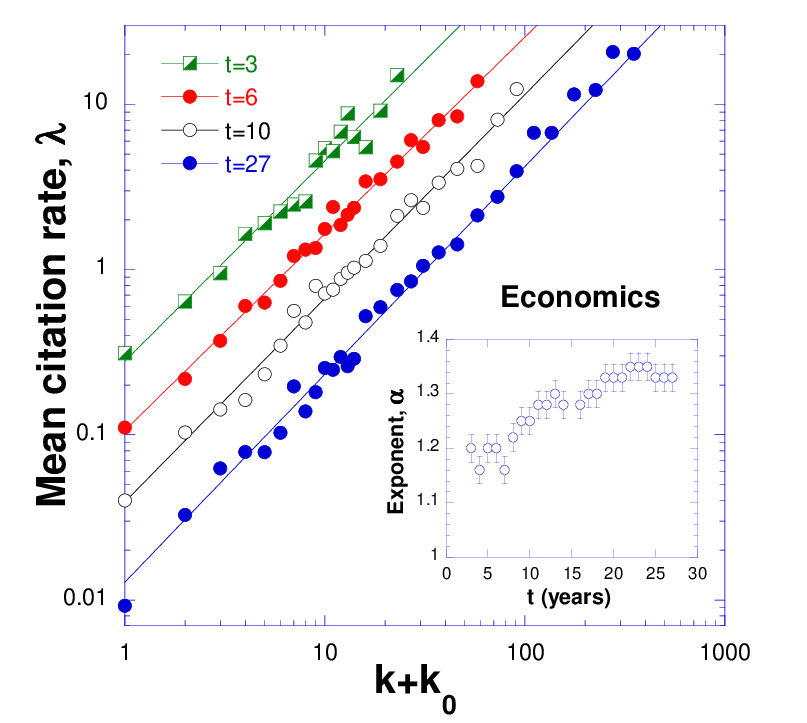
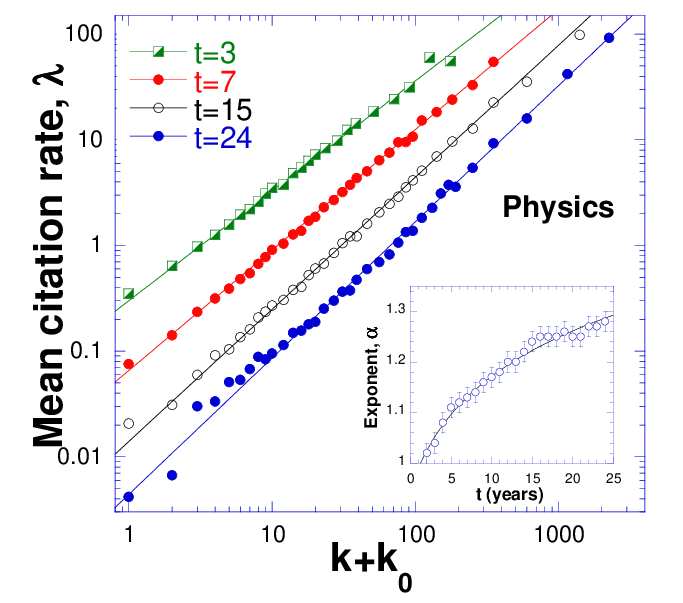
For each paper we determined - the total number of citations accumulated after years (), and - the number of additional citations gained by the paper in the year . We chose a certain citing year and grouped all papers into logarithmically-spaced bins, each bin containing the papers with close , and found the mean, , of each distribution.
Figure 8 shows that the plots for all three disciplines can be fitted by the superlinear dependence
| (7) |
where is the number of previous citations, is the ”initial attractivity”, is the attachment exponent, and is the aging function.

We observe that the citation dynamics for all three disciplines follows superlinear preferential attachment mechanism (Eq.7) with similar parameters , and the aging function decaying with time as in the first decade after publication. (Divergence of after 10 years is most probably related to the different annual growth rate of the number of publications in these disciplines.) The Pearson autocorrelation coefficient for the Mathematical and Economics papers (not shown here) can be approximated by the same dependence, , found for the Physics papers. All this provides strong evidence of the generality of our results.