The nature of dark matter from the global high redshift HI 21 cm signal
Abstract
We study the imprint of dark matter (DM) annihilation on the global 21 cm signal from the Dark Ages to Cosmic Reionization. Motivated by recent observations, we focus on three DM candidates: (i) a 10 GeV Bino-like neutralino (ii) a 200 GeV Wino and (iii) a 1 TeV heavier particle annihilating into leptons. For each DM candidate we assume two values for the thermally averaged annihilation cross section , the standard thermal value and the maximum value allowed by WMAP7 data, . We include the enhancement of DM annihilations due to collapsed structures, detailed estimates of energy deposition into the intergalactic medium (IGM), as well realistic prescriptions for astrophysical sources of UV and X-ray radiation. In these models, the additional heat input from DM annihilation suppresses the mean 21cm brightness temperature offset by few–100 mK. In particular, the very deep mK absorption feature at predicted by popular models of the first galaxies is considerably reduced or totally erased by some of the considered DM candidates. Such an enhancement in IGM heating could come from either DM annihilations or a stronger-than-expected astrophysical component (i.e. abundant early X-ray sources). However, we find that the two signatures are not degenerate, since the DM heating is dominated by halos several orders of magnitude smaller than those hosting galaxies, whose fractional abundance evolves more slowly resulting in a smaller gradient: in the range . The detection of such signals by future radio telescopes would be clear evidence of DM energy injection at high-redshifts.
Keywords:
intergalactic medium - cosmology: theory - diffuse radiation - dark matter1 Introduction
In the framework of the successful CDM cosmology theory only 5 % of the current energy content of the Universe is made of visible matter, while the rest is divided into two dark components, 73 % in the form of the so called Dark Energy, with the remaining 22 % accounted for by Dark Matter (DM) which only interacts with baryons through gravity (Komatsu et al., 2009). The existence of DM seems to be indirectly confirmed by a large set of observations (even though it is conceivable that in the future a new theory of gravity could do without DM), however its nature remains unknown. The accuracy of CDM in explaining the evolution of the Universe is one of the major successes of modern cosmology; however the question of what makes up over 95 % of the Universe is still open.
A huge effort has been made in the past decades to detect DM directly and indirectly. Currently, the best we can do is to place constraints on the properties (e.g. mass, annihilating cross section, decay rate) of some of the proposed DM candidates, thanks mostly to recent observations. We will focus here on Weakly Interacting Massive Particles (WIMPs) that are among the most popular DM candidates since their existence and properties are predicted by several extensions of the Standard Model of particle physics.
WIMPs have a small but non negligible interaction cross-section with ordinary matter and therefore in principle they can be directly detected via elastic collision with the nuclei of terrestrial targets. Several recent experiments such as DAMA/LIBRA, DAMA/Nal, CDMS-II, EDELWEISS-II, CoGeNT, XENON100 have attempted such detection (see e.g. Bernabei et al. 2004; Bernabei et al. 2008; Bernabei et al. 2010; Aalseth et al. 2011a; Aalseth et al. 2011b; Aprile et al. 2011; CDMS II Collaboration et al. 2010; Armengaud et al. 2010). Promising results came from CoGeNT, which reported about a hundred events exceeding the expected background, possibly originated from the nuclear recoil by scattering from DM particles of mass GeV. A light WIMP with similar mass is also favored by the recent DAMA/LIBRA annual modulation signal (Bernabei et al. 2010; Aalseth et al. 2011a; Aalseth et al. 2011b).
Astrophysical observations in the X-ray and Gamma radiation bands have also been used to indirectly detect a DM generated signal. A lot of excitement followed the recent detection by the PAMELA, ATIC, FERMI-LAT and HESS experiments of an excess in the electron/positron cosmic ray energy spectrum, which could be explained by annihilating DM with mass of order of 1 TeV (Cirelli, Franceschini & Strumia, 2008; Liu et al., 2010; Berg et al., 2009; Hooper & Tait, 2009; Chen, Takahashi & Yanagida, 2009; Abdo et al., 2010, see e.g.). The results appear to be far from conclusive due to the difficulties in properly modeling the cosmic ray energy spectrum and because other astrophysical sources such as pulsars could be responsible for the signal (di Bernardo et al., 2011; Profumo, 2012, see e.g.).
Another promising observational window for the indirect search of DM will be available in the near future when next generation radio interferometers such as the Low frequency Array (LOFAR11 1 http://www.lofar.org/), the 21 Centimeter Array (21CMA22 2 http://21cma.bao.ac.cn/), the Murchison Widefield Array (MWA33 3 http://www.mwatelescope.org/) and the Square Kilometer Array (SKA44 4 http://www.skatelescope.org/). These large interferometers will be able to map at arcminute scales the redshifted 21 cm line corresponding to the hyperfine triplet-singlet line transition of the ground level neutral hydrogen (HI) at , i.e. during the Epoch of Reionization (EoR) and possibly well into the so called Cosmic Dark Ages of the Universe (Peterson, Pen & Wu, 2005; Bowman, Morales & Hewitt, 2006; Kassim et al., 2004; Wyithe, Loeb & Barnes, 2005, see e.g.).
The global sky-averaged 21 cm signal could potentially be measured as a function of frequency even by single dipoles: this is the main scientific aim of current instruments such as the Experiment to Detect the Reionization Step (EDGES), while more advanced ones such as the Large-aperture Experiment to Detect the Dark Ages (LEDA55 5 http://www.cfa.harvard.edu/LEDA/) and the Dark Ages Radio Experiment (DARE66 6 http://lunar.colorado.edu/dare/mission.html), a lunar orbiting dipole experiment, are planned for construction (see e.g. Bowman & Rogers 2010; Greenhill & Bernardi 2012; Burns et al. 2012).
Any release of energy from DM - for instance, as is the case considered in this work, through annihilations - would be in part absorbed by the intergalactic medium (IGM) as heat and ionization. If this occurred before the first astrophysical sources (), it would produce a deviation from the theoretically well established thermal and ionization history (Chen & Kamionkowski, 2004; Mapelli, Ferrara & Pierpaoli, 2006; Cirelli, Iocco & Panci, 2009, see e.g.) and could alter significantly the HI 21 cm signal (Shchekinov & Vasiliev, 2007; Furlanetto, Oh & Pierpaoli, 2006; Valdés et al., 2007; Natarajan & Schwarz, 2009; Galli et al., 2011; Finkbeiner et al., 2012, see e.g.). If the DM energy injection occurred after the first astrophysical sources (), the deviation could be stronger and easier to observe, but would have to be disentangled from astrophysical uncertainties concerning the first galaxies. There are enormous observational challenges in detecting the 21 cm signal at , and such observations may be decades away from our current technological level. For this reason, we focus on the DM signal at lower redshift, after stars and galaxies started forming, and look for strategies to separate the DM signal from that of astrophysical sources.
We investigate the effects produced on the HI 21 cm signal by three DM candidates: (i) a 10 GeV Bino-like neutralino (ii) a 200 GeV Wino and (iii) a 1 TeV heavier particle annihilating into leptons. These candidates have been recently proposed to explain the aforementioned indirect/direct hints of DM detection. We allow the annihilation cross-section to be in a range which is compatible with CMB observations. For the first time we compute the 21 cm DM signal at in a self consistent scenario that includes a realistic prescription for the formation of astrophysical sources of UV and X-ray radiation.
The details of the energy deposition into the IGM from DM annihilations are an essential ingredient to compute the HI 21 cm signal. In Evoli et al. (2012b) we have studied the cascade produced by the products of DM annihilations for the three considered DM candidates: this allows us to discuss the impact of DM annihilations in a physically consistent way and to assess the observability of the chosen DM candidates with HI 21 cm observations in the near future.
The rest of the paper is organized as follows. In Sec. 2 we briefly introduce the DM candidates which we study; in Sec. 3 we explain in detail the method that we follow to compute the 21 cm DM signal. In Sec. 4 we present the results of our calculations, and in Sec. 5 we discuss the results and draw our conclusions.
2 Dark Matter models
In this Section we briefly introduce our DM models of choice. For a more detailed discussion of such DM particle candidates we refer the reader to Evoli et al. (2012a), were they are described extensively. We select three sample cases which have been recently investigated in connection with hints of DM signals in either direct and indirect search experiments. These sample cases are also representative of three different WIMP mass regimes, ranging from fairly light models to multi-TeV DM, and of three different kinds of annihilation channels.
Wino: We consider a pure Wino within the Minimal Supersymmetric extension to the Standard Model (MSSM). The recent interest in this model has been stimulated, besides its peculiar signatures at the LHC (Bertone et al., 2012), by the claim (Grajek et al., 2009; Kane, Lu & Watson, 2009) that a Wino with mass of about 200 GeV can explain the rise detected by PAMELA in the positron fraction.
Bino: We consider the case with mass of 10 GeV to model a strong coupling with quarks as suggested by recent results of direct detection experiments (e.g. CDMS, DAMA).
Leptophilic: Again motivated by the PAMELA positron excess, and possibly in connection with the local all-electron (namely electrons plus positrons) flux measured by Fermi and HESS, several analyses have considered the possibility of very heavy dark matter WIMPs, with masses up to several TeV and very large pair annihilation cross section (Cirelli et al., 2009; Bergström, Edsjö & Zaharijas, 2009, see e.g.). The results of such studies are that, to account for the electron/positron component without violating the antiproton bounds, dark matter needs to be leptophilic, i.e. the final products of the annihilation being dominantly leptons, most likely a combination of and . It has been recently pointed out (Ciafaloni et al., 2011) that for very heavy WIMPs the radiative emission of soft electroweak gauge bosons is crucial to model the high-energy spectrum.
| DM model | mass [GeV] | [cm3/s] | [eV/s] | Line style | |
|---|---|---|---|---|---|
| W+W- | 200 | blue solid | |||
| W+W- | 200 | blue dashed | |||
| 10 | red solid | ||||
| 10 | red dashed | ||||
| 1000 | green solid | ||||
| 1000 | green dashed |
3 Method
We first constrain the properties of our DM candidates from CMB data. This allows us to associate to each particle a range of allowed values for the annihilation cross section . We then use the fractional energy depositions from MEDEA2 (Evoli et al., 2012b) and the galactic radiation fields from 21cmFAST (Mesinger, Furlanetto & Cen, 2011) in order to compute the thermal and ionization evolution of the IGM and the associated global 21cm signal. We describe each of these steps in turn.
3.1 DM heating
Including the formation of substructures at redshift 50 naturally enhances the effects of DM annihilations: while they do not dramatically impact the global reionization history (Cirelli, Iocco & Panci, 2009) the increased energy injection could alter predictions of the observable 21 cm signal by heating the IGM. The total energy release by DM annihilations per unit volume is given by (see e.g. Cirelli, Iocco & Panci 2009; Chluba 2010):
| (1) |
where is the thermally averaged annihilation cross section, is the DM particle mass and is the number density of DM particles and anti-particles with present day value:
| (2) |
The term defines the effective averaged DM density resulting from structure formation and can be written as:
| (3) |
where is the halo mass function obtained adopting the Press-Schechter formalism (Press & Schechter, 1974) and is the concentration function depending on the distribution of DM inside halos, a function that peaks typically for sub-halo masses M⊙ at (see Fig. 7; we refer the reader to Cirelli, Iocco & Panci 2009 for details)77 7 Although extrapolating the halo mass function down to such small masses is highly uncertain, we note that at the scales and redshifts of interest, the Press-Schechter and Sheth-Thormen cumulative mass functions (Press & Schechter, 1974; Sheth & Tormen, 1999; Jenkins et al., 2001) agree to .. We use here a prescription for the effect of substructures and consider a minimum mass for primordial proto-haloes of M⊙ for the 10 GeV Bino, and M⊙ for the other two more massive candidates. This choice is motivated by recent calculations of the exponential cutoff mass in the power spectrum as a function of neutralino mass, resulting from free-streaming of the DM particles after the kinetic decoupling (see e.g.Bringmann 2009; van den Aarssen, Bringmann & Goedecke 2012).
Recent works (Slatyer, Padmanabhan & Finkbeiner, 2009; Galli et al., 2009, e.g.) have investigated the possible role of Sommerfeld enhancements due to which can be considerably boosted and becomes a function of redshift. We choose not to make assumptions on the physical processes that could boost and treat it as a parameter constrained by CMB observations.
We covered until now the energy production by DM annihilations. The most relevant quantity for our purposes is however the energy deposition into the IGM. Only a small fraction of the energy released by DM annihilations is finally deposited into the IGM in the form of heat, excitations and ionizations either of hydrogen and helium. The absorbed fraction depends on the DM candidate - in the form of the initial energy spectrum from the annihilation event - and on the environment where the annihilation takes place, specifically on the ionized fraction of the ambient gas and on the energy density of CMB photons, important for the Inverse Compton (IC) scatterings.
To model this, we use the Monte Carlo scheme MEDEA2 (for details see Evoli et al. 2012b). Through MEDEA2 we are able to calculate what fraction of the energy released by a single annihilation event goes into: (i) H and He ionizations (ii) excitations (iii) heating. A set of handy fitting formulae that take into account the dependence on and are then given for the respective quantities .
3.2 CMB constraints


We compute the modifications induced by DM annihilations on the CMB power spectra and on the integrated Thomson optical depth to verify that our models are consistent with WMAP7 observations and to put upper limits on for the considered DM candidates. To do so we modify the public code CAMB (Lewis & Challinor, 2011) and add a DM term to the evolution equations of the IGM kinetic temperature and ionized fraction (Fig.1).
With this modified version of CAMB code we can calculate the effects of DM annihilations on the temperature (TT), polarization (EE) and temperature-polarization (TE) CMB spectra. The TT spectrum allows us to put the most sensitive constraints of DM properties (see Fig.2). Our results are obtained assuming that the cosmological parameters have best-fitting values as indicated by the 7-yr WMAP data (Komatsu et al., 2011). For each DM candidate we increase the value of the thermally averaged annihilation cross section from the standard value up to a value for which the computed TT CMB spectrum exceeds by more than from the best-fit the WMAP7 data. The upper limits for each of the considered DM candidates are given in Tab. 1 along with the color and line-style later used in the plots. CMB observations by Planck will allow to put more stringent constraints on the properties of the DM candidates in the near future (The Planck Collaboration, 2006; Galli et al., 2009).
We then calculate the contribution of DM to the Thomson optical depth, , by integration:
| (4) |
where is the difference in the ionized fraction between the standard scenario and the case in which DM annihilates. We assume here that the Universe is fully ionized at redshift : this contributes by a factor to the WMAP measured total optical depth (Komatsu et al., 2011; Shull et al., 2012). Note that DM annihilations are only imprinted on the CMB as an additional source of ionization. Therefore the above procedure is effectively the same as choosing an upper limit for the extra contribution to from DM annihilations. From Tab. 1 we see that this is , making the total optical depth (in the absence of any additional astrophysical sources at ): . This limit is conservatively low, roughly corresponding to the 1- upper limit from WMAP7 obtained from the TE cross-correlation (Komatsu et al., 2011).
Notice that the heating/ionization contribution of the two heavier DM candidates assuming increases proportionally by a larger factor over the case with than what found for the 10 GeV Bino when assuming rather than . This is due to our assumption of a smaller minimum halo mass M⊙ that enhances strongly the effects of substructures and to which the CMB constraints are, on the other hand, less sensitive.
3.3 21 cm signal
One of the observable quantities most likely to carry a trace of the effects of DM annihilations is the redshifted 21 cm line associated with the hyperfine transition between the triplet and the singlet levels of the neutral hydrogen ground state. This signal is most commonly expressed in terms of the differential brightness temperature between a neutral hydrogen patch and the CMB (neglecting redshift-space distortions):
| (5) |
where is the neutral fraction of the gas, the overdensity, and is the spin temperature which is set by the number densities of hydrogen atoms in the singlet () and triplet () ground hyperfine levels, K.
It is theoretically well known that in the presence of the CMB alone, reaches thermal equilibrium with K on a short time-scale, making the HI undetectable in emission or absorption. However, collisions and scattering of Ly photons the so-called Wouthuysen-Field process or Ly pumping (e.g. Wouthuysen 1952; Field 1959; Hirata 2006) can couple to .
The spin temperature can be written as (e.g. Furlanetto, Oh & Briggs 2006):
| (6) |
where is the color temperature, which is closely coupled to (Field, 1959), and and are the two coupling coefficients relative to Ly scattering and collisions respectively. If either collisions or Ly radiation couple to then the neutral hydrogen will be visible in absorption or emission depending on whether the gas is colder or hotter that the CMB respectively.
For details about the physics associated with the HI 21 cm line and with the determination of , the quantity that governs it, we refer the reader to, e.g., Furlanetto, Oh & Briggs (2006); Hirata (2006); Valdés & Ferrara (2008). For our purposes it is important to state here that the physical quantities that determine are: (i) the gas density ; (ii) the CMB temperature ; (iii) the kinetic temperature of the gas, ; (iv) the ionized fraction ; and (v) the Ly background intensity .
While we know the average evolution of and we have to determine the others as a function of redshift. The equations that describe the average evolution of the ionized fraction and of the kinetic temperature are the following (Chen & Kamionkowski, 2004; Mesinger, Furlanetto & Cen, 2011, see e.g. ):
| (7) |
where is the mean baryon number density, is the heating rate per baryon for each process in erg s-1, is the ionization rate per baryon, is the case-B recombination coefficient, is the Boltzmann constant and is the helium fraction by mass.
The term includes both the contribution from galaxies and the term that accounts for DM annihilations. Similarly we have that is the sum of three contributions: (i) is Compton heating from CMB photons; (ii) is heating from astrophysical sources, which we take to be dominated by X-rays; (iii) is DM heating. Notice that when including DM in the terms and we use the specific fractional energy depositions from Evoli et al. (2012b).
The last equation needed to compute the 21 cm background is the one describing the evolution of the Ly background intensity :
| (8) |
where the contributions on the RHS correspond to recombinations, collisional excitations by electron impacts, direct stellar emission, X-ray excitation of HI, and DM annihilations (respectively) (Madau, Meiksin & Rees, 1997; Valdés et al., 2007; Mesinger, Furlanetto & Cen, 2011, see e.g.). The coupling coefficient, is proportional to the Lyman background flux, (e.g. Furlanetto, Oh & Briggs 2006).
In general, if we neglect the energy input from DM, we expect and to track down to , when decouples from and starts decreasing adiabatically as the Universe expands. is then coupled to due to the high gas density and the consequent strong collisional coupling. At gradually couples to until, at becoming virtually identical to it. It is believed however that at around this redshift the first collapsed luminous sources would ignite. Radiation produced by the first galaxies starts to ionize and heat the gas: on a short timescale, at a redshift , the Ly pumping effectively couples to , and only later, at , heating from galaxies drives to values higher than , making the neutral regions in the IGM visible in emission. Therefore a second absorption feature is expected at (see e.g. Furlanetto, Oh & Briggs 2006; Pritchard & Loeb 2008). We can divide the global evolution of in six main phases:
- 1.
for z 300;
- 2.
for : this extended absorption feature has a minimum of mK at ;
- 3.
for ;
- 4.
at , a second absorption feature less extended in redshift than the previous one but deeper, with mK;
- 5.
, i.e. in emission, due to heating by galaxies at down to the Epoch of Reionization at ;
- 6.
for , where we still have a signal only from self-shielded systems.
Introducing the effects of DM annihilations in the standard scenario described above can produce deviations on : in particular the second absorption feature can be strongly modified by energy release by DM annihilations, at a redshift range that will be probed by the next generation of radio observatories such as LEDA and SKA.
3.4 Radiation from astrophysical sources


To compute the astrophysical contribution to , , and , we use the publicly available code, 21cmFAST 88 8 http://homepage.sns.it/mesinger/Sim.html. This code uses a combination of perturbation theory and excursion-set formalism to compute various cosmic fields, and is in good agreement with radiative transfer simulations of reionization (Mesinger & Furlanetto, 2007; Zahn et al., 2011; Mesinger, Furlanetto & Cen, 2011, e.g. ). The code is fully described in Mesinger, Furlanetto & Cen (2011), to which we refer the interested reader for more details. Here we briefly note that the code takes into account inhomogeneous X-ray ionization and heating, as well as Ly pumping from the first UV sources, integrating the evolution of cosmic structures and radiation fields along the light cone. Although 21cmFAST computes 3D realizations, in this work we only study the global 21cm signal, deferring analysis of the spatial structure to future work.
The simulation boxes are 750 Mpc on a side, with a final resolution of . The initial conditions are sampled on a grid. In Fig. 3 are presented the 1-cell thick (1.5 Mpc deep) slices through the HI 21 cm brightness temperature maps for two models with different prescriptions for the galaxy properties (Mesinger, Ferrara & Spiegel, 2012). The top panel corresponds to a ‘‘fiducial’’99 9 Notice that our ”fiducial” model does not exactly correspond to the fiducial model in Mesinger, Ferrara & Spiegel 2012 (consistent with the recent measurement of the keV X-ray luminosity of star forming galaxies from Mineo, Gilfanov & Sunyaev 2012), but instead corresponds to their T1e4_fuv1_fx5_1keV model (based on an extrapolation of the keV data from Gilfanov, Grimm & Sunyaev 2004). This model represents a more conservative choice since the astrophysical heating is 4 times higher, thus making the DM annihilation signal less apparent. model, in which the X-ray luminosity of primordial galaxies is the same as that observed in nearby starburst galaxies (e.g. Furlanetto 2006 and references therein). The lower panel corresponds to an ”extreme” model in which primordial galaxies, albeit rarer and appearing later, were much more efficient in generating hard X-rays. The later scenario is inspired by recent theoretical (e.g. Linden, Profumo & Anderson 2010; Mirabel et al. 2011) and observational (Reichardt et al., 2011; Mesinger, McQuinn & Spergel, 2012) claims. More specifically, these two models have the following characteristics:
- 1.
fiducial (top panel): Galaxies hosting UV and X-ray sources reside in atomically-cooled halos with virial temperatures K (corresponding to halo masses of at ). Ly pumping (i.e. spin temperature coupling) is dominated by early UV sources, assuming PopII stellar spectra (e.g. Barkana & Loeb 2005) and a 10% efficiency of conversion of gas into stars. The X-ray luminosity of galaxies follows a power law shape with a lower limit of 300 eV (e.g. Madau et al. 2004), and an X-ray efficiency corresponding to 2 X-ray photons per stellar baryon. Similar models, inspired by lower-redshift X-ray binary-dominated star-burst galaxies, have been explored in prior analytic studies (e.g. Furlanetto 2006; Pritchard & Furlanetto 2007).
- 2.
extreme (bottom panel): Galaxies hosting UV and X-ray sources reside in more massive halos, similar to ones observed at moderate redshifts (e.g. Labbe et al. 2010) and which are more resilient to feedback effects (e.g. Springel & Hernquist 2003; Mesinger & Dijkstra 2008; Okamoto, Gao & Theuns 2008). These galaxies have virial temperatures K, corresponding to halo masses of at . Interestingly, in this case Ly pumping is dominated by the X-ray excitation of HI, and has a very different spatial signature from the fiducial model. The X-ray luminosity of galaxies also follows a power law shape, but with a more energetic lower limit of 900 eV (corresponding to heavy obscuration, e.g. Lutovinov et al. 2005), and an X-ray efficiency corresponding to 4000 X-ray photons per stellar baryon. This scenario is considered “extreme” since the X-ray sources dominate reionization and saturate the unresolved soft X-ray background (Hickox & Markevitch 2007; Mesinger, Ferrara & Spiegel 2012).
Both scenarios are consistent with the WMAP7 constraints on at 2 (Komatsu et al., 2011). Notice that the values of computed in Section 3.2 represent an upper limit and are not self-consistent with the contribution to from the astrophysical sources modelled by 21cmFAST . On the other hand the DM models with the thermal cross-section are fully consistent since they only contribute negligibly to .
It is obvious from Fig. 3 that the fundamental epochs in cosmic evolution show very different 21cm signatures in the two models: spin temperature (WF) coupling (black yellow); X-ray heating of the IGM (yellow blue); reionization (blue black). Here we focus on the global HI 21 cm signal as a way to constrain DM and save spatial signature for future work.
4 Results
We present here the results obtained for the three DM models introduced in Sec. 2, each with two values for the annihilation cross : the standard thermal value, and the maximum allowed by CMB constraints as described in Sec 3.2. We solve the evolution equations of the kinetic temperature and ionized fraction of the IGM for each of these DM candidates using the fractional energy depositions from the code MEDEA2 and use a prescription for the formation of collapsed sources of radiation from the publicly available code 21cmFAST , that allows us to include consistently X-ray heating, ionization and Ly pumping from galaxies.
In Fig. 4 we compare the effects produced on by our annihilating DM candidates. To keep the figure simple we don’t plot the modified curves, corresponding to the annihilating DM cases. However the behavior is simple: the kinetic temperature at high redshift increases because of the high density of DM and the corresponding higher chance of annihilations. As the Universe expands and its content is diluted simply settles on a slightly higher adiabat. When the Ly pumping becomes efficient at , then perfectly tracks , which increases sharply at .


The additional heating from annihilating DM particles drives closer to for . Therefore we can expect a reduction of the absorption feature of the homogeneous 21 cm background in that redshift range. A larger thermally averaged cross-section corresponds to stronger effects on for an annihilating DM candidate of a given mass. At the same time, heavier DM candidates deposit their energy into the IGM less efficiently (see Evoli et al. 2012b), therefore given a certain value of the lower mass DM candidate will generally produce larger deviations on . The effects are much more evident at : galaxies start to form and quickly drive to values high enough for efficient Ly pumping. As a consequence decreases sharply tracking at a time when the combined heating from DM annihilations and from galaxies is still not sufficient to heat the gas above . Eventually the same heating sources make . The different models in the upper and lower panels of Fig. 4 show different behaviors since in the ”extreme” case Ly coupling is achieved later, and the heating starts earlier, making the region at in which both shallower (in K) and narrower (in redshift).
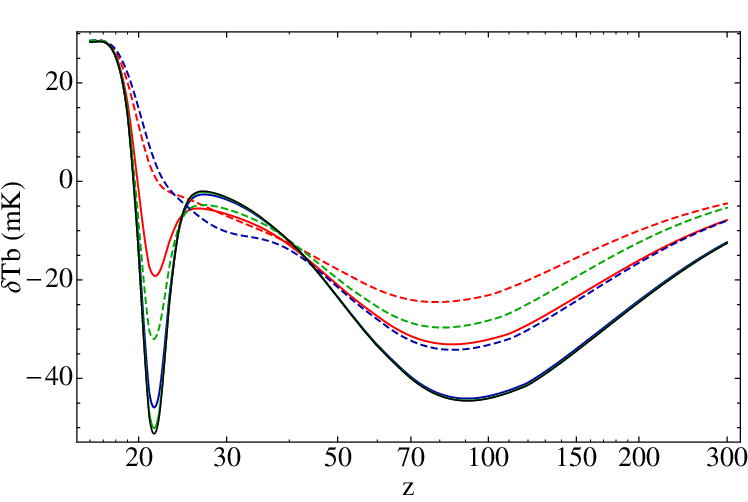
This is reflected directly on the behavior of , shown in the panels of Fig. 5, for which we give a quantitative analysis case by case. A summary of the results is available in Table 2.
4.1 10 GeV Bino
The lightest considered DM candidate, the 10 GeV Bino, produces the largest signature in the ”fiducial” model (top panel of Fig. 5), both when assuming a standard thermal cross section (solid red curves in Fig. 5) and when taking into account the maximum cross section allowed by CMB data, in this case (dashed red curves). In the first case the signal is mK on a redshift range , with a peak of mK at , and is much more substantial for the second absorption feature at , with a deviation with respect to the standard case in which DM does not annihilate (which we denote hereafter ) of mK, a large signal at frequencies MHz. The effect is enhanced essentially by a factor two for the higher allowed annihilation cross section and reaches values of mK at , while the second absorption feature at lower redshift is essentially erased, with the IGM appearing in even emission already by . These very large signals, both for and for could be detected by future radio observations (see Section 4.5). In the ”extreme” model case (bottom panel) the DM signature before the first astrophysical sources turn on () is obviously identical to the ”fiducial” model case. The second absorption feature instead changes substantially and is both shallower, with a minimum value of mK at , and narrower in redshift at . This reflects on the DM signal: when assuming (), mK at .
4.2 200 GeV Wino
The case of the 200 GeV Wino, described by the blue curves in Fig. 5 produces less evident deviations: assuming we can see no effect on the as the solid green line is virtually coincident with the solid black line for both reionization models. Obviously this translates into a constant , with no chances of direct detection. On the other hand the case shows a mK for and a massive deviation at that practically erases the second absorption feature and drives the signal to emission already at . This behavior is present for both the fiducial and extreme reionization models.

4.3 1 TeV Leptophilic
Our most massive candidate, the heavy DM particle of rest mass 1 TeV that pair annihilates into leptons, is the one that produces by far the smallest deviations on the HI 21 cm background: for deviations are negligible while for the maximum allowed cross section, in this case , they reach mK in the range and 65 (25) mK at for the fiducial (extreme) reionization models.
As mentioned previously, the fractional increase in the DM signal for the two heavier candidates assuming rather than is larger than what found for the 10 GeV Bino, due to our choice for the heavier DM particles of a smaller minimum sub-halo mass M⊙.
4.4 Isolating the DM annihilation signal
4.4.1 Degeneracy with astrophysics
Although the additional heat input from DM annihilation is easy to isolate in the well-understood epoch of the Dark Ages (before the first astrophysical sources, 30--50), the Earth’s ionosphere makes observations of such high redshifts very challenging (though there are a couple of non-terrestrial radio telescopes being considered, such as DARE and the Lunar Radio Array1010 10 http://lunar.colorado.edu/lowfreq/, LRA). The lower-redshift signal at is easier to observe; however in this case the DM annihilation heating must be disentangled from uncertainties in astrophysics. This is evident when comparing the top and bottom panels of Fig. 5. In the “extreme” model in the lower panel the emission from astrophysical sources produces a much shallower absorption feature, and the black solid line could be confused with the red solid line (corresponding to the case of 10 GeV Bino annihilations with ) in the upper panel. Therefore detecting a mK global absorption signal at could be an indication of 10 GeV DM annihilations or of a strong X-ray emission by primordial galaxies. Notice however that the X-ray emission can be constrained in several ways, e.g. by tighter constraints on the unresolved soft X-ray background of or by a study of the topology of the HII regions once the future radio interferometers start probing the tomography of the IGM beyond the EoR. Unfortunately, both of these observations are only indirect. The soft X-ray background at only constrains the high-energy component of the source’s spectrum ( 20–40 keV at ), which does not interact with the IGM (e.g. McQuinn 2012). Likewise, the EoR at could probe a different source population than was present at (e.g. Ricotti & Ostriker 2004). Nonetheless, if an upper limit is given to the efficiency of the X-ray emission by primordial galaxies a strong reduction of the depth of the absorption feature would be a clear indication of DM annihilations.
4.4.2 DM signal gradient
It is interesting to notice that purely by coincidence galaxies and DM annihilations start to heat the IGM at about the same redshift in these models even though the processes are entirely different and driven by structures with different mass. As previously mentioned, galaxies with mass M⊙ ( M⊙) are responsible for most of the astrophysical X-ray heating at for the ”fiducial” (”extreme”) reionization model. On the other hand the function in Eq. 3 peaks strongly for substructures M⊙ at the same redshift, as we show in Fig. 7. The difference in the collapsed fraction above these disparate mass scales is made up by the coefficients in the heating rates. In Fig. 6 we present the heating rates per baryon for 10 GeV DM annihilations () and for galactic X-ray heating () for the fiducial reionization model, compared with the adiabatic cooling rate (see Eq. 7). Notice that the heating rate from astrophysical sources of X-rays is much steeper than the DM heating, but they become dominant over the adiabatic cooling at about the same redshift. We also plot the heating rate relative to 200 GeV DM annihilations to show that the slope is similar for different DM candidates.
These differences in the slope are easy to understand: the fractional increase of the collapsed fraction in halos which drive the DM heating is much slower than the fractional increase in the high-end tail of the mass function (i.e. the halos which host the first galaxies). This difference is fundamental, and presents an unambiguous way of disentangling heating from astrophysics and heating from DM.
We quantify this further with the dotted red line in the upper panel of Fig. 5. This curve corresponds to the case of annihilating 10 GeV Binos with , keeping the Ly pumping due to stellar sources but switching-off astrophysical X-ray heating, which could indeed take place at lower redshifts. The increase of at ( MHz) here is only due to heating from DM annihilations: the different slope could be a clear indication of DM heating.
In the bottom panel of Fig. 8 we further investigate the difference in slope between the DM and galactic heating and compare them with the standard scenario in which DM does not annihilate. We study the gradient of the signal with frequency, i.e. in mKMHz, for the 10 GeV Bino, assuming the standard thermal annihilation cross and the fiducial reionization model, and keeping (solid line) or switching off (dotted line) the heating from astrophysical sources. We choose the 10 GeV particle because it is the most promising candidate since it produces a strong signal at with , and we assume the ”fiducial” model because in the ”extreme” case the X-rays drive the heating and ionization of the IGM and produce with secondary interactions the Ly flux that couples to , therefore it would be incorrect to keep the Ly pumping and switch off the heating since they are driven by the same sources.


.
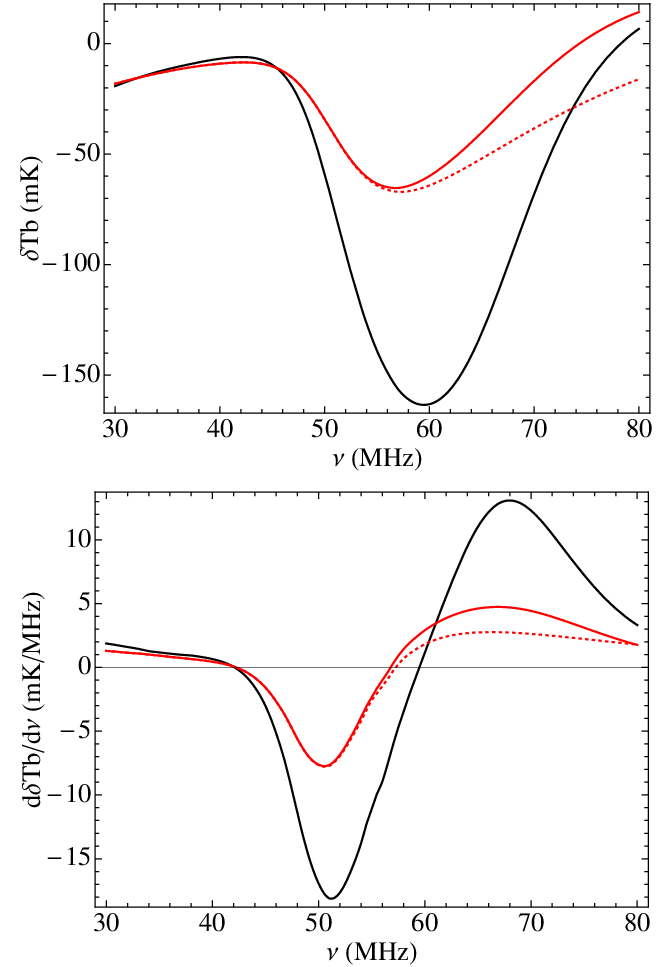
It is evident from the figure that the inclusion of DM heating confines the slope to mKMHz (red curves), whereas without DM heating the slope reaches values of mKMHz. This slope would only increase if rarer (more massive) galaxies drive X-ray heating (such as in the “extreme” model). The detection of such a small peak gradient ( few mKMHz) could provide clear evidence of DM annihilation.
Including the effects of star formation in smaller sized mini-halos would not alter things significantly, since the fractional increase of the collapsed fraction in mini-halos is still much steeper than that relative to the sub-halos responsible for the DM heating. In principle, a scenario in which the star formation efficiency within the halos decreases in time (for instance by feedback mechanisms), could reduce the gradient . By arbitrarily adjusting the efficiency with time it is possible to perfectly mimic the slower DM heating, however it is unclear how to physically motivate such a rapidly declining star formation efficiency with time. We will explore this aspect in future work.
4.5 Observational perspectives
We find that the most promising of our annihilating DM candidates produce a strong deviation in the HI 21 cm line mainly in two redshift ranges: (i) (corresponding to MHz) with a DM signal mK; (ii) ( MHz), where the absorption feature produced by galaxies is strongly suppressed, producing a signal mK depending on the DM particle.
The first high redshift signature is at MHz, a frequency too low to be observed by ground based radio interferometers due to the severe distortions produced by terrestrial ionosphere, which at frequencies MHz is known to make any observation virtually impossible. Recently a new generation of space or Moon based radio interferometers able to probe the Dark Ages at very low frequencies has been proposed, such as the Dark Ages Lunar Interferometer (DALI, Lazio et al. 2007), the Lunar Radio Array (LRA, Lazio et al. 2009) and the Dark Ages Radio Explore (DARE, Burns et al. 2012). These instruments, if approved and built, would be located on the dark side of the Moon, overcoming two major hurdles of low frequency radio observations, i.e. radio-frequency interference (RFI) from human-generated radio signals, and ionospheric distortions. They could therefore probe the Dark Ages up to .
The second signature at MHz could be observed by current or planned radio observatories. We focus here on some of the main experiments.
The LOw Frequency ARray (LOFAR), based in the Netherlands, has two observational bands, a low band (30-85 MHz) and a high band (115-230 MHz). The high band array is the one that will be devoted to the EoR experiment, measuring the redshifted HI 21 cm radiation at with a resolution of 3 arcminutes on a field of view of 120 square degrees (Zaroubi 2012). The low band array probes the frequencies at which the DM signal is stronger, however the detection of HI 21 cm signals at such low frequencies will be beyond reach because of a substantial drop in sensitivity (see e.g. Zaroubi 2010 and references therein).
The Murchison Widefield Array (MWA), located in the radio-quiet Western Australia Outback, will observe at frequencies from 80 to 300 MHz and therefore misses the frequency bands in which a DM signal could be detected.
The Square Kilometer Array (SKA) which is planned to be completed in 2024 in Australia, New Zealand and South Africa, will probe a frequency range from 70 MHz to 10 GHz. The antenna elements that will make up the ”SKA-low” array will cover the frequency range MHz and will achieve a sensitivity an order of magnitude higher than previous experiments. The design is still preliminary and the telescope is at least a decade away from being fully operational, however SKA could detect a DM signal in the HI 21 cm line, if frequencies down to 70 MHz or lower will be probed.
The main scientific goal of the aforementioned interferometers is however to measure the spatially fluctuating components of the HI 21 cm signal. On the other hand the detection of the angularly averaged all-sky signal could be performed by a single dipole, the main challenge being a precise enough calibration to extract the signal from the backgrounds. This simpler and lower cost alternative is explored by instruments such ad EDGES and the Cosmological Reionization Experiment (CoRE, Chippendale 2009), while more advanced second generation instruments such as the Large-aperture Experiment to Detect the Dark Ages (LEDA) are under construction. A Moon orbiting space observatory such as the Dark Ages Radio Experiment (DARE) seems to be a viable option in the near future, in contrast with the much more complex and expensive task of placing a large interferometer on the dark side of the Moon (DALI, LRA).
The Experiment to Detect the Reionization Step (EDGES) located at the Murchison Radio-astronomy Observatory in Western Australia, measured the radio spectrum between 100 and 200 MHz with all systematic trends in the measurement reduced to below 75 mK, and allowed to exclude a rapid reionization timescale of at the 95% confidence level. The EDGES team will attempt in the next few years to reduce the systematics of over one order of magnitude and to push observations up to (see e.g. Bowman & Rogers 2010; McQuinn 2010; Pritchard & Loeb 2010).
One of the most promising instruments for the detection of a DM signal from the Dark Ages is the Large-Aperture Experiment to Detect the Dark Ages (LEDA), a proposed array that will cover a band MHz and that will feature array-based calibration to improve the accuracy of foreground subtraction from the total-power signal (Greenhill & Bernardi, 2012). The fact that LEDA is optimized for the detection of the all-sky HI 21 cm signal together with its low frequency capabilities make it the ideal ground based instrument to detect the HI 21 cm deviations induced by DM annihilations.
5 Summary and conclusions
| mass [GeV] | model | Peak [mK] | |
|---|---|---|---|
| 200 | fiducial | 15 mK at | |
| 200 | fiducial | 160 mK at | |
| 200 | extreme | 5 mK at | |
| 200 | extreme | 45 mK at | |
| 10 | fiducial | 100 mK at | |
| 10 | fiducial | 160 mK at | |
| 10 | extreme | 30 mK at | |
| 10 | extreme | 45 mK at | |
| 1000 | fiducial | 2 mK at | |
| 1000 | fiducial | 65 mK at | |
| 1000 | extreme | 0.5 mK at | |
| 1000 | extreme | 25 mK at |
We consider three of the most popular annihilating DM candidates as sources of X-ray, ionizing and Ly radiation: thanks to our detailed Monte Carlo treatment MEDEA2 we computed their energy deposition into the IGM as a function of redshift and ionized fraction. We were then able to calculate precisely and fully consistently the effects of the energy release from DM annihilations on the IGM thermal history and, ultimately, the imprint on the HI 21 cm line at . For each DM candidate we compute with a modified version of the publicly available code CAMB the deviations produced by each DM model on the CMB power spectrum. This allows us to select two values for the thermally averaged annihilation cross section, the standard thermal case and the maximum value that produces deviations in the CMB power spectrum within of the WMAP 7 results. We combine each DM model with two prescriptions for radiation from astrophysical sources (computed with the public code 21cmFAST ). We investigate how the formation of luminous sources affects the imprint of DM annihilations on the IGM, and study ways to disentangle the DM signal in this realistic scenario.
Finding a strong deviation in the absorption feature in the all-sky averaged at will be a clear sign of energy release by DM during a cosmic phase in which no collapsed sources of radiation have yet formed. However it is even more interesting to study the joint effects of energy injection into the IGM from galaxies and DM annihilations at , as we find that the Ly flux from the first luminous sources combined with the early heating from DM annihilations produces strong deviations in the HI 21 cm signal at a redshift range which could be realistically probed by future radio observations in the next few years. Next generation radio facilities such as DALI, LRA or DARE would certainly have ideal characteristics for the detection of a DM signal, but even current or already funded instruments such as MWA, LOFAR and in particular SKA and LEDA would achieve the sensitivity to probe a mK at MHz, if these frequencies will be observed by their final designs and assuming that the strategies for foreground removal and ionospheric corrections will be successful.
We summarize our results as follows.
- •
DM annihilation signal.
(i) Our least massive DM candidate, the 10 GeV Bino like neutralino, produces a large signal in the ”fiducial” model, both when assuming the standard thermal cross section and when taking into account the maximum cross section allowed by CMB data, . In the first case the DM 21 cm signal is of the order of mK on a redshift range while mK at , with the peak signal occurring at a frequency MHz. Assuming the higher annihilation cross section increases and totally erases the second absorption feature at , the lack of which represents a very strong - and detectable - DM signature. For the ”extreme” reionization model we find in general a smaller signal with a peak mK at assuming ().
(ii) The annihilating 200 GeV Wino produces very different results depending on the assumption of a thermal or maximal value. In the first case is negligible except for a weak signal mK at . In the second case instead mK at and the second absorption feature driven by Ly coupling from stars is almost completely erased. For the extreme case we find a peak signal mK at for (). (iii) The results for our most massive candidate, the heavy DM particle of rest mass 1 TeV that pair annihilates into leptons, are the least promising, with a negligible signal under the assumption of , and a mK at . For the extreme case we find a peak signal mK at for ().We summarize our results in Table 2.
- •
Strategies to isolate the DM signal.
We find that some of our results for a specific DM model working in the framework of the ”fiducial” reionization model (e.g. the case of 10 GeV annihilations assuming ) are hard to distinguish from the standard signal assuming the ”extreme” reionization history. However when we study the heating rates per baryon for 10 GeV DM annihilations () and for galactic X-ray heating () we notice that the heating rate from astrophysical sources of X-rays evolves much quicker than the DM heating, since the fractional increase of the collapsed fraction in halos which drive the DM heating is much slower than the fractional increase of the halos which host the first galaxies. This crucial difference presents us with a clean way of disentangling heating by DM annihilations from heating by galaxies. To better quantify this point we study the case of annihilating 10 GeV Binos with , keeping the Ly pumping due to stellar sources but switching-off astrophysical X-ray heating, which could indeed take place at lower redshifts without breaking any current observational constraints. By coincidence starts increasing at ( MHz), same as the case in which source heating is taken into account, however DM heating happens with a different slope. We therefore study the gradient of the signal as a function of frequency, , and find that when neglecting DM heating the slope reaches values of mKMHz, while in the case in which DM annihilations are taken into account the slope is confined to a considerably smaller mKMHz. Although it is possible in principle to mimic the slower DM heating by arbitrarily reducing the star formation efficiency with time, it is unclear whether such an ”ad-hoc” model could be physically motivated, and we defer this for future analysis. We can therefore conclude that the detection of a small peak gradient ( few mKMHz) will be a strong evidence of DM annihilation, an exciting prospect that could become reality in the next few years thanks to a new generation of radio instruments such as LEDA and DARE, optimized for the detection of the global HI 21 cm signal during the Dark Ages.
Acknowledgments
We thank J. Chluba and M. Mapelli for their help in using the numerical codes. CE acknowledges a visiting grant from SNS where part of this work has been carried out, and support from the Helmholtz Alliance for Astro-particle Physics funded by the Initiative and Networking Fund of the Helmholtz Association. NY acknowledges the financial support by the Grants-in-Aid for Young Scientists (S) 20674003 by the Japan Society for the Promotion of Science.
References
- Aalseth et al. (2011a) Aalseth C. E. et al., 2011a, Physical Review Letters, 106, 131301
- Aalseth et al. (2011b) —, 2011b, Physical Review Letters, 107, 141301
- Abdo et al. (2010) Abdo A. A. et al., 2010, Physical Review Letters, 104, 101101
- Aprile et al. (2011) Aprile E. et al., 2011, Physical Review Letters, 107, 131302
- Barkana & Loeb (2005) Barkana R., Loeb A., 2005, ApJ, 626, 1
- Berg et al. (2009) Berg M., Edsjö J., Gondolo P., Lundström E., Sjörs S., 2009, JCAP, 8, 35
- Bergström, Edsjö & Zaharijas (2009) Bergström L., Edsjö J., Zaharijas G., 2009, Physical Review Letters, 103, 031103
- Bernabei et al. (2008) Bernabei R. et al., 2008, European Physical Journal C, 56, 333
- Bernabei et al. (2010) —, 2010, European Physical Journal C, 67, 39
- Bernabei et al. (2004) —, 2004, arXiv:astro-ph/0405282
- Bertone et al. (2012) Bertone G., Cerdeño D. G., Fornasa M., Pieri L., Ruiz de Austri R., Trotta R., 2012, Phys. Rev. D, 85, 055014
- Bowman, Morales & Hewitt (2006) Bowman J. D., Morales M. F., Hewitt J. N., 2006, ApJ, 638, 20
- Bowman & Rogers (2010) Bowman J. D., Rogers A. E. E., 2010, Nature, 468, 796
- Bringmann (2009) Bringmann T., 2009, New Journal of Physics, 11, 105027
- Burns et al. (2012) Burns J. O. et al., 2012, Advances in Space Research, 49, 433
- CDMS II Collaboration et al. (2010) CDMS II Collaboration et al., 2010, Science, 327, 1619
- Chen, Takahashi & Yanagida (2009) Chen C., Takahashi F., Yanagida T. T., 2009, Physics Letters B, 673, 255
- Chen & Kamionkowski (2004) Chen X., Kamionkowski M., 2004, Phys. Rev. D, 70, 043502
- Chippendale (2009) Chippendale A. P. ., 2009, PhD thesis, CSIRO Astronomy and Space Science
- Chluba (2010) Chluba J., 2010, MNRAS, 402, 1195
- Ciafaloni et al. (2011) Ciafaloni P., Comelli D., Riotto A., Sala F., Strumia A., Urbano A., 2011, JCAP, 3, 19
- Cirelli, Franceschini & Strumia (2008) Cirelli M., Franceschini R., Strumia A., 2008, Nuclear Physics B, 800, 204
- Cirelli, Iocco & Panci (2009) Cirelli M., Iocco F., Panci P., 2009, JCAP, 10, 9
- Cirelli et al. (2009) Cirelli M., Kadastik M., Raidal M., Strumia A., 2009, Nuclear Physics B, 813, 1
- di Bernardo et al. (2011) di Bernardo G., Evoli C., Gaggero D., Grasso D., Maccione L., Mazziotta M. N., 2011, Astroparticle Physics, 34, 528
- Evoli et al. (2012a) Evoli C., Cholis I., Grasso D., Maccione L., Ullio P., 2012a, Phys. Rev. D, 85, 123511
- Evoli et al. (2012b) Evoli C., Valdés M., Ferrara A., Yoshida N., 2012b, MNRAS, 422, 420
- Field (1959) Field G. B., 1959, ApJ, 129, 536
- Finkbeiner et al. (2012) Finkbeiner D. P., Galli S., Lin T., Slatyer T. R., 2012, Phys. Rev. D, 85, 043522
- Furlanetto (2006) Furlanetto S. R., 2006, MNRAS, 371, 867
- Furlanetto, Oh & Briggs (2006) Furlanetto S. R., Oh S. P., Briggs F. H., 2006, Phys. Rep., 433, 181
- Furlanetto, Oh & Pierpaoli (2006) Furlanetto S. R., Oh S. P., Pierpaoli E., 2006, Phys. Rev. D, 74, 103502
- Galli et al. (2009) Galli S., Iocco F., Bertone G., Melchiorri A., 2009, Phys. Rev. D, 80, 023505
- Galli et al. (2011) —, 2011, Phys. Rev. D, 84, 027302
- Gilfanov, Grimm & Sunyaev (2004) Gilfanov M., Grimm H.-J., Sunyaev R., 2004, MNRAS, 347, L57
- Grajek et al. (2009) Grajek P., Kane G. L., Phalen D. J., Pierce A., Watson S., 2009, Phys. Rev. D, 79, 043506
- Greenhill & Bernardi (2012) Greenhill L. J., Bernardi G., 2012, arXiv:1201.1700
- Hickox & Markevitch (2007) Hickox R. C., Markevitch M., 2007, ApJL, 661, L117
- Hirata (2006) Hirata C. M., 2006, MNRAS, 367, 259
- Hooper & Tait (2009) Hooper D., Tait T. M. P., 2009, Phys. Rev. D, 80, 055028
- Jenkins et al. (2001) Jenkins A., Frenk C. S., White S. D. M., Colberg J. M., Cole S., Evrard A. E., Couchman H. M. P., Yoshida N., 2001, MNRAS, 321, 372
- Kane, Lu & Watson (2009) Kane G., Lu R., Watson S., 2009, Physics Letters B, 681, 151
- Kassim et al. (2004) Kassim N. E., Lazio T. J. W., Ray P. S., Crane P. C., Hicks B. C., Stewart K. P., Cohen A. S., Lane W. M., 2004, P&SS, 52, 1343
- Komatsu et al. (2009) Komatsu E. et al., 2009, ApJS, 180, 330
- Komatsu et al. (2011) —, 2011, ApJS, 192, 18
- Labbe et al. (2010) Labbe I., et al., 2010, ApJL, 708, L26
- Lazio et al. (2009) Lazio J., Carilli C., Hewitt J., Furlanetto S., Burns J., 2009, in Society of Photo-Optical Instrumentation Engineers (SPIE) Conference Series, Vol. 7436, Society of Photo-Optical Instrumentation Engineers (SPIE) Conference Series
- Lazio et al. (2007) Lazio T. J. W. et al., 2007, in Bulletin of the American Astronomical Society, Vol. 39, American Astronomical Society Meeting Abstracts
- Lewis & Challinor (2011) Lewis A., Challinor A., 2011, in Astrophysics Source Code Library, record ascl:1102.026, p. 2026
- Linden, Profumo & Anderson (2010) Linden T., Profumo S., Anderson B., 2010, Phys. Rev. D, 82, 063529
- Liu et al. (2010) Liu J., Yuan Q., Bi X., Li H., Zhang X., 2010, Phys. Rev. D, 81, 023516
- Lutovinov et al. (2005) Lutovinov A., Revnivtsev M., Gilfanov M., Shtykovskiy P., Molkov S., Sunyaev R., 2005, A&A, 444, 821
- Madau, Meiksin & Rees (1997) Madau P., Meiksin A., Rees M. J., 1997, ApJ, 475, 429
- Madau et al. (2004) Madau P., Rees M. J., Volonteri M., Haardt F., Oh S. P., 2004, ApJ, 604, 484
- Mapelli, Ferrara & Pierpaoli (2006) Mapelli M., Ferrara A., Pierpaoli E., 2006, MNRAS, 369, 1719
- McQuinn (2010) McQuinn M., 2010, in Astronomical Society of the Pacific Conference Series, Vol. 432, New Horizons in Astronomy: Frank N. Bash Symposium 2009, Stanford L. M., Green J. D., Hao L., Mao Y., eds., p. 65
- McQuinn (2012) —, 2012, arXiv:1206.1335
- Mesinger & Dijkstra (2008) Mesinger A., Dijkstra M., 2008, MNRAS, 390, 1071
- Mesinger, Ferrara & Spiegel (2012) Mesinger A., Ferrara A., Spiegel D. S., 2012, arXiv:1210.7319
- Mesinger & Furlanetto (2007) Mesinger A., Furlanetto S., 2007, ApJ, 669, 663
- Mesinger, Furlanetto & Cen (2011) Mesinger A., Furlanetto S., Cen R., 2011, MNRAS, 411, 955
- Mesinger, McQuinn & Spergel (2012) Mesinger A., McQuinn M., Spergel D. N., 2012, MNRAS, 422, 1403
- Mineo, Gilfanov & Sunyaev (2012) Mineo S., Gilfanov M., Sunyaev R., 2012, MNRAS, 419, 2095
- Mirabel et al. (2011) Mirabel I. F., Dijkstra M., Laurent P., Loeb A., Pritchard J. R., 2011, A&A, 528, A149
- Natarajan & Schwarz (2009) Natarajan A., Schwarz D. J., 2009, Phys. Rev. D, 80, 043529
- Okamoto, Gao & Theuns (2008) Okamoto T., Gao L., Theuns T., 2008, MNRAS, 390, 920
- Peterson, Pen & Wu (2005) Peterson J. B., Pen U., Wu X., 2005, in Astronomical Society of the Pacific Conference Series, Vol. 345, From Clark Lake to the Long Wavelength Array: Bill Erickson’s Radio Science, Kassim N., Perez M., Junor W., Henning P., eds., p. 441
- Press & Schechter (1974) Press W. H., Schechter P., 1974, ApJ, 187, 425
- Pritchard & Furlanetto (2007) Pritchard J. R., Furlanetto S. R., 2007, MNRAS, 376, 1680
- Pritchard & Loeb (2008) Pritchard J. R., Loeb A., 2008, Phys. Rev. D, 78, 103511
- Pritchard & Loeb (2010) —, 2010, Phys. Rev. D, 82, 023006
- Profumo (2012) Profumo S., 2012, Central European Journal of Physics, 10, 1
- Reichardt et al. (2011) Reichardt C. L. et al., 2011, arXiv:1111.0932
- Ricotti & Ostriker (2004) Ricotti M., Ostriker J. P., 2004, MNRAS, 352, 547
- Shchekinov & Vasiliev (2007) Shchekinov Y. A., Vasiliev E. O., 2007, MNRAS, 379, 1003
- Sheth & Tormen (1999) Sheth R. K., Tormen G., 1999, MNRAS, 308, 119
- Shull et al. (2012) Shull J. M., Harness A., Trenti M., Smith B. D., 2012, ApJ, 747, 100
- Slatyer, Padmanabhan & Finkbeiner (2009) Slatyer T. R., Padmanabhan N., Finkbeiner D. P., 2009, Phys. Rev. D, 80, 043526
- Springel & Hernquist (2003) Springel V., Hernquist L., 2003, MNRAS, 339, 312
- The Planck Collaboration (2006) The Planck Collaboration, 2006, arXiv:astro-ph/0604069
- Valdés & Ferrara (2008) Valdés M., Ferrara A., 2008, MNRAS, 387, L8
- Valdés et al. (2007) Valdés M., Ferrara A., Mapelli M., Ripamonti E., 2007, MNRAS, 377, 245
- van den Aarssen, Bringmann & Goedecke (2012) van den Aarssen L. G., Bringmann T., Goedecke Y. C., 2012, arXiv:1202.5456
- Wouthuysen (1952) Wouthuysen S. A., 1952, AJ, 57, 31
- Wyithe, Loeb & Barnes (2005) Wyithe J. S. B., Loeb A., Barnes D. G., 2005, ApJ, 634, 715
- Zahn et al. (2011) Zahn O., Mesinger A., McQuinn M., Trac H., Cen R., Hernquist L. E., 2011, MNRAS, 414, 727
- Zaroubi (2010) Zaroubi S., 2010, arXiv:1002.2667
- Zaroubi (2012) —, 2012, arXiv:1206.0267