Charged particle jet measurements with the ALICE experiment in proton-proton collisions at the LHC
Abstract
We present preliminary results of measurements of charged particle jet properties in proton-proton collisions at = 7 TeV using the ALICE detector. Jets are reconstructed using and SISCone jet finding algorithms with resolution parameter in the range of transverse momentum from 20 to 100 GeV/ in the midrapidity region ( 0.5). The uncorrected charged jet spectra obtained using the three different jet finders show good agreement. The data are compared to predictions from PYTHIA-Perugia0, PYTHIA-Perugia2011, and PHOJET. The mean charged particle multiplicity in leading jets increases with increasing jet and is consistent with model predictions. The radial distributions of transverse momentum about the jet direction and the distributions of the average radius containing 80% of the total jet found in the jet cone ( in this analysis), indicate that high jets are more collimated than low jets.
1 Introduction
Jets are collimated sprays of particles originating from the fragmentation of hard scattered partons (quarks and gluons) produced in pp (or A–A) collisions [2]. As such, jets serve as a proxy for the high partons produced in elementary hard scatterings. In pp collisions, they provide a unique tool to test perturbative quantum chromodynamics (pQCD) [3]. Measurements of jet shapes in particular, provide the details of the jet fragmentation process [2]. Jet shapes are also sensitive to the type of partons (quarks or gluons) that fragment into hadrons. In addition, measurements in pp collisions provide a baseline for similar measurements in more complex A–A collisions where various nuclear effects are expected to take place. Jet shape observables have previously been measured by the CDF [4, 5, 6] and D0 [7] collaborations in collisions and more recently by the ATLAS [8] and CMS [9] collaborations in pp collisions at = 7 TeV. In this paper we report preliminary results of charged particle jet properties measured by A Large Ion Collider Experiment (ALICE) in pp collisions at = 7 TeV.
2 Data analysis
The data used in this analysis were collected during the Large Hadron Collider (LHC) [10, 11] run in the year 2010 with the ALICE detector [12]. The main detector subsystems used for tracking are the Time Projection Chamber (TPC) [13] and the Inner Tracking System (ITS) [14]. The V-ZERO (V0) counters [15] and the ITS are used for online trigger to select the minimum bias events. Only events with primary vertex within 10 cm along the beam axis from the nominal interaction point are analyzed to ensure uniform acceptance in pseudo-rapidity () and minimize the need for complex acceptance corrections. This analysis is based on 161 M minimum bias events. Tracks are reconstructed using combined information from the TPC and the ITS. These tracks have uniform high tracking efficiency for charged particles, good momentum resolution and uniform distribution. Tracks are included in the analysis if 0.150 GeV/ and 0.9.
3 Jet reconstruction method and observable definitions
Charged particle jets are reconstructed using the sequential recombination algorithms anti- [16] and [17, 18, 19] from the FastJet package [20] and a seedless infrared-safe cone based SISCone [21] algorithm. Jets are reconstructed with the resolution parameter . Only jets within 0.5 and in the transverse momentum range from 20 to 100 GeV/ are considered in this analysis. The jet properties are measured for leading jets only i.e. the jet with the highest in each event. The jet shape observables studied in this analysis are defined in the following subsections.
3.1 Charged particle multiplicity in leading jet
The charged particle multiplicity of the leading jet is defined as the number of charged particles within the jet cone. The mean is computed in bins of the jet .
3.2 Leading charged jet size
The size of the jet, , is defined as the radius in space that contains 80% of the total transverse momentum found in the jet cone ( in this analysis). We report the mean value of for leading jets as a function of jet .
3.3 Radial distribution of transverse momentum within the leading charged jet
We also study the distribution of transverse momentum within a leading charged jet as a function of distance from the jet direction. We construct annular regions as illustrated in Fig. 1 at given values. The scalar sum of the transverse momenta () of all charged particles produced in each annulus is calculated jet by jet as a function of distance . We report the mean value of this sum (Eq. 1) as a function of jet .

| (1) |
where, denotes the summed of all tracks inside the annular ring between and . is the radial width of the annulus. The analysis was carried out with = 0.02. denotes the total number of jets.
4 Instrumental effects and systematic uncertainties
We used a bin-by-bin correction procedure similar to those used by the CDF [5] and ATLAS [8] collaborations to correct the measured jet shape observables for detector effects. PYTHIA 6.4 [22] Monte Carlo (MC) with tune Perugia0 [23] describes the measured jet shapes reasonably well for and therefore is used for the correction. Correction factors are computed for each bin in jet . They are defined as the ratio between the jet shape observable at particle level to that at detector level in their respective jet bin as described by Eq. 2,
| (2) |
where, is the observable at particle level and is that at the detector level. Jet shape observables at particle level are obtained using MC jets at particle level. A full GEANT [24] simulation implementing the detector effects has been performed to obtain the observables at detector level. We have not corrected for underlying events (UE).
The main contributors to the systematic uncertainties are the uncertainties in efficiency and momentum resolution in the track reconstruction. These effects were estimated using MC (PYTHIA) events. Uncertainties on the measured observables are estimated by varying the efficiency and momentum resolution by 5% and 20% respectively.
5 Results
5.1 Comparative performance analysis of jet finders
Figure 2 (Top panel) shows the uncorrected transverse
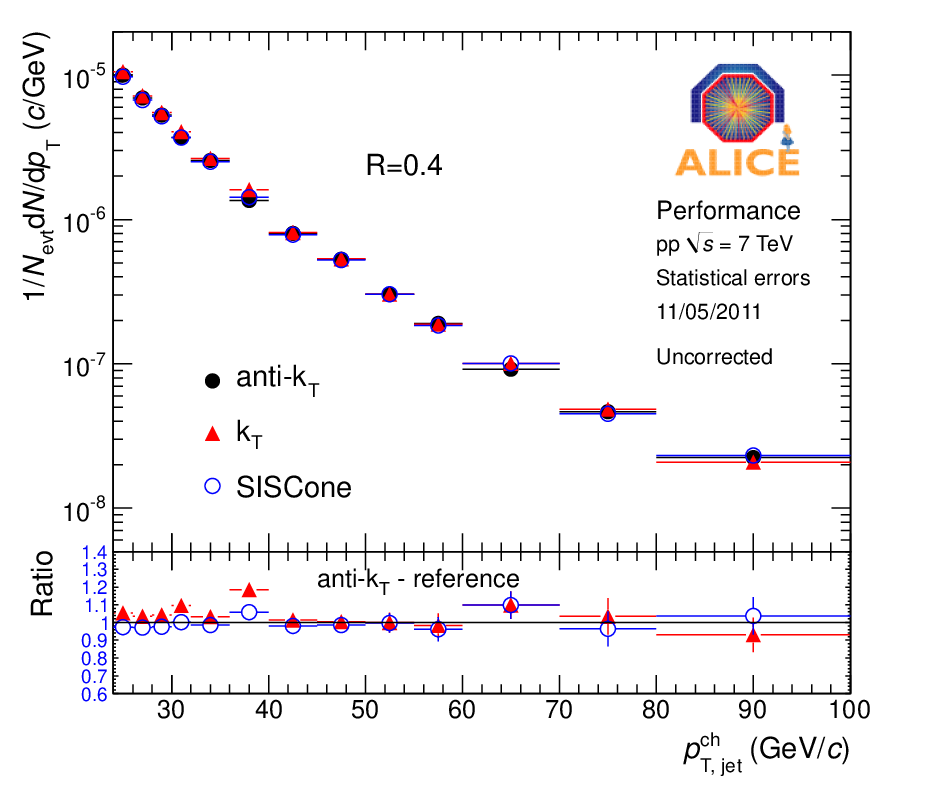
momentum distributions of charged particle jets obtained using the (filled black circles), (filled red triangles), and SISCone (open blue circles) jet finding algorithms with within 0.5, in the range of transverse momentum from 20 to 100 GeV/ for pp collisions at = 7 TeV. The ratios between the uncorrected yields obtained with the , and SISCone to that obtained with the anti- are shown in the bottom panel. We observe that the three different jet reconstruction algorithms agree well with each other at detector level.
5.2 Charged particle multiplicity in leading jet
The mean charged particle multiplicity ()

distributions for leading jets and their dependence on jet are shown in Fig.3. One observes that the mean charged multiplicity increases with increasing jet as expected based on prior measurements by the CDF [5] collaboration. This behavior is observed also in the MC predictions. The ratios of measured data to MC predictions suggest that models reproduce the data rather well.
5.3 Leading charged jet size

The distributions of the average radius () containing 80% of the total jet found in the jet cone () are shown in Fig. 4 as a function of jet . At low jet (20 GeV/), is contained in a very small cone of radius 0.16, which decreases further down to 0.08 for high jets (100 GeV/c).
5.4 Radial distribution of transverse momentum within the leading charged jet


Figure 5 shows the radial distributions of transverse momentum in the leading jet about the jet axis for jet between 20 to 30 GeV/ (left panel) and 60 to 80 GeV/ (right panel). It can be clearly seen in the figure that the transverse momentum density is largest near the jet axis and decreases with . The higher slop for this decrease in case of high jets (right panel) indicates that high jets are more collimated than low jets.
6 Conclusions
We reported preliminary measurements of charged particle jet properties in pp collisions at = 7 TeV using the ALICE detector. Jets were reconstructed using the , , and SISCone jet finding algorithms with resolution parameter in the range from 20 to 100 GeV/. A comparison between the uncorrected charged jet spectra obtained using three different jet finding algorithms show a good agreement. The mean charged particle multiplicity in the leading charged jet increases with increasing jet . Similar to the previous observations reported by the CDF [5] and ATLAS [8] collaborations, results on and show that high jets are more collimated than low jets. Predictions from simulations (PYTHIA-Perugia0, PYTHIA-Perugia2011, and PHOJET) describe the jet shape observables reasonably well.
References
References
- [1] ALICE Collaboration 2012 arXiv [nucl-ex/1207.0900]
- [2] Ellis S D, Kunszt Z and Soper D E 1992 Phys. Rev. Lett. 69 3615
- [3] Gross D J and Wilczek F 1973 Phys. Rev. D 8 3633
- [4] CDF Collaboration 1993 Phys. Rev. Lett. 70 713
- [5] CDF Collaboration 2001 Phys. Rev. D 65 092002
- [6] CDF Collaboration 2005 Phys. Rev. D 71 112002
- [7] D0 Collaboration 1995 Phys. Lett. B 357 500
- [8] ATLAS Collaboration 2011 Phys. Rev. D 83 052003
- [9] CMS Collaboration 2011 Jet transverse structure and momentum distribution in pp collisions at 7 TeV (Technical Report: CMS-PAS-QCD-10-014 CERN Geneva)
- [10] Pettersson T S (ed.) and Lefvre (ed.) P 1995 The Large Hadron Collider : conceptual design (CERN-AC-95-05 LHC)
- [11]
LHC Design Report Volume I+II+III 2004
(CERN-2004-003-V-1, CERN-2004-003-V-2, CERN-2004-003-V-3)
http://ab-div.web.cern.ch/ab-div/Publications/LHC-DesignReport.html - [12] ALICE Collaboration 2008 JINST 3 S08002
- [13] Alme J et al 2010 Nucl. Instrum. Meth. A 622 316-367
- [14] Aamodt K et al 2010 JINST 5 P03003
- [15]
ALICE Collaboration 2004
ALICE forward detectors: FMD, TO and VO: Technical Design Report
(CERN-LHCC-2004-025)
http://cdsweb.cern.ch/record/781854 - [16] Cacciari M, Salam G P and Soyez G 2008 JHEP 04 63
- [17] Catani S, Dokshitzer Y L, Seymour M H and Webber B R 1993 Nucl. Phys. B 406 187
- [18] Catani S, Dokshitzer Y L, Olsson M, Turnock G and Webber B R 1991 Phys. Lett. B 269 432
- [19] Ellis S D and Soper D E 1993 Phys. Rev. D 48 3160–3166
- [20] Cacciari M and Salam G P 2006 Phys. Lett. B 641 57-61
- [21] Salam G P and Soyez G 2007 JHEP 05 086
- [22] Sjostrand T, Mrenna S and Skands P Z 2006 JHEP 0605 026
- [23] Skands P Z 2010 Phys. Rev. D 82 074018
- [24] Brun R, Bruyant F, Maire M, McPherson A C and Zanarini P 1985 GEANT3 user guide, CERN data handling division (DD/EE/84-1)
- [25] Roesler S, Engel R and Ranft J 2000 The Monte Carlo event generator DPMJET-III (Lisbon 2000-Advanced Monte Carlo) 1033-1038 [hep-ph/0012252]