Asymmetry Dependence of the Nuclear Caloric Curve
Abstract
A basic feature of the nuclear equation of state is not yet understood: the dependence of the nuclear caloric curve on the neutron-proton asymmetry. Predictions of theoretical models differ on the magnitude and even the sign of this dependence. In this work, the nuclear caloric curve is examined for fully reconstructed quasi-projectiles around mass . The caloric curve extracted with the momentum quadrupole fluctuation thermometer shows that the temperature varies linearly with quasi-projectile asymmetry . An increase in asymmetry of 0.15 units corresponds to a decrease in temperature on the order of 1 MeV. These results also highlight the importance of a full quasi-projectile reconstruction in the study of thermodynamic properties of hot nuclei.
Keywords:
Caloric Curve , Temperature , Asymmetry , Equation of StatePACS
21.65.Ef, 25.70.Lm, 25.70.Mn, 25.70.Pq1 Introduction
The relation between the temperature and the excitation energy of a system (the caloric curve) is of fundamental importance in a wide variety of physical systems. Since the application of the concept of a caloric curve to atomic nuclei [1, 2], several “thermometers” have been used to elucidate properties of excited nuclei including the transition from evaporative-type decay to nuclear multifragmentation (see [3, 4], and references therein). Recently, a clear mass-dependence of the caloric curve for finite nuclei has been demonstrated [5].
The dependence of the nuclear caloric curve on the neutron/proton asymmetry, , remains uncertain due to conflicting predictions from theoretical calculations and the relatively small body of experimental data on the subject. Some theoretical approaches predict that critical temperatures or limiting temperatures would be higher for neutron-poor systems [6, 7]; others predict higher temperatures for neutron-rich systems [8, 9, 10]. Inclusion (or intentional omission) of a “gas” phase that interacts with the bulk system is expected to impact the asymmetry dependence of the temperature of the bulk system [7, 8]. The observation of an asymmetry dependence may support the physical picture of a nuclear liquid interacting with its vapor [7], or may allow insight into the driving force of nuclear disassembly [11]. Studies in recent years [12, 13, 14] have sought to probe the asymmetry energy in the nuclear equation of state by examining the fragments produced in heavy-ion reactions. Since these studies often assume the temperature is independent of the asymmetry, observation and characterization of an asymmetry-dependence of the caloric curve would allow a refined interpretation of fragment yield data (e.g. in the statistical interpretation of isoscaling). Moreover, characterization of this asymmetry dependence may offer the opportunity to probe the asymmetry energy in a new way; this is discussed below. Experimentally, temperatures have shown either a small dependence [11, 15] or no discernible dependence [16, 17] on the asymmetry of the initial system.
Motivation for an asymmetry dependence of the nuclear temperature may be seen in the following argument based on Landau theory [18, 19, 20]. We consider a fragmenting nuclear source, and write the free energy per nucleon of each fragment produced by the source as
| (1) |
where is the free energy per nucleon of the fragment in isolation and is the temperature of the system. The asymmetry of the fragment increases the free energy in proportion to , the conjugate variable of . The quantity is the asymmetry field due to the source where is the asymmetry energy coefficient and is the asymmetry of the source [19]. The Coulomb interaction between the charged fragment of interest () and the remainder of the source () is described by the term. Consider two identical fragments produced from two sources with the same mass and excitation energy but different asymmetry. Taking the difference in the free energy for these two fragments, cancels exactly. This gives a linear dependence of temperature on the source asymmetry:
| (2) |
In the present work, we demonstrate such an asymmetry dependence of nuclear temperatures exists.
2 Experiment and Event Selection
To investigate the dependence of the nuclear caloric curve on asymmetry, heavy-ion collisions at intermediate energy were studied. Charged particles and free neutrons produced in reactions of 70Zn+70Zn, 64Zn+64Zn, and 64Ni+64Ni at E/A = 35 MeV [21, 22] were measured with excellent isotopic resolution in the NIMROD-ISiS detector array [17, 23]. The quasi-projectile (QP, the primary excited fragment that exists momentarily after a non-central collision) was reconstructed, including determination of the QP composition (both A and Z). Excitation energies above = 2 MeV are well measured with this setup.

The uncertainty in the composition arises mainly from the free neutron measurement, which arises from the efficiency of the neutron detector (70%) and from background signals in the neutron detector. The background signals were measured; the variance of the background multiplicity is a factor of 10 smaller than the variance of the raw neutron multiplicity. The excitation energy was deduced using the measured free neutron multiplicity, the charged particle kinetic energies, and the Q-value of the breakup. Use of simulations of the detector response [24] indicate that the uncertainty in the excitation energy per nucleon due to the uncertainty in the free neutron multiplicity is around 0.1 MeV, which is significantly smaller than the spacing between even the closest caloric curves. This uncertainty does not bias the results presented in this letter.
Building on previous work [14, 16, 17, 25], three cuts are made to select equilibrated QP sources. To exclude fragments that clearly do not originate from an equilibrated QP source, the fragment velocity in the beam direction , relative to the velocity of the heavy residue , is restricted. The accepted window on is for Z=1, for Z=2, and for Z3. The mass of the reconstructed QP is required to be . To select QPs that are equilibrated, it is required that the QP be on average spherical. This is achieved with a selection on the longitudinal momenta and transverse momenta of the fragments comprising the QP: where with the sums extending over all fragments of the QP. Since the shape degree of freedom is slow to equilibrate, these QPs that are on-average spherical should be thermally equilibrated. Over the range of excitation energies presented in this work, the typical QP is comprised of one large fragment, several light particles (Z2) and one IMF (3Z8).
The temperatures of the QPs are calculated with the momentum quadrupole fluctuation method [26], which has been previously used to examine temperatures of nuclei [16, 17, 27]. The momentum quadrupole is defined as using the transverse components and of the particle’s momentum in the frame of the QP source. Assuming a Maxwell-Boltzmann distribution, the variance of is related to the temperature by where is the probe particle mass [16, 26]. For this analysis, protons, which are abundantly produced in the collisions, are used as the probe. The longitudinal component, , is excluded to minimize any contribution from the collision dynamics, which manifests in the beam direction. The effects of secondary decay on this thermometer should be small [16]: the thermal energy in the primary clusters is significantly less than that in the QP, so the width of the momentum quadrupole is dominated by the QP breakup.

3 Results and Discussion
Figure 1 shows the temperature as a function of excitation energy per nucleon () of the QP as determined with the momentum quadrupole fluctuation thermometer using protons as the probe particle. Data points are plotted for 1MeV-wide bins in excitation energy per nucleon. For clarity, the points are connected with lines to guide the eye. The error bars correspond to the statistical uncertainty and where not visible are smaller than the points. The temperature shows a monotonic increase with excitation energy. At = 2.5 MeV, the temperatures are around 6 MeV; by = 8.5 MeV, the temperatures have risen to around 12 MeV. Each curve corresponds to a narrow selection in the asymmetry of the source, , as indicated in the legend. The average asymmetries for the selections are 0.0640, 0.0988, 0.1370, 0.1758, and 0.2145. The caloric curve is observed to depend on the asymmetry of the source. Increasing the neutron content of the QP source shifts the caloric curve to lower temperatures. In fact, the caloric curves for the five source asymmetries appear parallel and equally spaced. An increase of 0.15 units in corresponds to a decrease in the temperature by about 1.1 MeV.
In previous data, a plateau in the caloric curve has been observed and interpreted as a signature of a phase transition [4, 5]. In the present data, there is no plateau observed in the caloric curve for these excited sources. However, this is not unexpected for such small sources () where the plateau is not as well defined as it is for heavier sources [5], and may be masked by a varying density [28, 29]. Moreover, the plateau might lie entirely above the excitation energies measured in this experiment [5].
The composition of the de-exciting QP changes with time. Ideally, the probe particles should be correlated with the composition of the source at the time of their emission. Our method determines the initial composition of the QP, and correlates this with the temperature deduced using the measured particles which are emitted over a range of times. Correlating the initial composition of the QP, rather than the instantaneous composition, could mask the asymmetry dependence of the temperature to some extent. Thus, the true dependence may be even greater than the considerable asymmetry dependence of nuclear temperatures observed here.
The asymmetry of the decaying source should impact the caloric curve more directly than the asymmetry of the initial system. We have explored the impact of selecting on the asymmetry of the initial system rather than the asymmetry of the reconstructed source. Figure 2 shows the proton momentum quadrupole fluctuation caloric curves selected on the asymmetry of the initial system. Data points are plotted for each 1MeV-wide bin in excitation energy. The error bars correspond to the statistical uncertainty, and where not visible are smaller than the points. The temperatures for the neutron-rich systems are generally the lowest. This is consistent with the results presented above (Fig. 1), though the magnitude of the effect is much smaller. Here, decreasing the system asymmetry from 0.143 to 0.063 increases the temperature by about 0.1 MeV, while decreasing the source asymmetry by this amount increases the temperature by about 0.55 MeV. Though the asymmetry of the initial system might be employed as a surrogate for the asymmetry of the fragmenting system, at intermediate beam energies these are only weakly correlated. The asymmetry distribution of the QP following the interaction is broad (); there is considerable overlap in the distributions from the different initial systems, in agreement with previous work [14, 17, 25, 30, 31, 32]. The present data show that the ability to select the composition of the QP source provides much greater sensitivity to the asymmetry dependence of the caloric curve.
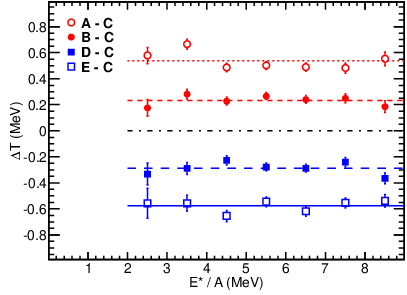
The shift in temperature due to the asymmetry of the source is examined more closely in Fig. 3. The central curve from Fig. 1 () has been used as a reference. The difference in temperature between each caloric curve and the reference is plotted as a function of the excitation energy. Error bars corresponding to statistical uncertainties are shown, and where not visible are smaller than the points. The differences in the momentum quadrupole fluctuation temperature are fairly constant. The shift in the caloric curve with asymmetry is essentially independent of excitation energy over the range measured here. The average for each pair of bins is indicated by the horizontal lines. Figure 3 shows even more clearly than Fig. 1 that the caloric curves for different bins are parallel and equally spaced.
The temperature shift of the caloric curve is plotted as a function of changing source asymmetry in Fig. 4. This is obtained in the following way. For each possible pairing of the five caloric curves (10 pairings total), the temperature difference as a function of excitation energy is calculated. These differences show no trend with excitation energy, (as evidenced in Fig. 3); the average of the temperature difference is taken as . For each possible pairing of the five caloric curves, corresponds to the difference in the mean asymmetries of the pair of curves. The error bars show the statistical errors, and where not visible are smaller than the points. A negative correlation of with is observed, and is well described by a linear fit over the broad range in source asymmetry, with slope -7.3 MeV.
This correlation is consistent with the free energy argument presented (Eq. 2). By averaging over excitation energy, we isolate the dependence on from ; the intercept is zero here by construction. The slope of the correlation is dependent on the asymmetry and Coulomb terms. It may be possible to extract information on the asymmetry energy coefficient. For this, an accurate estimate of the density would be necessary, which will be the focus of future work.
The presently observed decrease in temperature with increasing asymmetry can be compared to the recent result from the ALADIN collaboration [11, 15] which shows for peripheral collisions a modest dependence of the temperature on the neutron-proton asymmetry. In the ALADIN analysis, the asymmetry of the initial system is used. The method used to select the composition is important, and is examined in the present work. At intermediate energy, the difference between the asymmetry of the source (Fig. 1) and the initial system (Fig. 2) shows the importance of the full source reconstruction, including the free neutrons: selection of the source (rather than the initial system) allows greater sensitivity to the asymmetry dependence of the temperature. Though the evolution of this difference with increasing beam energy up to E/A = 600 MeV of the ALADIN measurement remains to be seen, observables dependent on the QP asymmetry have shown a strong dependence with energy, becoming more pronounced at lower excitation energy [33]. Studies at various beam energies, or studies sensitive to a broader range in excitation energy, could probe a possible evolution with excitation energy of the asymmetry dependence of the nuclear temperature.

4 Conclusion
In conclusion, we have provided experimental evidence for a dependence of nuclear temperatures on the neutron-proton asymmetry using a kinetic thermometer. Of crucial importance is the selection on the asymmetry of the fully-reconstructed isotopically-identified fragmenting source, rather than the initial system asymmetry. The temperature is observed to depend linearly on the source asymmetry. The temperature changes on the order of 1 MeV with varying asymmetry. Future experimental studies should examine particularly the low excitation energy region to investigate how the asymmetry dependence changes as the reaction mechanism evolves from the onset of evaporation through multifragmentation; and, over a wide range of excitation energy, should constrain (or at least determine) the density of the emitting source to allow a more quantitative understanding of the deduced caloric curves.
Acknowledgments
We thank the staff of the TAMU Cyclotron Institute for providing the high quality beams which made this experiment possible. This work was supported by the Robert A. Welch Foundation (A-1266), and the U. S. Department of Energy (DE-FG03-93ER-40773).
References
- [1] H. A. Bethe, Rev. Mod. Phys. 9 (1937) 69.
- [2] V. Weisskopf, Phys. Rev. 52 (1937) 295.
- [3] S. Shlomo, V. M. Kolomietz, Rep. Prog. Phys. 68 (2005) 1.
- [4] A. Kelic, J. B. Natowitz, K. H. Schmidt, Eur. Phys. J. A 30 (2006) 203.
- [5] J. B. Natowitz, et al., Phys. Rev. C 65 (2002) 034618.
- [6] V. M. Kolomietz, A. I. Sanzhur, S. Shlomo, S. A. Firin, Phys. Rev. C 64 (2001) 024315.
- [7] C. Hoel, L. G. Sobotka, R. J. Charity, Phys. Rev. C 75 (2007) 017601.
- [8] J. Besprosvany, S. Levit, Phys. Lett. B 217 (1989) 1.
- [9] R. Ogul, A. S. Botvina, Phys. Rev. C 66 (2002) 051601(R).
- [10] J. Su, F. S. Zhang, Phys. Rev. C 84 (2011) 037601.
- [11] C. Sfienti, et al., Phys. Rev. Lett. 102 (2009) 152701.
- [12] M. Colonna, M. B. Tsang, Eur. Phys. J. A 30 (2006) 165.
- [13] D. V. Shetty, S. J. Yennello, G. A. Souliotis, Phys. Rev. C 76 (2007) 024606.
- [14] P. Marini, et al., Phys. Rev. C 85 (2012) 034617.
- [15] W. Trautmann, et al., Int. J. Mod. Phys. E 17 (2008) 1838.
- [16] S. Wuenschel, et al., Nucl. Phys. A 843 (2010) 1.
- [17] S. K. Wuenschel, Ph.D. thesis, Texas A&M Univ., 2009.
- [18] K. Huang, Statistical Mechanics, J. Wiley and Sons, New York, 2 edition, 1987.
- [19] A. Bonasera, et al., Phys. Rev. Lett. 101 (2008) 122702.
- [20] M. Huang, et al., Phys. Rev. C 81 (2010) 044618.
- [21] Z. Kohley, Ph.D. thesis, Texas A&M Univ., 2010.
- [22] Z. Kohley, et al., Phys. Rev. C 83 (2011) 044601.
- [23] S. Wuenschel, et al., Nucl. Inst. Meth. A 604 (2009) 578.
- [24] P. Marini, et al., Manuscript in Preparation (2012).
- [25] S. Wuenschel, et al., Phys. Rev. C 79 (2009) 061602.
- [26] H. Zheng, A. Bonasera, Phys. Lett. B 696 (2011) 178.
- [27] B. Stein, et al., arXiv (2011) 1111.2965v1.
- [28] A. Borderie, et al., arXiv (2012) 1207.6085.
- [29] J. Mabiala, et al., arXiv (2012) 1208.3480.
- [30] D. Rowland, Ph.D. thesis, Texas A&M Univ., 2000.
- [31] D. Rowland, et al., Phys. Rev. C 67 (2003) 064602.
- [32] S. Galanopoulos, et al., Nucl. Phys. A 837 (2010) 145.
- [33] M. Veselsky, et al., Phys. Lett. B 497 (2001) 1.