UT–12–25
Comment on the CMS search for charge–asymmetric production of boson in events
Motoi Endo, Sho Iwamoto
Department of Physics, University of Tokyo, Tokyo 113–0033, Japan
A reanalysis is presented on the CMS result on a search for a boson that couples to the top and down quarks. The model is motivated by the Tevatron results on the forward–backward asymmetry of pair production. In the evaluation of the theoretical cross section of , the interference effect between the SM and amplitudes is shown to be important, though it is ignored in the CMS analysis. The lower mass bound on the boson is relaxed from to at the 95% C.L. due to the interference effect. The bound is also compared to the top forward-backward asymmetry.
The CDF and D0 experiments measured the forward–backward (FB) asymmetry of the top quark pair production, which is defined as
| (1) |
where is the rapidity difference. The measured inclusive asymmetry is
| CDF [1] : | D0 [2] : | (2) |
at the parton level, which is about away from the Standard Model (SM) prediction, [3]. Categorized by the rapidity difference, a discrepancy is found in a large region, whose experimental result is
| (3) |
from the CDF [1]. This is larger than the SM value, [3]. The difference is enhanced in a large invariant mass region of . The CDF reported [1]
| (4) |
while the SM expectation is [3], leading to deviation. The inconsistency is also observed in the leptonic channel of the decay. The D0 measured the leptonic asymmetry as [4]
| (5) |
which is compared to the SM, , providing discrepancy. The background could be a source of these deficits [5], whereas the deviations might be a sign of physics beyond the SM.
In order to explain the anomaly, a model with a flavor–changing boson was proposed [6], whose Lagrangian is
| (6) |
This can contribute to the asymmetry by , which is a size of the current discrepancy. Motivated by this prospect, the CMS collaboration recently reported a result on a search for the event at the center-of-mass energy of with the integrated luminosity of [7]. They used a theoretical cross section at the leading order (LO), referring to Ref. [8]. However, the cross section is evaluated with neglecting the interference between the SM and amplitudes. In this note, we show that the interference effect is comparable to the cross section and must be included. The mass bound on is found to be relaxed by compared to that obtained in the CMS paper.
The CMS searched for the event. The boson contributes to the processes and as shown in Fig. 1. Since both processes have also the SM contributions, the total cross section is represented as
| (7) |
for each process, where denotes the interference term, . It is emphasized that the deviation of the cross section from the SM is calculated as the sum of and . The process has a large contribution from the SM through the diagram Fig. 2, and thus, for the process is as large as the contribution, .
The cross sections with and without the interference are calculated with MadGraph 5 [9], using the model file generated by ourselves with FeynRules 1.6 [10]. The simulation is based on the LO calculation, and CTEQ6L1 [11] is used as the parton distribution function.
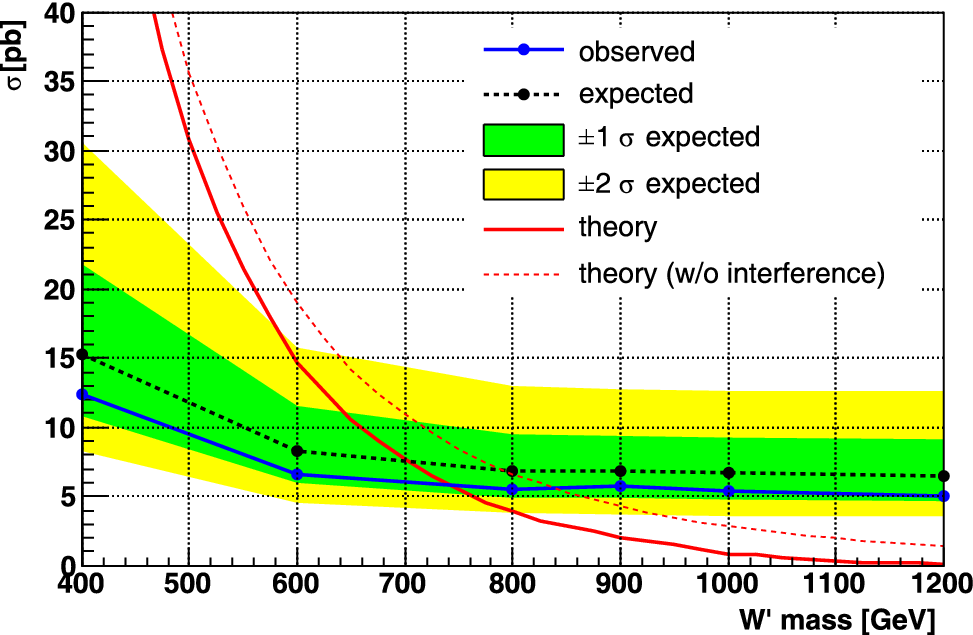
In Fig. 0, the theoretical cross section is compared to the exclusion bound by the CMS [7]. We reproduced the referred cross section in the CMS paper by ignoring the interference effect, which is shown by the red-dotted line in Fig. 0. Based on the analysis, they put a limit of at the 95% C.L. if the coupling is fixed to be . However, including the interference effect, the cross section reduces as shown in Fig. 0 with the red-solid line. The theoretical cross section decreases by % for . We found that, due to the interference effect, the lower bound is corrected as at the 95% C.L. for .
| process | SM | ||||||
| only | interfer. | total | only | interfer. | total | ||
| — | — | — | — | ||||
| — | — | — | — | ||||
| the others | — | — | — | — | |||
| all processes | |||||||
Let us investigate the interference effect. In Tab. 1, the cross sections are shown for two benchmark points of . For the process , the interference term is sub-leading compared to the total contribution. Especially when is small, the -channel production of the boson dominates. On the other hand, since the process has a sizable SM contribution, the interference effect is enhanced. Since the effect works destructive, focusing on the -channel production would be a good choice to increase the signal-to-background ratio, which can be done with a cut on the invariant mass of the jet and the -quark. With the cut the first two diagrams of Fig. 1 mainly contributes, and destructive interference in events would be ignorable.
The limit on the cross section in Fig. 0 is converted to the bound on the – plane. 11 1 A similar plot is found in Ref. [12], where the ATLAS search for the events at the accumulated data of [13] is used. The latest CMS result [7] is found to provide a more severe limit on the parameter space. Taking account of the interference effect, the dark gray region in Fig. 4 is excluded by the CMS search for +jet. The QCD correction can change the cross section. If the -factor of 1.3 is included according to the argument in Ref. [8], the excluded region becomes wider, which is shown by the light gray region in Fig. 4. Note that we employed an approximation to draw the excluded region that the acceptance does not depend on the coupling ; the CMS result, i.e. the blue solid line in Fig. 0, is used as the limit on the cross section.
The CMS bound is compared to the model prediction of the top FB asymmetry with , which is described as the contours in Fig. 4. The asymmetry is evaluated with MadGraph 5 at the LO level. Since the asymmetry emerges at the NLO level of the QCD in the SM, in Fig. 4 originates in the contribution. It is found that is limited to be less than , which looks insufficient to explain the Tevatron results.
Finally, let us comment on the acceptance and the QCD corrections. The acceptance depends on the jet distributions in the detectors. The interference effect changes the relative size of each contribution, which could affect the acceptance. According to the CMS analysis [7], this seems more important for heavier . Moreover, the top FB asymmetry at the parton level also depends on the acceptance at the CDF and D0 detectors [14, 15, 16]. Since the corrections are not included in this note, the full detector analysis is required. Next, the QCD correction is not considered for the evaluation of the top FB asymmetry. The NLO correction to the contribution can increase the asymmetry by about 10% [17]. Nonetheless, the CMS bound on the event provides a crucial constraint on in the flavor–changing model. Also as discussed above, focusing on -channel production is considered to feature the signal. The authors are eager for the CMS to update the analysis with the interference effect between the SM and amplitudes.
Acknowledgment
The work by M.E. was supported by Grand-in-Aid for Scientific research from the Ministry of Education, Science, Sports, and Culture (MEXT), Japan, No. 23740172. The work by S.I. was supported by Japan Society for the Promotion of Science (JSPS) Grant-in-Aid for JSPS Fellows.

References
- [1] CDF Collaboration, CDF Note 10807.
- [2] D0 Collaboration, Phys.Rev. D84 (2011) 112005 [arXiv:1107.4995].
- [3] J. H. Kuhn and G. Rodrigo, JHEP 1201 (2012) 063 [arXiv:1109.6830].
- [4] D0 Collaboration, arXiv:1207.0364.
- [5] K. Hagiwara, J. Kanzaki, and Y. Takaesu, arXiv:1205.5173.
- [6] K. Cheung, W.-Y. Keung, and T.-C. Yuan, Phys. Lett. B682 (2009) 287–290 [arXiv:0908.2589].
- [7] CMS Collaboration, arXiv:1206.3921.
- [8] S. Knapen, Y. Zhao, and M. J. Strassler, arXiv:1111.5857.
- [9] J. Alwall, M. Herquet, F. Maltoni, O. Mattelaer, and T. Stelzer, JHEP 06 (2011) 128 [arXiv:1106.0522].
- [10] N. D. Christensen and C. Duhr, Comput. Phys. Commun. 180 (2009) 1614–1641 [arXiv:0806.4194].
- [11] J. Pumplin et al., JHEP 07 (2002) 012 [hep-ph/0201195].
- [12] D. Duffty, Z. Sullivan, and H. Zhang, Phys.Rev. D85 (2012) 094027 [arXiv:1203.4489].
- [13] ATLAS Collaboration, ATLAS-CONF-2011-100.
- [14] M. I. Gresham, I.-W. Kim, and K. M. Zurek, Phys. Rev. D83 (2011) 114027 [arXiv:1103.3501].
- [15] S. Jung, A. Pierce, and J. D. Wells, Phys. Rev. D83 (2011) 114039 [arXiv:1103.4835].
- [16] B. Grinstein, A. L. Kagan, J. Zupan, and M. Trott, JHEP 1110 (2011) 072 [arXiv:1108.4027].
- [17] K. Yan, J. Wang, D. Y. Shao, and C. S. Li, Phys.Rev. D85 (2012) 034020 [arXiv:1110.6684].