Low frequency radio–FIR correlation in normal galaxies at 1 kpc scales
Abstract
We study the radio–FIR correlation between the nonthermal (synchrotron) radio continuum emission at cm (333 MHz) and the far infrared emission due to cool ( K) dust at m in spatially resolved normal galaxies at scales of 1 kpc. The slope of the radio–FIR correlation significantly differs between the arm and interarm regions. However, this change is not evident at a lower wavelength of cm (1.4 GHz). We find the slope of the correlation in the arm to be and we use this to determine the coupling between equipartition magnetic field () and gas density () as . This is close to what is predicted by MHD simulations of turbulent ISM, provided the same region produces both the radio and far infrared emission. We argue that at 1 kpc scales this condition is satisfied for radio emission at 1.4 GHz and may not be satisfied at 333 MHz. Change of slope observed in the interarm region could be caused by propagation of low energy ( 1.5 GeV) and long lived ( yr) cosmic ray electrons at 333 MHz.
Subject headings
techniques: image processing – cosmic rays – dust – galaxies : ISM – galaxies : spiral – infrared : galaxies – radio continuum : galaxiesI. Introduction
The radio–far infrared (FIR) correlation in normal galaxies was first observed by [47, 48] and later extended by the IRAS mission. Subsequently it was established that the correlation holds good (within a factor of 2) over five orders of magnitude in radio and FIR luminosity [11, 53] for a wide morphological class of galaxies like, spirals, irregulars and dwarfs [49, 15, 41] on global scales. Based on spatially resolved studies of normal and irregular galaxies it is seen that the correlation holds even at scales of few tens to hundreds of parsecs [4, 51, 23, 36, 43, 24, 37, 39, 40, 17, see e.g].
The basic model that connects these two regimes of emission is via star formation [20]. The radio continuum emission arises due to synchrotron emission (henceforth nonthermal emission) from relativistic electrons, produced in supernova remnants. A good fraction of them originate from massive (), short lived ( yr) stars. The FIR emission arises from re-radiation by dust heated due to ultra violet (UV) photons emitted by the above population of stars. Though the cause of the correlation is well understood, the tightness over several orders of magnitude still remains puzzling. Many models explaining the correlation require close coupling between the magnetic field () and the gas density () of the form, [22, 38, 45, see e.g.,]. Such a coupling can be established by magnetohydrodynamic (MHD) turbulence of the interstellar medium (ISM) [8, 9, 10, 19, see]. Numerical simulations by Cho & Vishniac [9] revealed that is a manifestation of the equipartition condition, i.e, in steady MHD turbulence the magnetic field energy density and the energy density of the gas are similar. Similar values of have been found through observations of magnetic field by Zeeman splitting observations in molecular clouds by [13], also by using equipartition magnetic field and molecular gas observations in external galaxies by Niklas & Beck [38] and in Milky Way and M31 by Berkhuijsen [6]. Alternatively, the slope of the radio–FIR correlation has been used to find , where 0.4–0.6 [38, 23, 17].
| Name | Morphological | Angular | Distance | FIR | Radio | ||
|---|---|---|---|---|---|---|---|
| type | size (D25)(′) | (∘) | (Mpc) | m | cm | cm | |
| (1) | (2) | (3) | (4) | (5) | (6) | (7) | (8) |
| NGC 4736 | SAab | 11.29.1 | 41 | 4.661 | SINGS | GMRT | Westerbork11 1 The Westerbork Synthesis Radio Telescope (WSRT) is operated by the Netherlands Foundation for Research in Astronomy (NFRA) with financial support from the Netherlands Organization for scientific research (NWO). SINGS (1374.5 MHz)4 |
| NGC 5055 | SAbc | 12.67.2 | 59 | 9.2† | SINGS | GMRT | Westerbork SINGS (1696 MHz)4 |
| NGC 5236 | SABc | 11.211 | 24 | 4.512 | SINGS | GMRT | VLA22 2 The Very Large Array (VLA) is operated by the NRAO. The NRAO is a facility of the National Science Foundation operated under cooperative agreement by Associated Universities, Inc. CD array (1452 MHz)5 |
| NGC 6946 | SABcd | 11.59.8 | 33 | 6.83 | SINGS | GMRT | VLA CD array (1465 MHz)6 |
In column (3) D25 refers to the optical diameter measured at the 25 magnitude arcsec-2 contour from [46]. Column (4) gives the inclination angle () defined such that is face-on. Distances in column (5) are taken from: 1 [29], 2 [28], 3 [27] and the NED †. Column (6) and (7) are the sources of data for the FIR maps and 333 MHz (cm) maps respectively. Column 8 are the data available at a higher frequency near 1 GHz (cm): 4 [7], 5 VLA archival data using the CD array configuration (project code : AS325), 6 VLA archival map by combining interferometric data from C and D array, [5].
So far, spatially resolved and global study of the correlation has been done primarily using radio emission at 1.4 GHz and higher frequencies. The only low frequency study done at 150 MHz [12], confirms that on global scales the radio–FIR correlation holds good and is similar to what is seen at 1.4 GHz. To our knowledge, no low frequency ( 1.4 GHz, such as 333 MHz) spatially resolved study of the radio–FIR correlation exists in the literature. The motivation to do such a study arises from the fact that at lower frequencies the emission is largely nonthermal, hence better exhibiting the relation between magnetic field and star formation. Secondly, since the cosmic ray electrons (CRe) propagate larger distances in the galaxies at lower frequencies, it is important to assess how that affects the form of the radio–FIR correlation.
In this paper, we present spatially resolved study of the radio–FIR correlation for four normal galaxies, NGC 4736, NGC 5055, NGC 5236 and NGC 6946 at spatial resolution of 1–1.5 kpc with radio observations made at 333 MHz ( cm) and 1.4 GHz ( cm). We also estimate the value of and verify the equipartition assumptions. In Section II we discuss the various sources of maps used in this work and also define the parameter ‘’ which is used to quantify the correlation. In Section III we present our results on spatially resolved radio–FIR correlation using far infrared emission at m and radio emission at cm and cm. We discuss our results in Section IV.
II. Data analysis
The four galaxies in the sample for this study was chosen from [3]. The large angular size of the galaxies ensure enough independent regions to carry out spatially resolved study. Our sample comprises of the galaxies NGC 4736, NGC 5055, NGC 5236 and NGC 6946. Table 1 summarizes the salient features of our sample and the various sources of obtaining the archival data.
To study the radio–FIR correlation using nonthermal radio emission, a thorough separation of thermal radio emission is needed. We used nonthermal radio continuum maps at cm and cm after separating the thermal free–free component mainly originating from Hii regions in recent star formation sites. Details of observation and data analysis are discussed in [3]. The thermal emission was estimated using the technique developed by [44], wherein, the dust extinction-corrected H map is used as a template for the thermal free-free emission. This is then extrapolated to the desired radio frequency and subtracted from the total emission map. The cm maps were obtained using the Giant Meterwave Radio Telescope (GMRT) while the cm maps were obtained using archival data from various assorted sources (see Table 1). The nonthermal maps had 40 arcsec resolution with 9 arcsec pixel size. We scaled the flux of each galaxy to a common frequency of 1.4 GHz using the spectral index map obtained from the 333 MHz and near 1 GHz images for each pixel.
The galaxies were observed in the far-infrared by the Spitzer at m as a part of the Spitzer Infrared Nearby Galaxy Survey (SINGS; Kennicutt et al. 31) using the Multiband Imaging Photometer for Spitzer (MIPS; Rieke et al. 42). The images were obtained from the publicly available database in SINGS Data Release 533 3 http://data.spitzer.caltech.edu/popular/sings/. The m images have a pixel size of 4.5 arcsec and a point spread function (PSF) of about 16 arcsec. These were convolved to the resolution of nonthermal radio maps (40 arcsec) and re-gridded to a common pixel size of 9 arcsec. All the maps were then aligned to the same coordinate system.
| Arm regions | |||
 |
 |
 |
 |
| Interarm regions | |||
 |
 |
 |
 |
aThe images were downloaded from the NED for the galaxies NGC 4736 [33, 1-m Jacobus Kapteyn Telescope (JKT) at La Palma with filter Ha6570;], NGC 5055 (2.3-m telescope at KPNO, filter: 6580) and NGC 5236 (0.9-m telescope at CTIO, filter: 6563). For NGC 6946 the image was downloaded from the SINGS website.
| Name | ||||||
|---|---|---|---|---|---|---|
| Jy | mJy beam-1 | Jy | mJy beam-1 | Jy | mJy beam-1 | |
| NGC 4736 | 0.90.06 | 2 | 0.31 0.03 | 0.35 | 93.93 7.34 | 15 |
| NGC 5055 | 2.30.13 | 3 | 0.41 0.05 | 0.4 | 72.57 5.16 | 15 |
| NGC 5236 | 6.860.62 | 2.5 | 2.36 0.18 | 0.3 | 312.0 15.6 | 30 |
| NGC 6946 | 4.30.24 | 1 | 1.5 0.1 | 0.2 | 207.2 16.1 | 25 |
For the present study, the flux density per beam for the radio and FIR maps were determined within an area of arcsec diameter, with the adjacent region being about one beam away to ensure independence. Pixels with brightness above 2 ( is the noise in the map) were considered for the analysis. We estimate the slope of the radio–FIR and the quantity ‘’ introduced by [21].
The parameter is used as a measure of the radio–FIR correlation, where its dispersion indicates the tightness of the correlation. Conventionally it is defined as the logarithm of the ratio of total FIR flux between m and m and the radio flux measured at 1.4 GHz. However, we define as per Appleton et al. [2] using FIR flux density at m, such that,
where, is the radio wavelength (here, 20 cm or 90 cm) and and are the flux densities of m and radio wavelength respectively. The FIR emission from galaxies between m and m is dominated by the emission from cool dust with dust temperature, 20 K [51, 23, 44, 3, see e.g,]. The peak of this emission occurs at about m. Note that a black body at 20 K peaks at about m, but a grey body (, where is the dust emissivity index and is the Planck function) has a peak at m. The maps at m, which are nearest available to m, essentially traces this component of the dust. Using monochromatic m emission to study the radio–FIR correlation does not affect the conclusions significantly, except for a slight increase in the dispersion [37].
 |
 |
 |
 |
| Name | ||||||||||||
|---|---|---|---|---|---|---|---|---|---|---|---|---|
| (1) | (2) | (3) | (4) | (5) | (6) | (7) | (8) | (9) | (10) | |||
| NGC 4736 | arm: | 2.45 | 0.12 | 2.01 | 0.20 | 2.280.02 | 0.730.04 | 1.710.03 | 0.490.04 | |||
| interarm: | 2.46 | 0.15 | 1.46 | 0.23 | 2.410.04 | 1.130.12 | 1.710.03 | 0.280.04 | ||||
| NGC 5055 | arm: | 2.26 | 0.14 | 1.59 | 0.20 | 2.140.02 | 0.640.03 | 1.440.02 | 0.440.03 | |||
| interarm: | 2.03 | 0.16 | 1.27 | 0.24 | 2.100.01 | 0.530.03 | 1.380.01 | 0.300.04 | ||||
| NGC 5236 | arm: | 2.32 | 0.14 | 1.92 | 0.20 | 2.270.04 | 0.920.04 | 1.710.03 | 0.660.04 | |||
| interarm: | 2.13 | 0.20 | 1.60 | 0.26 | 2.080.03 | 0.760.05 | 1.500.02 | 0.400.04 | ||||
| NGC 6946 | arm: | 2.31 | 0.10 | 1.81 | 0.14 | 2.260.02 | 0.870.04 | 1.690.02 | 0.710.04 | |||
| interarm: | 1.97 | 0.19 | 1.32 | 0.32 | 2.070.01 | 0.640.03 | 1.520.01 | 0.340.02 | ||||
III. Results
The spatially resolved study of the radio–FIR correlation was done by broadly classifying the emission from arm (including the central region) and interarm regions of these galaxies. The arms were identified from the H images for each galaxy. For the ringed galaxy NGC 4736, which has no prominent arms, the star forming ring was taken as the arm. The arm and the interarm regions used in our analysis are plotted as circles which are overlayed on the 40 arcsec H images in Figure 1. The quantity was computed within each such region. Note that the calibration uncertainty at m could be per cent [37]. This would lead to a systematic error of about 10 per cent in the values of .
Table 2 gives the total flux density (in Jy) and map rms noise of the 40 arcsec images (in mJy beam-1) of the galaxies. The galaxy integrated mean values of are , , and , for the galaxies NGC 4736, NGC 5055, NGC 5236 and NGC 6946 respectively. The are , , and respectively. However, the spatially resolved estimates of and suggests that their values vary between arm and interarm regions. Figure 2 shows the brightness of the nonthermal radio emission with the far infrared emission at m, both in units of Jy beam-1, for all the four galaxies. The figure also shows the distribution of for cm and cm. It was seen that the star forming, gas rich spiral arms of the galaxies showed higher values for when compared to the adjacent low star forming interarm regions. Table 3 summarizes the mean value of the quantity and its dispersion for arm and interarm regions.
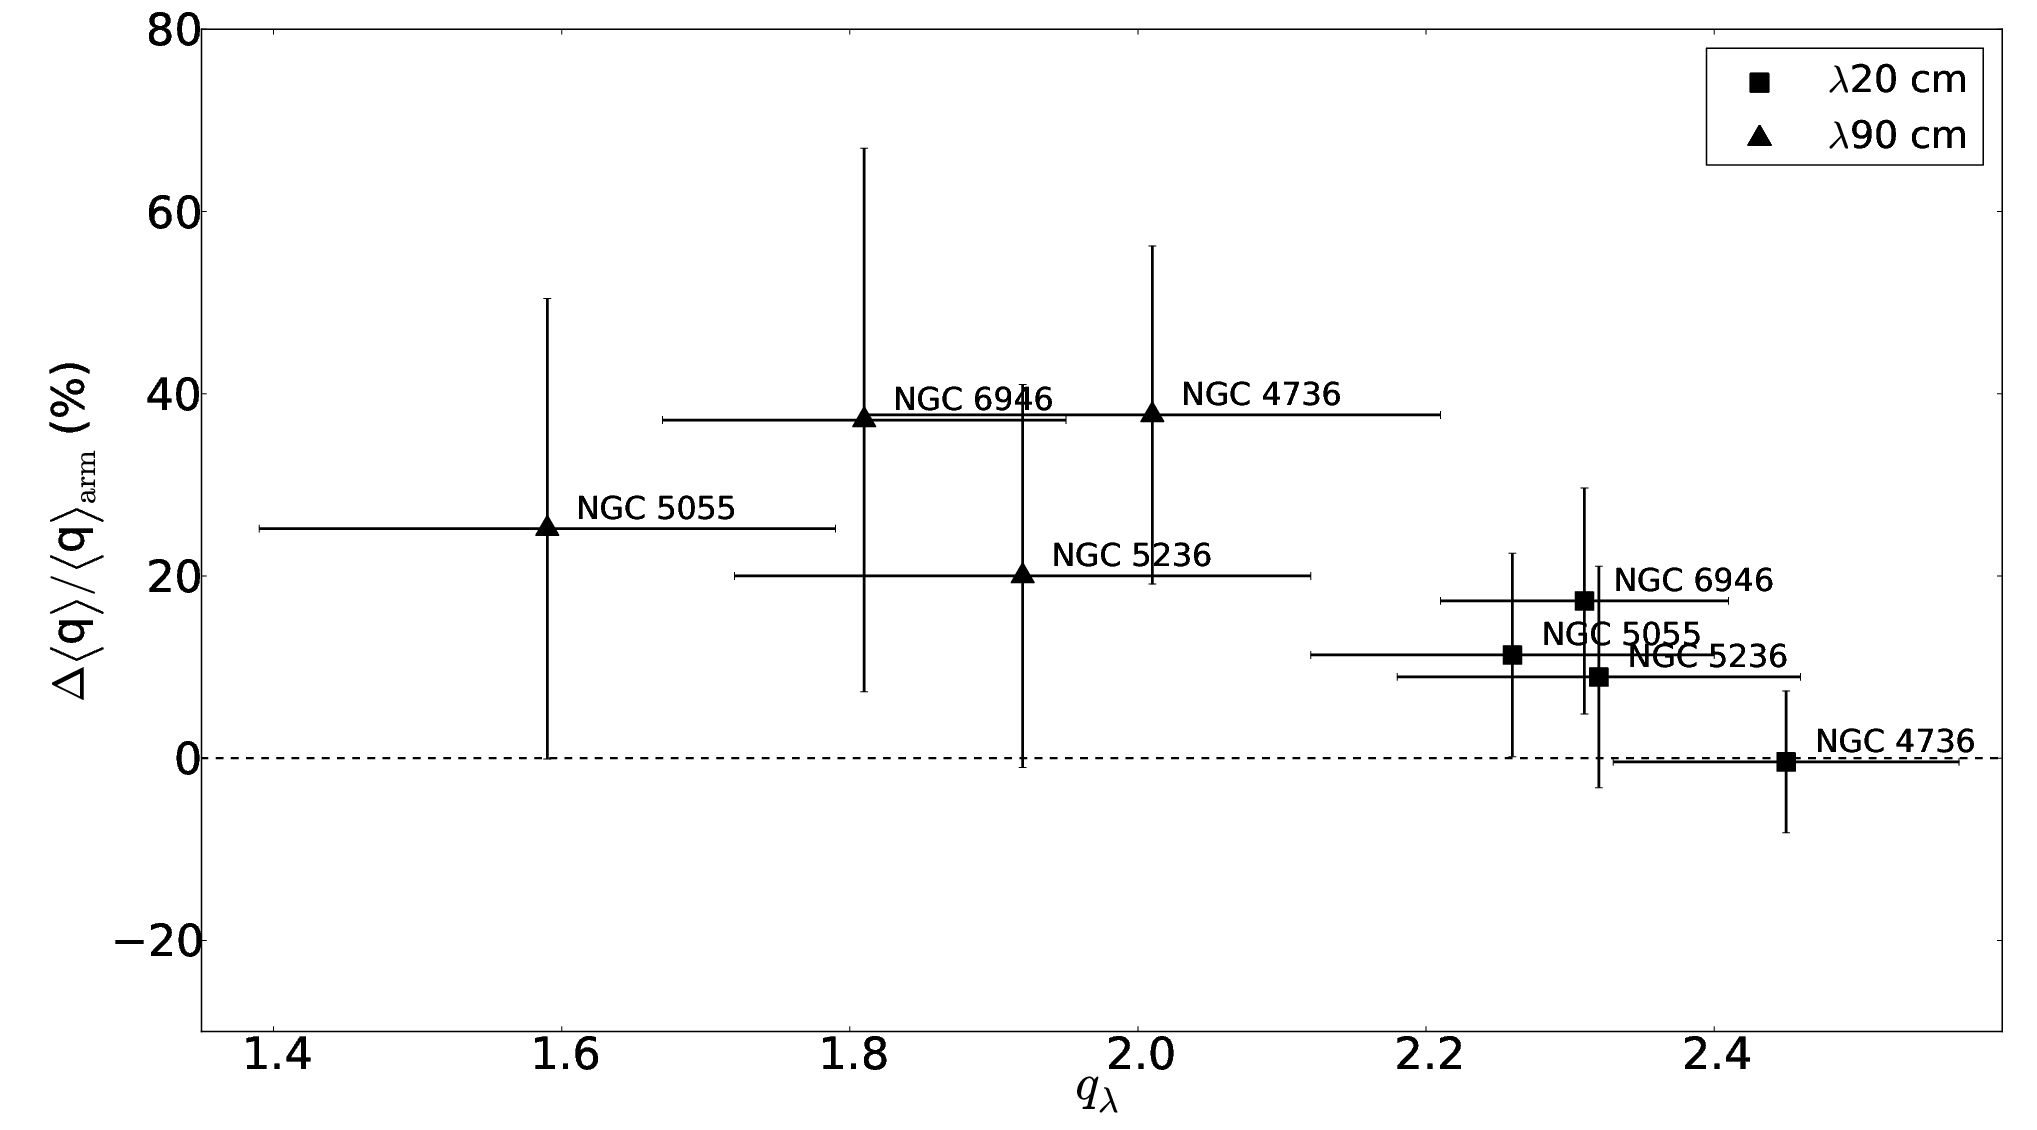 |
The mean value in the arms for all the galaxies were found to be, with a narrow dispersion of , while for the interarms and . At cm, we find the with and and . Figure 3 shows the percentage change in the value of between arms and interarms for each of the galaxies, where . The squares are for cm and triangles are for cm. The mean of the changes slightly, by about 9 percent, between arms and interarms, however, this change is significant with 99.9 percent confidence using Kolmogorov-Smirnov test. At cm, the change in the value of between arm and interarm regions are much pronounced with 30 percent.
III.1. Fit to the radio and IR flux densities
The data were fitted using the form , where, is the flux density of the radio emission at cm and cm, and is the flux density of the m infrared emission. The fitting parameter ‘’ is an estimate for , where , such that . The slope of the radio-infrared correlation is given by the parameter ‘’. Separate fits were done for arm and interarm regions using ordinary least-square ‘bisector method’ [25] in the log-log plane. The parameters obtained are summarized in Table 2 in the last four columns for cm and cm. The values of and are in good agreement with the mean values obtained from the respective distribution. The fitted parameters are plotted in Figure 2. The black lines are for fits at cm and the grey lines are at cm. The solid lines are fit to the arm regions only and the dashed lines are for the interarms. All the correlations are highly significant in our case with Pearson’s correlation coefficient, (and in most of the cases), except for interarm regions of NGC 4736 at cm, where .
The slope of the cm and m flux density for the arm regions for all the galaxies lies between – 0.9. However, for the interarm regions the slope is slightly shallower, lying in the range 0.55 – 1. The mean value of the parameters for arm and interarm after the fit can be written as,
| (1) |
| (2) |
The fitted value of and the slope differs slightly from arms to interarms.
At cm, we find that the slope lies in the range 0.45 – 0.7 for the arms, whereas in the interarm region the slope lies in the range 0.3 – 0.4. The slopes are much flatter than at cm. The mean values of the fitted parameters are found to be,
| (3) |
| (4) |
There is a significant change in the value of and the slope between the arm and the interarm regions.
III.2. q vs.
 |
 |
The quantity ‘’ can be expressed in terms of CRe escape timescale () and synchrotron timescale () as [36, 39]. CRe emitting for these timescales also determines the variations in nonthermal spectral index44 4 In the text we define the spectral index as, () from sites of injection to regions of dominant energy loss. In Fig. 4 we also study the variation of (left) and (right) with the determined at scales of kpc for all these galaxies from Basu et al. [3]. The distribution of with steps of 0.05, are shown in the top panels (Figure 10 in Basu et al. 3). The right panels shows the distribution of for the respective frequencies with steps of 0.05. The shaded histograms represents the arms and the unfilled histograms are for the interarms. At cm there is no apparent variation in the value of with (Pearson’s correlation coefficient, ), while at cm the decreases with steepening of the (r = 0.7).
In the arm regions where is seen to have a narrow distribution with mean and dispersion of 0.14, the values are higher, suggesting . However, in the interarm regions, and have a wide distribution with more than 50 percent dispersion. The values of ‘’ also systematically decreases as one moves from arms to interarms, indicating and thus the CRe loose energy before escaping the disk giving rise to steeper . Similar results were found for IC 342 and NGC 5194 [36, 39].
IV. Discussion
We have studied the radio–FIR correlation at 1 kpc scales for four normal galaxies using nonthermal radio maps at cm and cm and the far infrared maps at m. From the basic synchrotron theory (e.g., Moffet 35) and considering the radio emission from CRe emitting at critical frequencies, the energy of CRe at cm is 1.5 GeV and at cm is 3 GeV when they are gyrating in a typical magnetic field of G. The far infrared emission at m originates from cool dust at 20 K heated by the interstellar radiation field (ISRF) due to stars [16, 50, 52, 17]. We separately examine these correlations for the arm and the interarm regions, that is, regions of high and low thermal fractions respectively. The results of the various parameters as discussed in Section III are given in Table 3 for individual galaxies, and here we discuss the average properties. The dispersion on the parameter is a measure of the tightness of the radio–FIR correlation, which for the arm region is found to be less than 10 percent around the mean for both cm and cm. For the interarm region the dispersion is seen to increase to around 20 percent for both the frequencies. Further we find the slope of the radio–FIR correlation for the arm regions (also the high thermal fraction regions) remains similar at both the radio frequencies (see Table 3). It should be noted that a large number of global scale radio–FIR correlation studies exist, where the observed slope is steeper and closer to unity [see e.g., 41, 53, and the references therein]. However, the spatially resolved studies relating FIR cool dust emission to 20 cm radio emission, yields a value of the slope for LMC [24] and for M31 [23]. It is difficult to compare the slopes obtained in global studies with the spatially resolved case. The flux in global studies are averaged over both arm and interarm regions and we are uncertain about the contribution from each component. Multifrequency spatially resolved studies can provide an understanding of the relation between global scale and spatially resolved studies. For the present case, in the interarm regions (regions of low thermal fraction) for cm the slope is slightly flatter as compared to the arms (see Eq. 1 and 2). However, at cm, the slopes become distinctly flatter than the arm regions (see Fig. 2 and Eq. 3 and 4).
Our results can be used to determine the coupling between magnetic field () and the gas density () as discussed in the introduction and thereby validating the ‘equipartition’ assumptions in these galaxies at 1 kpc scales. Dumas et al. [17] showed that the slope of the radio–FIR correlation relates to as,
| optically thick dust | (5) | ||||
| optically thin dust | (6) |
where, is the Kennicutt-Schmidt law index [30, see e.g.,], is the slope of the radio–FIR correlation and is the nonthermal spectral index. For these face-on galaxies we use the assumption of optically thin dust to UV photons to estimate . We find that at cm and at cm. Similarly, for interarm regions due to a large range of we find in the range 0.41 – 0.5 at cm and between 0.18 – 0.22 at cm. Our estimated values of , using the correlation between cm and m, are consistent with the predictions of numerical MHD simulations of different ISM tubulence models, where [18, 32, 45, 19, see e.g.,].
In the arm regions, the slope and thus remains similar for both cm and cm. Note that the above prescription to determine is valid provided the radio and the FIR emission arises from the same emitting volume, with a diameter of about 1 kpc for most of the observations reported here. In the arm regions the UV photon has a mean free path of 100 pc within which most of the FIR emission arises. On the other hand, the CRe which gives rise to the radio emission diffuse farther away to kpc at 1400 MHz and kpc at 333 MHz in a galactic magnetic field of G. Hence in order to have a similar slope with frequency, the energy spectrum of the CRe giving rise to the radio emission should be independent of the volume element. This can only happen if the timescale for CRe diffusion/propagation () is significantly larger than their generation timescale (). It turns out that the is about yr at 333 MHz and years at 1400 MHz which is significantly larger than the as evident from the supernova rates, which is one every yr kpc-2 in Milky Way. We assume the same rate for these galaxies.
 |
The slope of the radio–FIR correlation in the interarm (low thermal fraction) region is similar to that of the arm at cm, however it becomes distinctly flatter at cm. The flattening primarily happens due to relative increase in radio flux at cm as compared to cm, which has the effect that gradually becomes steeper in the interarms. This relative increase in cm flux can be explained by continuous generation of CRe in the arm, which subsequently propagates into the interarm (e.g., from A to B or from farther regions in arms like C to B in Fig. 5). The propagation timescale for these CRe are few times years assuming Alfvn velocity of 100 km s-1 and typical arm to interarm distance of 1–2 kpc. In such a scenario, using Equation 6 of [26], in a typical galactic magnetic field of G, there would be a break in the energy spectrum for electrons above 2 GeV. This break frequency lies below cm or above 333 MHz. Such breaks have been seen at MHz and 1 GHz for similar normal galaxies, NGC 3627 and NGC 7331 respectively [40]. Thus the CRe emitting at cm, which lie above the break, do not loose significant amount of energy as compared to their higher energy counterparts. Hence, this results in increasing the relative flux at cm.
For the slope to remain similar between arms and interarm regions at cm (below the break), the ratio of the radio to FIR flux densities should remain similar. Observed radio flux between arm and interarm changes by a factor of 2–2.5. Similar ratio of flux density between arm and interarm regions at cm can be caused due to steeping of the spectral index to as compared in the arms. This implies the FIR flux should change by a factor of 2.5–3 between arm and interarm regions for radio–FIR slope of 0.8. The FIR flux density () depends on the dust temperature () and its density () as, , where is the FIR wavelength () dependent absorption coefficient for gain radius, [14, 1]. The temperature do not change significantly between arm and interarm for these galaxies [3]. For a constant gas-to-dust ratio, i.e, , a factor of 2–4 drop in average gas density between arm and interarm regions [34, found using the COJ:2→1 maps from Heracles;] would therefore cause the factor of 2–3 drop in FIR emission.
The slope of 0.80.1 of the radio–FIR correlation indicates that the energy equipartition assumption between cosmic ray particles and magnetic field may be valid in the gas rich arms of the galaxies at our spatial resolution of 1 kpc. For the interarm regions at cm the slope is similar to what is seen in arms, and thereby satisfying the equipartition conditions. The flattening of the slope at cm does not indicate any break down of equipartition condition, but results due to overlapping emissions from adjacent regions.
References
- [1] Alton, P. B., Xilouris, E. M., Misiriotis, A., Dasyra, K.M., Dumke, M., 2004, A&A, 425, 109
- [2] Appleton, P. N., et al., 2004, ApJS, 154, 147
- [3] Basu, A., Mitra, D., Wadadekar, Y., Ishwara-Chandra, C. H., 2012, MNRAS, 419, 1136
- [4] Beck, R., Golla, G., 1988, A&A, 191, L9
- [5] Beck, R. 2007, A&A, 470, 539
- [6] Berkhuijsen, E., 1997, in The Physics of Galactic Halos, eds. H. Lesch et al., (Berlin: Akademie-Verlag), 155
- [7] Braun, R., Oosterloo, T. A., Morganti, R., Klein, U., Beck, R., 2007, A&A, 461, 455
- [8] Chandrasekhar, S., Fermi, E., 1953, ApJ, 118, 113
- [9] Cho, J., Vishniac, E. T., 2000, ApJ, 539, 273
- [10] Cho, J., Lazarian, A., Vishniac, E., 2003, in Turbulence and Magnetic Fields in Astrophysics, ed. E. Falgarone & T. Passot (New York: Springer)
- [11] Condon, J. J., 1992, ARAA, 30, 575
- [12] Cox, M. J., Eales, S. A. E., Alexander, P., Fitt, A. J., 1988, MNRAS, 235, 1227
- [13] Crutcher, R. M., 1999, ApJ, 520, 706
- [14] Draine, B. T., Lee, H. M., 1984, ApJ, 285, 89
- [15] Dressel, L. L., 1988, ApJ, 329, L69
- [16] Devereux, N. A., Eales, S. A., 1989, ApJ, 340, 708
- [17] Dumas, G., Schinnerer, E., Tabatabaei, F. S., Beck, R., Velusamy, T., Murphy, E., 2011, AJ, 141, 41
- [18] Fiedler, R. A., Mouschovias, 1993, ApJ, 415, 680
- [19] Groves, B. A., Cho, J., Dopita, M., Lazarian, A., 2003, PASA, 20, 252
- [20] Harwit, M., Pacini, F., 1975, ApJ, 200, L127
- [21] Helou, G., Soifer, B. T., Rowan-Robinson, M., 1985, ApJ, 298, L7
- [22] Helou, G., Bicay, M. D., 1993, ApJ, 415, 93
- [23] Hoernes, P., Berkhuijsen, E. M., Xu, C., 1998, A&A, 334, 57
- [24] Hughes, A., Wong, T., Ekers, R., Staveley-Smith, L., Filipovic, M., Maddison, S., Fukui, Y., Mizuno, N., 2006, MNRAS, 370, 363
- [25] Isobe, T., Feigelson, E. D., Akritas, M. G., Babu, G. J., 1990, ApJ, 364, 104
- [26] Kardasev, N. S., 1962, SvA, 6, 317
- [27] Karachentsev, I. D., Sharina, M. E., Huchtmeier, W. K., 2000, A&A, 362, 544
- [28] Karachentsev, I. D., Sharina, M. E., Dolphin, A. E., et al., 2002, A&A, 385, 21
- [29] Karachentsev, I. D., Sharina, M. E., Dolphin, A. E., et al., 2003, A&A, 398, 467
- [30] Kennicutt, Jr., R. C., 1998, ARAA, 36, 189
- [31] Kennicutt, Jr., R. C., Armus, L., Bendo, G., et al. 2003, PASP, 115, 928
- [32] Kim, J., Balsara, D., Mac Low, M.-M., 2001, JKAS, 34, 333
- [33] Knapen, J. H., Stedman, S., Bramich, D.-M., Folkes, S. L., Bradley, T. R., 2004, A&A, 426, 1135
- [34] Leroy, A. K., Walter, F., Bigiel, F., et al. 2009, AJ, 137, 4670
- [35] Moffet, A. T., 1975, Stars and Stellar Systems Vol IX, Univ. Chicago Press, p211
- [36] Murgia, M., Helfer, T. T., Ekers, R., Blitz, L., Moscadelli, L., Wong, T., Paladino, R., 2005, A&A, 437, 389
- [37] Murphy, E. J. et al., 2006a, ApJ, 638, 157
- [38] Niklas, S., Beck, R., 1997, A&A, 320, 54
- [39] Paladino, R., Murgia, M., Helfer, T. T., et al., 2006, A&A, 456, 847
- [40] Paladino, R., Murgia, M., Orr, E., 2009, A&A, 503, 747
- [41] Price, R., Duric, N., 1992, ApJ, 401, 81
- [42] Rieke, G., et al., 2004, ApJS, 154, 25
- [43] Tabatabaei, F. S., Beck, R., Krause, M., et al. 2007a, A&A, 466, 509
- [44] Tabatabaei, F., Beck, R., Krugel, E., Krause, M., Berkhuijsen, E. M., Gordon, K. D., Menten, K. M. 2007b, A&A, 475, 133
- [45] Thompson, T. A., Quataert, E., Waxman, E., Murray, N., Martin, C. L., 2006, ApJ, 645, 186
- [46] de Vaucouleurs, G., et al. 1991, Third Reference Catalogue of Bright Galaxies (Berlin: Cambridge University Press)
- [47] van der Kruit, P. C., 1971, A&A, 15, 110
- [48] van der Kruit, P. C., 1973, A&A, 29, 263
- [49] Wunderlich, E., Wielebinski, R., Klein, U., 1987, A&AS, 1987, 69, 487
- [50] Xu, C., 1990, ApJ, 365, L47
- [51] Xu, C., Klein, U., Meinert, D., Wielebinski, R., Haynes, R. F., 1992, A&A, 257, 47
- [52] Xu, C., Helou, G., 1996, ApJ, 456, 163
- [53] Yun, M. S., Reddy, N. A., Condon, J. J., 2001, ApJ, 554, 803