Optical/near-infrared selection of red QSOs: Evidence for steep extinction curves towards galactic centers? Thanks: Based on observations collected at the European Organisation for Astronomical Research in the Southern Hemisphere, Chile, under program 088.A-0098, and on observations made with the Nordic Optical Telescope, operated on the island of La Palma jointly by Denmark, Finland, Iceland, Norway, and Sweden, in the Spanish Observatorio del Roque de los Muchachos of the Instituto de Astrofisica de Canarias.
Abstract
We present the results of a search for red QSOs using a selection based on optical imaging from SDSS and near-infrared imaging from UKIDSS. Our main goal with the selection is to search for QSOs reddened by foreground dusty absorber galaxies. For a sample of 58 candidates (including 20 objects fulfilling our selection criteria that already have spectra in the SDSS) 46 (79%) are confirmed to be QSOs. The QSOs are predominantly dust-reddened except a handul at redshifts . However, the dust is most likely located in the QSO host galaxies (and for two the reddening is primarily caused by Galactic dust) rather than in intervening absorbers. More than half of the QSOs show evidence of associated absorption (BAL-absorption). 4 (7%) of the candidates turned out to be late-type stars, and another 4 (7%) are compact galaxies. We could not identify the 4 remaining objects. In terms of their optical spectra the QSOs are similar to the QSOs selected in the FIRST-2MASS red Quasar survey except they are on average fainter, more distant and only two are detected in the FIRST survey. As is usually done we estimate the amount of extinction using the SDSS QSO template reddened by SMC-like dust. It is possible to get a good match to the observed (restframe ultraviolet) spectra, but it is not possible to match the observed near-IR photometry from UKIDSS for nearly all the reddened QSOs. The most likely reasons are that the SDSS QSO template is too red at optical wavelengths due to contaminating host galaxy light and that the assumed SMC extinction curve is too shallow. Three of the compact galaxies display old stellar populations with ages of several Gyr and masses of about 1010 M⊙ (based on spectral-energy-distribution modeling). The inferred stellar densities in these galaxies exceed 1010 M⊙ kpc-2, which is among the highest measured for early type galaxies. Our survey has demonstrated that selection of QSOs based on near-IR photometry is an efficient way to select QSOs, including reddened QSOs, with only small contamination from late-type stars and compact galaxies. This will be useful with ongoing and future wide-field near-IR surveys such as the VISTA and EUCLID surveys.
Keywords:
galaxies: active — quasars: generalI Introduction
QSO absorption line studies have led to major progress in our understanding of the intergalactic medium (IGM) and of early galaxies [48, 64]. Using high-resolution spectroscopy of Damped Lyman- Absorbers (DLAs) detected against the light of background QSOs the chemical enrichment in galaxies has been probed over most of cosmic history [47, e.g.,]. However, in order to interpret the available data it is important to understand to which extent the data are biased against dusty and hence likely more metal-rich sightlines. This issue has been discussed extensively in the literature for more than 30 years [65, 43, 44, 62, 60, 46, 8, e.g.,]. One approach by which to gauge the importance of the dust bias is to establish the absorption statistics from a radio selected sample of QSOs. This approach has been followed both in the CORALS survey [7, 6] and the UCSD survey [28]. The largest of those studies is the UCSD survey, which includes the CORALS data. These authors conclude that while a dust bias is probably a minor effect, a four times larger sample is needed to absolutely confirm an absence of significant dust bias. The later study of Pontzen & Pettini [46] confirm that dust-bias is likely to be a small effect, but they also find that the cosmic density of metals as measured from DLA surveys could be underestimated by as much as a factor of 2 due to dust bias. A factor of 2 is a sufficiently large deficit that it is interesting to pursue this issue further.
There is positive evidence that dust bias does systematically remove the most metal rich absorbers form the samples. The first direct evidence came with the study by Pei et al. [43] that the spectra of QSOs with DLAs on average are redder than the spectra of QSOs without intervening DLAs. This work has been somewhat controversial as some studies confirmed the finding while other works rejected it [34, 10, 30, e.g.,]. The latest work of Khare et al. [30] does seem to find robust evidence for significant statistical excess reddening of QSOs with foreground DLAs. Although it is difficult to unambiguously establish excess reddening in individual sight-lines to QSOs as the intrinsic slope cannot be determined a priori there are also convincing detections of reddening towards individual systems with foreground DLAs, sub-DLAs or strong metal-line absorbers [40, 41, 29, 12, 39, 27]. Some of these QSOs have colors that place them on the edge of or outside of the SDSS QSO color selection. It is therefore reasonable to expect that there may be a significant population of metal-rich absorbers that are under-represented in the current DLA samples.
Motivated by the detection of the reddened QSOs towards metal-rich absorbers mentioned above we decided to carry out a search for QSOs with red colors in order to establish if some fraction of red QSOs could be red due to dusty foreground absorbers. The search for red QSOs also has a long history [63, 4, 62, 19, 14, 22, 16, 32, 56, 2, 17, e.g.,]. The detection of red QSOs in most of these works relied on either radio or X-ray detections [see 62, for an extensive discussion]. However, recently large area surveys in the near-infrared has made it possible to select QSOs based on near-infrared photometry alone [62, 61, 45] and this is the approach we have adopted in this work. In Sect. II we present our selection criteria. In Sect. III and Sect. IV we describe our observations and analysis of the first sample of candidate red QSOs selected in the regions of the sky covered both by UKIDSS and SDSS (primarily stripe 82).
II Selection criteria
Rather than trying to build an unbiased sample our approach is to make a tailored search for red QSOs. Our goal is to make a selection of QSOs that are redder than the reddened QSO Q 0918+1636 studied by Fynbo et al. [12] in the SDSS and colors. In our selection we take advantage of a recent comprehensive study of the near-IR colors of QSOs found by matching SDSS and UKIDSS catalogs [45]. Based on this study we select from regions on the sky covered both by SDSS and UKIDSS (mainly stripe 82) point sources (classified as such both in UKIDSS and SDSS) with 0.24 (corresponding to 1.2) and 0.1 (corresponding to 2). This leads to an efficient selection of QSOs and a sufficiently robust rejection of stars. In order to select reddened QSOs we next impose and . The limit comes from the fact that we wish to avoid objects that are too red and hence too faint in the optical to allow the detection of the Lyman- forest and in particular DLAs. We demand in order to have sufficient signal to allow for spectroscopy in the optical (i.e. again to establish the presence of DLA and metal lines). We initially added a color cut of based on previous experience that sources with had problems with the photometry in UKIDSS. However, we subsequently dropped this criterion as some QSOs do have , in particular at redshifts between 2 and 3.
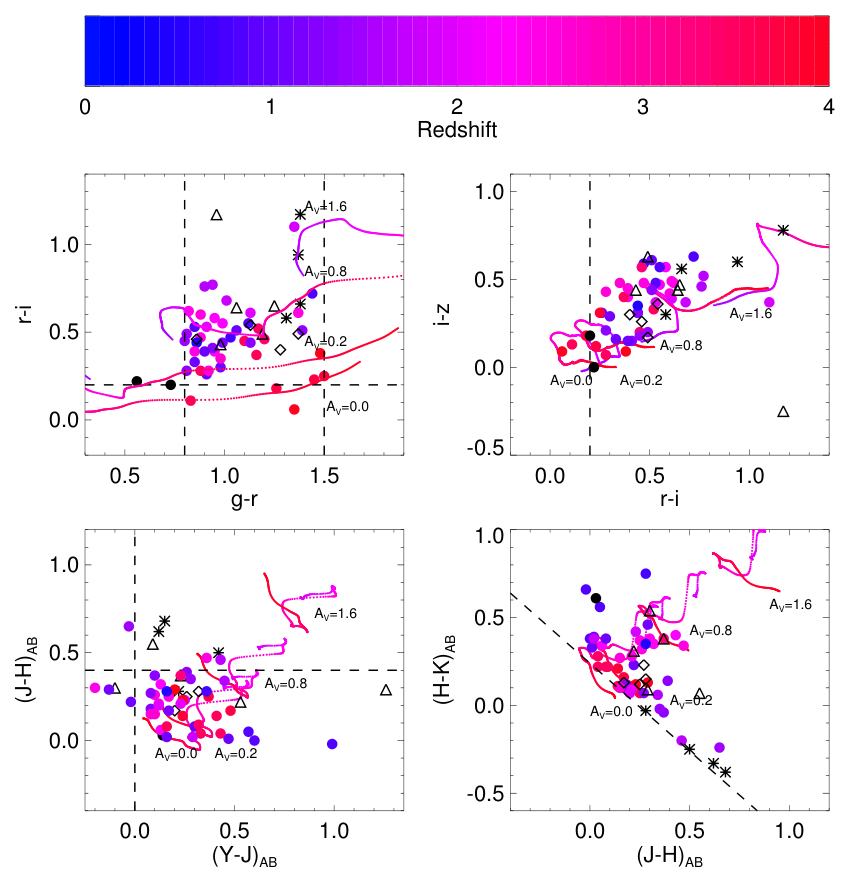
We found that 54 sources in the overlapping region of UKIDSS and SDSS in stripe 82 fulfill these selection criteria (see Fig. 1).
By combining the star/galaxy classifiers based on the images in both the SDSS and the UKIDSS Large Area Survey we are able to very efficiently remove compact galaxies from our sample of candidates. We tested the efficiency of galaxy removal from our sample with a set of 72464 objects with both Sloan spectra and UKIDSS photometry. Out of the 39814 objects we selected as point sources, only 69 (0.2%) are galaxies based on the SDSS spectrum. Therefore, our sample should contain less than 1 galaxy. Moreover, only 29 out of more than 30000 objects spectroscopically classified as stars in the overlapping region with the UKIDSS equatorial block (which is almost 10 times larger than stripe 82) data fulfill our selection criteria. Finally, we looked at the spectroscopically confirmed SDSS QSOs with UKIDSS photometry selected in an area of about 1500 square degrees and only 36 (out of 21174) satisfied our criteria. Of these, the majority are either BAL QSOs or red QSOs at . Interestingly, one of these QSOs is a red QSOs with an intervening DLA - the exact systems we are looking for (SDSS J125306.73+130604.9). Given that stripe 82 has an area of only 250 square degrees we expect that our 54 candidates will have a different mix of BAL QSOs and dust reddened QSOs. Independent of their nature this survey will reveal the nature of a group of QSOs that are missed in most QSO surveys so far.
III Observations and Data reduction
In order to confirm or reject the candidate red QSOs we have carried out three runs of spectroscopic follow-up of the candidates. In order to use observing nights optimally we selected 7 additional targets at right ascensions around 8 hr with both SDSS and UKIDSS coverage. We also observed a single source with and 4 sources that do not fulfill the rAB - iAB 0.2 color criterion.
In August 2011 and January 2012 we observed 8 candidates at the Nordic Optical Telescope (NOT) on La Palma equipped with the Andalucia Faint Object Spectrograph and Camera (Alfosc). At the NOT we used grism 4, which covers the wavelength range from about 3800 Å to 9000 Å at a resolution of about 350. Redwards of about 7000 Å the spectra are strongly affected by fringing so the effective useful wavelength range for faint sources only extends to about 7000 Å. In November 2011 we observed another 40 candidates using the New Technology Telescope (NTT) at La Silla (ESO) equipped with the ESO Faint Object Spectrograph and Camera 2 (EFOSC2). At the NTT we used grism 6, which covers the wavelength range 3800-7980 Å at a resolution of about 450. This grism suffers from significant 2nd order contamination redwards of 6200 Å. Unfortunately we only realized this after the observing run so no order sorter filter was used during the observations. The spectra were taken aligning the slit at the parallactic angle. After the release of SDSS DR8 we found that 20 of our candidates have been observed by SDSS and of these 10 were also observed by us. In total we have spectra, either from our run or from the SDSS, of 58 objects. Of these, 11 are not in our main sample (i.e., outside stripe 82, have rAB - iAB < 0.2 or ). For 10 of our main targets from stripe 82 we were unable to secure a spectrum during the mentioned two observing runs.
The full list of observed targets is provided in Table 1. Observing conditions during the three runs appeared to be photometric, but with strongly variable seeing. In particular on the first two nights of the NTT run the seeing was poor (1.5–2.5 arcsec), whereas the seeing during the last night of the NTT run and during both NOT runs was below 1 arcsec. During the two nights with poor seeing we used slits with widths 1.5 and 2.0 arcsec, but we still had significant slitloss. Based on the photometric measurements from SDSS we estimate that the slitloss was predominant between 30% - 50%. However, the slit loss was for some sources significant: the spectral flux was suppressed by more than a factor of two.
| Target | RA(J 2000) | Dec(J 2000) | rSDSS | Telescope | Exptime |
|---|---|---|---|---|---|
| (mag) | (Sec) | ||||
| CQ2143+0022 | 21 43 17.43 | +00 22 11.0 | 19.63 | SDSS | |
| CQ2144+0045 | 21 44 26.03 | +00 45 17.0 | 17.36 | NOT | 1200 |
| CQ2217+0033 | 22 17 14.27 | +00 33 46.5 | 20.16 | NTT | 1200 |
| CQ2227+0022 | 22 27 45.19 | +00 22 16.8 | 20.21 | NTT,SDSS | 1200 |
| CQ2241+0115 | 22 41 19.65 | +01 15 16.3 | 20.61 | NTT | 1800 |
| CQ22410012 | 22 41 15.86 | 00 12 39.8 | 21.12 | NTT,SDSS(DR9) | 2400 |
| CQ2254000111rAB - iAB < 0.2 | 22 54 19.23 | 00 01 55.1 | 19.57 | NTT,SDSS(DR9) | 900 |
| CQ2306+0108 | 23 06 39.65 | +01 08 55.2 | 19.36 | NTT,SDSS | 900 |
| CQ2316+0023 | 23 16 59.35 | +00 23 19.4 | 20.26 | NTT | 1200 |
| CQ23240105 | 23 24 31.32 | 00 53 42.6 | 21.18 | NTT | 1200 |
| CQ2342+0043 | 23 42 20.14 | +00 43 43.5 | 20.49 | NTT | 1200 |
| CQ23440001 | 23 44 58.71 | 00 01 38.7 | 19.92 | NTT | 1200 |
| CQ23470109 | 23 47 07.41 | 01 09 03.5 | 19.34 | SDSS | |
| CQ2355+0007 | 23 55 21.48 | +00 07 19.2 | 20.19 | NTT | 1200 |
| CQ23550041 | 23 55 26.78 | 00 41 54.2 | 19.36 | NOT,SDSS | 2000 |
| CQ00090020 | 00 09 33.18 | 00 20 22.3 | 19.42 | NTT | 900 |
| CQ0022+0020 | 00 22 55.07 | +00 20 55.1 | 20.57 | NTT | 2000 |
| CQ0027001911rAB - iAB < 0.2 | 00 27 58.75 | 00 19 23.7 | 19.20 | NOT,SDSS | 800 |
| CQ0043+0000 | 00 43 27.46 | +00 00 02.0 | 19.82 | SDSS | |
| CQ00460011 | 00 46 31.21 | 00 11 46.1 | 20.58 | NTT,SDSS(DR9) | 1200 |
| CQ0105+0000 | 01 05 03.39 | +00 00 34.1 | 20.12 | NTT | 1000 |
| CQ0107+0016 | 01 07 07.86 | +00 16 06.1 | 20.15 | NTT | 1000 |
| CQ0127+0114 | 01 27 02.52 | +01 14 12.6 | 17.83 | NOT | 600 |
| CQ01290059 | 01 29 25.80 | 00 59 00.1 | 19.33 | NTT | 900 |
| CQ0130+0013 | 01 30 11.42 | +00 13 14.5 | 19.29 | SDSS | |
| CQ0202+0010 | 02 02 48.74 | +00 10 46.5 | 20.91 | SDSS | |
| CQ0211+0030 | 02 11 53.71 | +00 30 45.9 | 20.23 | NTT | 1800 |
| CQ02120023 | 02 12 26.85 | 00 23 14.2 | 21.25 | NTT | 2400 |
| CQ02200107 | 02 20 07.65 | 01 07 31.0 | 18.54 | NTT,SDSS(DR9) | 900 |
| CQ0222001911rAB - iAB < 0.2 | 02 22 23.13 | 00 19 38.7 | 19.18 | NTT,SDSS(DR9) | 1000 |
| CQ02290029 | 02 29 07.71 | 00 29 09.5 | 20.27 | SDSS | |
| CQ0239+0115 | 02 39 24.90 | +01 15 15.6 | 20.56 | NTT | 2400 |
| CQ02420000 | 02 42 30.65 | 00 00 29.6 | 19.50 | NTT | 900 |
| CQ02470052 | 02 47 17.29 | 00 52 05.8 | 20.27 | NTT | 1500 |
| CQ0255+0048 | 02 55 18.58 | +00 48 47.55 | 19.02 | SDSS | |
| CQ0303+0105 | 03 03 40.01 | +01 05 57.3 | 19.73 | NTT,SDSS | 1200 |
| CQ0310+0055 | 03 10 36.84 | +00 55 21.71 | 19.73 | SDSS | |
| CQ0311+0103 | 03 11 42.35 | +01 03 55.2 | 20.12 | NTT,SDSS | 1200 |
| CQ0312+0032 | 03 12 14.24 | +00 32 35.2 | 19.42 | NTT | 900 |
| CQ0312+0035 | 03 12 13.37 | +00 35 54.6 | 19.81 | NTT | 1200 |
| CQ03210105 | 03 21 18.21 | 01 05 39.9 | 18.38 | SDSS | |
| CQ0326+0106 | 03 26 03.80 | +01 06 03.9 | 20.30 | NTT,SDSS | 1500 |
| CQ0327+0006 | 03 27 55.04 | +00 06 15.9 | 19.94 | NTT | 1200 |
| CQ03290057 | 03 29 19.89 | 00 57 15.5 | 19.98 | NTT,SDSS | 1200 |
| CQ03320013 | 03 32 48.39 | 00 13 15.3 | 19.71 | NTT | 1200 |
| CQ0336+0112 | 03 36 59.45 | +01 12 39.2 | 20.91 | NTT | 2400 |
| CQ0338+0004 | 03 38 06.76 | +00 04 33.9 | 20.02 | SDSS | |
| CQ0339+002222J | 03 39 27.11 | +00 22 41.8 | 20.39 | NTT | 1200 |
| CQ03500031 | 03 50 53.29 | 00 31 14.7 | 19.83 | NOT,SDSS | 2000 |
| CQ03540012 | 03 54 18.16 | 00 12 56.7 | 19.14 | NTT | 4000 |
| CQ03540030 | 03 54 46.04 | 00 30 29.5 | 20.36 | NOT | 1800 |
| CQ0822+000433Not in stripe 82. | 08 22 49.97 | +00 04 32.2 | 19.92 | NTT | 900 |
| CQ0822+043533Not in stripe 82. | 08 22 02.32 | +04 35 26.0 | 19.50 | NOT | 1800 |
| CQ0826+072833Not in stripe 82. | 08 26 24.71 | +07 28 20.8 | 20.09 | NOT | 1800 |
| CQ0831+093033Not in stripe 82. | 08 31 42.36 | +09 30 29.8 | 19.56 | NTT | 900 |
| CQ0831002233Not in stripe 82. | 08 31 26.43 | 00 22 26.7 | 19.57 | NTT | 900 |
| CQ0832+012133Not in stripe 82. | 08 32 29.34 | +01 21 05.4 | 19.80 | NTT | 1200 |
| CQ0832+060633Not in stripe 82. | 08 32 29.02 | +06 06 00.6 | 19.73 | NTT | 1200 |
The spectra were processed using standard techniques for bias and flat-field corrections and for wavelength calibration. Cosmic-rays were removed using the software developed by van Dokkum [57]. 1-dimensional spectra were extracted using the optimal extraction technique described by Horne [23] as implemented in IRAF11 1 IRAF is distributed by the National Optical Astronomy Observatory, which is operated by the Association of Universities for Research in Astronomy (AURA) under cooperative agreement with the National Science Foundation.. The spectra were first flux calibrated using observations of the spectrophotometric standard star Feige110 observed on the same nights as the science spectra. However, as the standard star observed for the NTT run is very blue (it is a white dwarf) it had strong 2nd order contamination. Our targets, on the other hand, are red by selection and hence have week 2nd order contamination. This flux calibration made the flux-calibrated spectra appear too blue at Å compared to the existing SDSS photometric measurements for the objects. We hence decided to use a red spectrophotometric standard observed on the 3rd of June 2011 (LTT7379). Flux-calibrating the NTT spectra using this standard star resulted in better agreement with the existing SDSS photometry, but our NTT spectra still appear sligthly too blue redward of 6200 Å. Blueward of 6200 Å the responses inferred using the two different standard stars were in agreement to better than 10 percent.
The spectra were corrected for Galactic extinction using the extinction maps from Schlegel et al. [51]. Most of the sources have low Galactic extinction, but 8 have and of these two have .
On February 9 and 10 2012 we observed the field of Q 09181636 in the near-IR using the NOT equipped with the near-IR camera NOTCam in the , , and bands. The purpose of this observations was to infer if this object, which basically is the motivation for our QSO search, has near-IR colours consistent with our selection criteria. For photometric calibation we observed the field of RU149 for which , and photometry is available in Hunt et al. [24] and -band photometry is available in the UKIDSS survey [21].
IV Results
IV.1 Photometry
For Q 09181636 we derive the following magnitudes on the AB system: , , and . In terms of its near-IR colours it falls well-within the near-IR color criteria of our sample.
IV.2 Spectroscopy
In Fig. 6 in Appendix A we show the 1-dimensional spectra of the 58 candidates observed either by us or SDSS. In these diagrams we plot both spectra and the photometry from SDSS (, , , ) and UKIDSS (, , , and ). With the exception of four the nature of the sources can be established robustly. In Table 2 we provide our classification of the candidates in the cases where it could be established. We also provide the SDSS QSO selection flags as defined in Table 1 of Richards et al. [49]. We find four of the candidates to be late-type stars, four are compact galaxies, 46 are most likely QSOs and for four candidates we were not able to establish the nature of the object.
For each QSO we determine redshifts by visually matching the spectrum with the template spectrum of Vanden Berk et al. [59] and Telfer et al. [54] including reddening using the SMC, LMC or MW extinction curves as prescribed in Pei [42]. We here follow the approach of Urrutia et al. [56]. We assume that the dust is located at the redshift of the QSO as we find no evidence for absorber galaxies that could be responsible for the reddening. The inferred amounts of extinction should only be considered indicative for a number of reasons. As mentioned, the flux-calibration of our NTT spectra is affected by 2nd order contamination, which as discussed will tend to make the NTT spectra appear too blue. For 10 targets we have either NTT or NOT spectra and an SDSS spectrum. For those cases the inferred amounts of extinction are typically slightly higher in the SDSS spectra. In Table 2 we provide the redshifts and the amount of extinction derived in this way.
For the majority of the candidate spectra the QSO template reddened by an SMC-like extinction curve provide a good match to the data in the observed optical range. However, the reddened QSO template provides a poor match to the near-IR photometry from UKIDSS in most cases. We will return to this point in Sect. V.1.
In Appendix B we provide our notes on each spectrum.
IV.3 The confirmed QSOs
The 46 confirmed QSOs are distributed broadly in redshift from to . There is a curious lack of QSOs between and , which is unfortunate as this is the redshift range we are primarily interested in for the detecting of dusty intervening DLAs. The QSOs at appear relatively normal, i.e. similar to the QSO template, and they have entered our selection due to their strong Lyman- forest blanketting. Two confirmed QSO are relatively normal QSOs that are primarily reddened by substantial Galactic extinction.
At the majority of the remaining confirmed QSOs deviate from the QSO template, in addition to their redder spectra, either by showing BAL features or a combination of broad and narrow emission lines (e.g., CQ2342+0043 where C III is broad and C IV is narrow). This fact suggests that the source of the reddening is likely to be at the QSO redshift rather than in intervening galaxies. There is also no evidence for either strong metal-line absorbers nor intervening galaxies close to the line-of-sight in the imaging data.
In Fig. 3 we show how the derived distribute with redshift for the confirmed QSOs in our sample. As mentioned, these measurements are mainly indicative, but other surveys have determined in a similar manner [56, e.g.,] and hence the values are still interesting for comparison. With red and blue symbols we show the upper and lower limits on , respectively, calculated using our color cuts in and by using the QSO template reddened by the SMC extinction curve. Many of the points fall below the blue curve, presumably due to an extra reddening caused by the fact that the emission lines are absorbed, but also due to the problem with flux calibration of our NTT spectra mentioned above.
| Target | SDSS_flag | Type | Redshift | |
|---|---|---|---|---|
| CQ2143+0022 | QSO_CAP | QSO | 1.26 | 0.55 |
| CQ2144+0045 | none | M-dwarf | ||
| CQ2217+0033 | none | M-dwarf | ||
| CQ2227+0022 | none | QSO | 2.23,2.24 | 0.4,0.8 |
| CQ2241+0115 | QSO_HIZ | unknown | ||
| CQ22410012 | QSO_HIZ | QSO | ||
| CQ22540001 | QSO_HIZ | QSO | 3.69,3.71 | 0.0 |
| CQ2306+0108 | STAR_CARBON, QSO_HIZ | QSO | 3.65,3.64 | 0.15,0.0 |
| CQ2316+0023 | none | QSO | 2.1? | |
| CQ23240105 | none | QSO | 2.25? | |
| CQ2342+0043 | QSO_REJECT | QSO | 1.65,1.65 | 0.8,1.1 |
| CQ23440001 | none | QSO | 1.04 | 0.5 |
| CQ23470109 | QSO_SKIRT | QSO | 1.08 | 0.80 |
| CQ23550041 | QSO_HIZ | QSO | 1.01,1.01 | 1.0,1.6 |
| CQ2355+0007 | none | unknown | ||
| CQ00090020 | none | Galaxy | 0.387 | |
| CQ0022+0020 | none | QSO | 0.80? | 1.9 |
| CQ00270019 | QSO_CAP, QSO_HIZ | QSO | 3.52,3.52 | 0.0,0.0 |
| CQ0043+0000 | QSO_FIRST_CAP | STAR? | ||
| CQ00460011 | none | QSO | 2.44,2.467 | 0.3 |
| CQ0105+0000 | none | Galaxy | 0.278 | |
| CQ0107+0016 | none | QSO | 2.47 | 0.6 |
| CQ0127+0114 | QSO_FIRST_CAP | QSO | 1.16,1.14 | 1.1,1.1 |
| CQ01290059 | QSO_FIRST_CAP, QSO_HIZ | QSO | 0.71 | 1.5 |
| CQ0130+0013 | QSO_REJECT | QSO | 1.05 | 0.8 |
| CQ0202+0010 | QSO_REJECT, QSO_HIZ | QSO | 1.61 | 0.9 |
| CQ0211+0030 | ROSAT_D, ROSAT_E | QSO | 3.45 | 0.30 |
| CQ02120023 | QSO_REJECT | QSO | 1.87? | 1.2 |
| CQ02200107 | none | QSO | 3.43,3.467 | 0.0 |
| CQ02220019 | QSO_HIZ | QSO | 3.95,3.947 | 0.0 |
| CQ02290029 | QSO_FAINT, QSO_HIZ | QSO | 2.14,1.97 | 1.40 |
| CQ0239+0115 | QSO_REJECT | QSO? | 0.867 | 1.70 |
| CQ02420000 | STAR_CARBON, QSO_HIZ | QSO | 2.48 | 0.30 |
| CQ02470052 | none | QSO | 0.825 | 1.5 |
| CQ0255+0048 | QSO_HIZ | QSO | 4.01 | 0.0 |
| CQ0303+0105 | QSO_HIZ | QSO | 3.45 | 0.0 |
| CQ0310+0055 | QSO_FAINT, QSO_HIZ | QSO | 3.78 | 0.0 |
| CQ0311+0103 | QSO_FAINT, QSO_HIZ | QSO | unknown, 3.27 | 0.30? |
| CQ0312+0032 | none | QSO | 1.25 | 0.8 |
| CQ0312+0035 | none | QSO | 1.28 | 0.8 |
| CQ03210105 | QSO_HIZ | QSO | 2.40 | 0.7 |
| CQ0326+0106 | SERENDIP_DISTANT | QSO | 0.85,0.85 | 1.0,1.3 |
| CQ0327+0006 | none | QSO | 3.50 | 0.15 |
| CQ03290057 | SERENDIP_MANUAL | QSO | 1.31,1.31 | 1.1,1.4 |
| CQ03320013 | none | QSO | 0.438 | 1.0 |
| CQ0336+0112 | none | M-dwarf | ||
| CQ0338+0004 | QSO_CAP | QSO | 1.45 | 0.6 |
| CQ0339+0022 | none | QSO | 1.41 | 0.5 |
| CQ03500031 | QSO_CAP | QSO | 2.00,2.00 | 0.4,0.4 |
| CQ03540012 | none | QSO | 2.45 | 0.0 |
| CQ03540030 | none | QSO | 1.00 | 0.3 |
| CQ0822+0004 | QSO_HIZ | Galaxy | 0.378 | |
| CQ0822+0435 | none | M-dwarf | ||
| CQ0826+0728 | none | QSO | 1.77 | 0.6 |
| CQ0831+0930 | none | QSO | 1.96 | 0.75 |
| CQ08310022 | none | QSO | 2.53 | 0.23 |
| CQ0832+0121 | none | Galaxy | 0.166 | |
| CQ0832+0606 | none | QSO | 2.57 | 0.4 |
IV.4 Stars
Based on Hewett et al. [21, their Table 9] M-dwarfs are expected to have corresponding to . In the compilation of Hewett et al. [21] there is one exception, namely an M8.5 dwarf with . In the lower right panel of Fig. 2 the four stars in our survey all lie very close to the cut-off in . The colors and spectra of the two stars that are M-dwarfs indicate that they are relatively early type M-dwarfs (from M0 to M6) for which . They have presumably entered our sample either due to photometric errors or due to infrared excess emission, i.e. from circumstellar disks.
IV.5 Galaxies
Three of the four galaxies we have identified are old and very compact stellar systems (CQ0105+0000, CQ0822+0004, and CQ0832+0121). The fourth object identified as a galaxy, CQ00090020, displays strong forbidden Oxygen and Neon emission lines. It also seems to have a relatively old underlying stellar continuum with a clear 4000-Å break. The galaxy fraction among our candidates is somewhat higher than expected, but is still sufficiently low that galaxy contamination is not a major obstacle for QSO searches based on this method.
V Discussion and Conclusions
V.1 Implications for QSO searches
79% of our candidate dust-reddened QSOs are confirmed QSOs. The contamination from stars and compact galaxies are each about 7% and the remaining 7% remains unclassified. The confirmed QSOs have a very broad redshift range from 0.4 to 4.0. Most of the QSOs appear significantly dust-reddened with an amount of extinction broadly consistent with our color-selection criterion on . In most cases the spectral shape of the QSOs in the observed optical range can be well-matched by the template QSO spectrum reddened by an SMC-like extinction curve assuming that the dust is at the QSO redshift. However, that same model fails for most of the reddened QSOs in the near-IR. We consider the two most likely reasons for this failure in the following. First, there is a problem with the QSO template which, as also discussed by Vanden Berk et al. [59], most likely contains significant contamination from host galaxy light redward of 5000 Å. Second, it is plausible that the SMC extinction curve is too shallow. There is growing evidence that the extinction curve towards the Galactic center is significantly steeper in the optical and near-IR than the standard MW extinction curve parametrisation [52, 37, 38, 18, e.g.,]. Given that we obviously also probe regions towards galactic centers it is plausible that these environments have dust with similar extinction properties, i.e. very steep extinction curves, as towards the Galactic center. Steep extinction curves have also been identified against GRB afterglow light [67].
To investigate the role of the QSO template we follow Jian-Guo et al. [27] and build a template by merging the Vanden Berk et al. [59] template at Å with the Glikman et al. [15] near-IR template at Å. In Fig. 4 we compare this template with the Vanden Berk et al. [59] template and with the QSO templates from Richards et al. [50]. As can be seen, the templates agree well in the reframe UV, but at Å the Vanden Berk et al. [59] template clearly has excess light presumably due to host contamination. In Fig. 5 we re-plot the spectrum of CQ0127+0114 (here the SDSS spectrum) and attempt to match its spectral-energy-distribution using the merged QSO template described above. As can be seen here, we can match the optical and near-IR sections separately with different amounts of extinction, but not the full spectral range. We plan to investigate the second point, i.e. the question if an extinction curve similar to that observed towards the Galactic centre can be inferred from our spectra, further in a future work.
More than half of the confirmed QSOs show signs of associated absorption (BAL, low-BALs, P-Cygni profiles) or unusual emission line profiles, i.e. broad C III emission and narrow C IV emission (e.g., CQ2342+0043, CQ0826+0728).
It is interesting to compare our confirmed QSOs with the QSOs identified in the FIRST-2MASS red Quasar survey of Urrutia et al. [56]. Their survey is targeting point sources detected by both FIRST and 2MASS, whereas only two of our targets are FIRST sources and the majority of our targets are too faint to be detected by 2MASS. For these reasons, the QSOs in our sample extend out to higher redshifts than the QSOs in the FIRST-2MASS survey. The FIRST-2MASS QSO color distribution is relatively wider. As an example, ranges from 0 to 2.5 for the FIRST-2MASS QSOs, compared to our (selected) range of colors, . Our study confirms their finding that QSOs with BAL-features are very common among dust-reddened QSOs and extend the result to QSOs at higher redshifts. A study of point sources selected only by and a -band limit of about 19 would be very interesting as it would give a broad census of the AGN population at . The many AGN with are predominantly at low redshift (where the host galaxy contributes to the near-IR photometry) or at , where the Mg II emission enters the -band. Here it is also interesting that Banerji et al. [2] have done a study of point sources from UKIDSS and these are all heavily reddened QSOs.
The incompleteness of classic color/morphology selection techniques of QSO samples was also addressed by the purely magnitude limited VVDS QSO sample [13, 5] where it was shown that faint QSO samples may miss up to 35% of the population due partly to the color selection and partly to the requirement that the candidates must be point-sources. We have shown here that at least part of this missed population can be understood as dust-reddened QSOs.
About half of our confirmed QSOs were not flagged as QSOs based on the SDSS photometry and our survey therefore provides some insight into the completeness of the SDSS QSO catalog. In total, there are 10925 spectroscopically confirmed quasars in Stripe82 in DR8, the latest data release. However, only for a subset of these is UKIDSS photometry available. Of the spectroscopically confirmed quasars in Stripe82 with UKIDSS photometry 2246 have . Of these only 927 are point sources in both UKIDSS and SDSS. Only 14 of the 927 fullfil our additional color criteria. We have in this survey detected 45 QSOs with in stripe 82 and of these only 4 were already spectroscopically confirmed by SDSS. Hence, it is clear that SDSS is incomplete for red QSOs, but these constitute a tiny fraction of all QSOs with .
Finally, we note that a very similar study to ours, i.e. a QSO search based on SDSS and UKIDSS photometry, has recently been submitted for publication [66]. Their study has a slightly different aim, namely a targetted search for QSOs at - 3.5.
V.2 Implications for QSO host galaxies
Our survey has found that there exists a subsample of dust-reddened QSOs which is missed by classic QSO selection methods. This result is consistent with those of Gavignaud et al. [13] and Urrutia et al. [56].
We have further found that the reddening is in general caused by the QSO host galaxy rather than intervening absorbers, and that the reddened galaxies only make up a comparatively small fraction of the underlying QSO host galaxy population. The implication is that either QSO host galaxies in general contain very little dust, or the QSO itself is able to create a dust-free sightline along the emission cone.
From Fig. 3 it is seen that there is an apparent drop in the number of reddened hosts at redshifts larger than (note that the green points in Fig. 3 do not belong to the sample). At redshifts larger than our color selection is not well tuned to find reddened QSOs, but in the range our selection is tuned for in the range 0.2 to 0.8 and we find only a single reddened host at . At redshifts around 1-2 our sample contains 16-17 reddened hosts per unit redshift so the sudden drop at to 1.1 per unit redshift appears to be significant. This could possibly indicate that QSO host galaxies at contain less dust than those below . A similar result has been reported for high redshift galaxies selected by their Ly emission line [36] where it was found that there is a significant evolution in the dust properties of Ly emitters from to . In particular it has been found that there is a very sharp transition in the ULIRG fraction of Ly emitters at a redshift of z [35]. The drop we see in the dust properties of QSO hosts at appears to be equally sudden and it is possible that the two observations are related to a common evolutionary event. However, we obviously need a larger sample to confirm this tentative result.
V.3 Implications for the study of compact Galaxies
Three of the galaxies we have detected are old stellar systems (CQ0105+0000, CQ0822+0004, and CQ0832+0121). The spectrum of CQ0822+0004 has Balmer absorption lines and hence most likely has an age of about a Gyr, whereas the other two have older stellar populations. We use the LePhare software [1, 25] to fit to the SDSS + UKIDSS photometry fixing the redshift to the measured values. Based thereon we infer stellar masses and stellar ages of several Gyr (the exact value depending on the assumed metallicity) and masses of the order 1010 M⊙. Interestingly, they are all point sources - even in the -band, where the seeing is about 0.6 arcsec in the UKIDSS images. This implies that the galaxies must have stellar densities in excess of 1010 M⊙ kpc-2, which is similar to the compact Distant Red Galaxies found at redshifts around 2 [58, e.g.,] and among the highest measured at any redshift [11]. However, the stellar masses of the compact galaxies found at high redshifts are significantly larger than for the three galaxies found here. Taylor et al. [53] find that massive, compact galaxies are much rarer in the local Universe than at .
V.4 Dusty DLAs
We did not find any obvious cases of QSOs being reddened by foreground dusty absorbers and this confirms that such absorbers are rare. We are currently working on refining our selection criteria with the goal of selecting fewer strongly reddened QSOs and fewer unreddened QSOs.
As also discussed by Wu et al. [66] the outlook for impending advance for this kind of QSO surveys based on ongoing near-IR surveys like the VISTA suveys [33, 26, 9, e.g.,] or the future EUCLID survey [31] is very good.
Appendix A The spectra
Appendix B Notes on individual objects
B.1 CQ2143+0022 ()
This object is only observed by SDSS where a redshift of is derived (presumably based on two emission lines interpreted as Mg II and C III). The object is a dust-reddened QSO with an estimated amount of extinction corresponding to . The SMC-extinction reddened QSO template provides a good match to the SDSS spectrum and photometry, but it does not match the UKIDSS photometry. This is a problem that is common to most of our spectra of reddened QSOs. In SDSS the source is flagged QSO_CAP.
B.2 CQ2144+0045 ()
This is an M-dwarf. Based on the SDSS photometry the source is not flagged as a QSO.
B.3 CQ2217+0033 ()
This is an M-dwarf. Based on the SDSS photometry the source is not flagged as a QSO.
B.4 CQ2227+0022 ()
This is a reddened QSO observed both by us and by SDSS (SDSS infer a redshift of ). The redshift is based on the detection of (narrow) Ly and (broad) C III in emission and C IV in absorption. It has an estimated extinction of (our spectrum) and 0.5 (SDSS spectrum). In this case the extincted QSO template provides a reasonably good match to the near-IR photometry out to around 5000 Å in the rest frame. Based on SDSS photometry this source is not flagged as a QSO.
B.5 CQ2241+0115 (redshift unknown)
The nature of this object could not be established. It has a narrow emission line at 5258 Å, a tentative narrow line at 6970 Å and a broad emission feature around 6400 Å, but we have not been able to establish the nature of these features. The near-IR photometry shows evidence for an emission line in the band and possibly also in the band. Based on the SDSS photometry this source is flagged as QSO_HIZ.
B.6 CQ22410012 (redshift unknown)
This spectrum is very complex with a mix of broad and narrow absorption lines over the full spectral range covered by the instrument. The colors of the object are peculiar, in particular and are extreme values (see Fig. 2. It is most likely an extreme BAL QSO at [20, e.g.,]. Based on the SDSS photometry this source is flagged as QSO_HIZ. The object is also included in SDSS DR9 (released after our paper was submitted) where a redshift of 0.699 is derived. This redshift appears to be wrong.
B.7 CQ22540001 ()
This is a relatively normal QSO at redshift of with no evidence for excess reddening. Based on SDSS photometry it is flagged as QSO_HIZ. It entered our selection due to its relatively high redshift. The spectrum shows relatively weak Ly, probably due to associated absorption also seen in Ly, Lyman-limit absorption and in the C IV line. The N V line is very strong. The object is also included in SDSS DR9 (released after our paper was submitted) where a redshift of 3.707 is derived.
B.8 CQ2306+0108 ()
This is a QSO at a relatively high redshift of with no evidence for extinction. The spectrum shows somewhat narrower emission lines compared to the template spectrum. In particular, Ly and N V are clearly separated. The source is also observed spectroscopically by SDSS, where a redshift of is derived. The spectrum displays a strong Ly absorber at around 5300 Å that could be damped. There is also Lyman-limit absorption at . Based on the SDSS photometry this object is flagged as STAR_CARBON and QSO_HIZ.
B.9 CQ2316+0023 (?)
This is a BAL QSO, but we have not been able to establish the precise redshift. Given the positions of the main absorption troughs around 5600 Å and 4600 Å we estimate that it is likely close to if these are from Si IV, C IV and Al III. There is a bright emission spike around 3900 Å, which could be the onset of the Ly / N V emission. Based on the SDSS photometry this object is not flagged as a QSO.
B.10 CQ23240105 (?)
The nature of this object has not been securely established. It has a strong absorption feature at 5108 Å and a broad emission line at the very blue end of the wavelength range. There is also a broad emission bump around 6200 Å. A possible solution is a reddened QSO at (i.e. very similar to CQ2227+0022), where the absorption feature is absorption from C IV and the broad emission features are from Ly and C III. Based on the SDSS photometry this object is not flagged as a QSO.
B.11 CQ2342+0043 ()
This is a reddened QSO at with an estimated extinction of . The spectrum displays broad emission lines from Mg II and C III, but a significantly narrower C IV line. The source is also observed spectroscopically by SDSS. From their spectrum we infer a larger amount of extinction (), which also leads to a better match with the band photometry. However, we match the photometry very badly. In SDSS the object is flagged as QSO_REJECT.
B.12 CQ23440001 ()
This is a reddened () QSO at . The redshift is based on the detection of Mg II emission and of the Fe II emission bump redwards of Mg II. In this case we had to invoke the MW extinction curve to match the shape of the spectrum so most likely the dust in this system contains the carriers of the 2175 Å extinction feature. In SDSS the object is not flagged as a QSO.
B.13 CQ23470109 ()
This is a reddened () QSO at observed by SDSS. The redshift is presumably based on the detection of emission lines from Mg II and C III. In SDSS the object is flagged as QSO_SKIRT.
B.14 CQ23550041 ()
This spectrum displays a single emission line, which we interpret as Mg II at . Given that we can get a good match of the shape of the optical spectrum with a reddened QSO template () at this redshift we consider the nature of the object fairly secure. The object is also covered by SDSS where a redshift of is determined. From the SDSS spectrum we infer a larger amount of extinction (). There is a very poor match of the near-IR photometry. In SDSS the object is flagged as QSO_HIZ.
B.15 CQ2355+0007 (unknown redshift)
This is a faint target and we are not able to establish its nature based on our spectrum. The spectrum is much fainter than expected based on the SDSS photometry (by a factor of 6) so either the object is variable or there was a problem with the observation. In SDSS the object is not flagged as a QSO.
B.16 CQ00090020 ()
This is a star-forming galaxy or possibly a narrow-line AGN. The spectrum displays strong O II, O III and Ne III emission and a 4000-Å break in the continuum. There are no Balmer lines in emission, but note that the H line falls in the atmospheric A-band. There is also a hint of Ne V emission at 4750 Å. The object is not flagged as a QSO in SDSS.
B.17 CQ0022+0020 (?))
This is a faint target. The object has a single narrow emission line at 6700 Å and a hint of a broad line at 7900 Å. This is most likely a dust reddened QSO at , where identified narrow line is O II and the broad line is H. The object is also observed by SDSSIII where the same features are detected with better significance (Noterdaeme, private communication). The object is not flagged as a QSO in SDSS.
B.18 CQ00270019 ()
This spectrum displays a single broad emission line, which we interpret as Ly at as there seems to be Ly forest absorption bluewards of it including a strong (possibly damped) Ly absorber at 4780 Å (). However, C IV emission is very weak or absent. The object appears similar to CQ0327+0006 at . There is no sign of reddening and the object likely entered our sample due to its high redshift. The object is also observed spectroscopically by SDSS where a redshift of is derived. The object is flagged as QSO_CAP and QSO_HIZ in SDSS.
B.19 CQ00430000 (?)
This object is observed by SDSS. The object is flagged by SDSS as an L5.5 star, but we believe this classification to be wrong as the near-IR colors are bluer than for late-type stars. The object has possible emission lines at 5900 Å and 8090 Å but we have not been able to establish the nature of these features.
B.20 CQ00460011 ()
This is a reddened QSO at . The redshift is based on the detection of C III emission and absorption at the positions of C IV and Ly at this redshift. The shape of the optical spectrum is reasonably well fitted with the template QSO spectrum reddened by an SMC-like extinction curve with . The object is not flagged as a QSO in SDSS. The object is also included in SDSS DR9 (released after our paper was submitted) where a redshift of 2.467 is derived.
B.21 CQ0105+0000 ()
This object is a compact galaxy with an old stellar population at . Both in the SDSS and UKIDSS imaging the object is consistent with being a point source. Hence, this is a galaxy that bears some resemblance to the compact quiescent galaxies seen at redshifts around 2 [58, e.g.,]. The object is not flagged as a QSO in SDSS.
B.22 CQ0107+0016 ()
This is a reddened QSO at . The spectrum displays C III in emission, C IV is nearly absorbed away and Ly is weak. Narrow emission from N V is also detected. The shape of the spectrum is fairly well fitted with the template QSO spectrum reddened by an SMC-like extinction curve with except redwards of H in the restframe where the reddened template spectrum is too red. The object is not flagged as a QSO in SDSS.
B.23 CQ0127+0114 ()
This is a bright reddened QSO at . The redshift is based on the detection of a broad Mg II emission line. This source has also been observed by the SDSS where a slightly lower redshift () is derived. This source is also detected in the FIRST survey [3]. The QSO is reddened by an amount corresponding to as determined from both our and the SDSS spectrum. The near-IR photometry for this source is very blue - even bluer than the unreddened QSO template. In SDSS the source is flagged as QSO_FIRST_CAP.
B.24 CQ01290059 ()
This is a strongly reddened () QSO at . The spectrum displays broad emission from Balmer-lines (H and H), Ne III and Mg II and narrower O II emission. This source is also detected in the FIRST survey [3]. In SDSS the source is flagged as QSO_FIRST_CAP. The near-IR photometry for this source is very blue and the reddened QSO template fails completely in matching this.
B.25 CQ0130+0013 ()
This is a reddened QSO () at observed by the SDSS. The redshift is presumably based on the detection of Mg II emission. Also for this source the reddened QSO template does not match the near-IR photometry. In SDSS the object is flagged as QSO_REJECT.
B.26 CQ0202+0010 ()
This is a reddened QSO () at observed by the SDSS. The redshift is presumably based on the detection of Mg II, C III and C IV emission. In SDSS the object is flagged as QSO_REJECT, QSO_HIZ.
B.27 CQ0211+0030 ()
This is a reddened () QSO at a relatively high redshift of . The redshift is based on the detection of C IV and Ly emission. The source is also detected by the ROSAT survey [55]. This object is really what we are searching for in terms of redshift, but there is no indication of a DLA at in the spectrum. The spectrum shows associated absorption. The only flags for the object in the SDSS catalog are ROSAT_D and ROSAT_E.
B.28 CQ02120023 (?)
The nature of this source is not secure. There is an indication of broad emission lines around 4400 and 5400 Å, which we interpret as C III and C IV at . If correct the inferred extinction based on the QSO template reddened by an SMC-like extinction curve is . Again, this model is far too red to match the near-IR photometry. In SDSS the object is flagged as QSO_REJECT.
B.29 CQ02200107 ()
This is a BAL QSO at . The redshift is based on the identification of emission and BAL features from C IV, Si IV, Ly and O VI/Ly. There is no evidence for reddening. In SDSS the object is not flagged as a QSO. The object is also included in SDSS DR9 (released after our paper was submitted) where a redshift of 3.461 is derived.
B.30 CQ02220019 ()
This is the 2nd most distant source in our survey. It is also flagged as a high- QSO by SDSS (QSO_HIZ). There is no evidence for reddening and the source has hence entered our selection due to its high redshift. The spectrum displays relatively strong associated absorption seen both in C IV, Ly and at the Lyman-limit. The object is also included in SDSS DR9 (released after our paper was submitted) where a redshift of 3.947 is derived.
B.31 CQ02290029 ()
This is a BAL QSO observed by the SDSS. In SDSS the object is listed to have redshift of . However, the redshift we infer based on identification of the C IV, C III and Mg II emission lines is . The inferred amount of extinction is (based on the QSO template reddened by SMC-like extinction), but this model fails completely in matching the near-IR photometry. Based on the SDSS photometry the object is flagged as QSO_FAINT, QSO_HIZ.
B.32 CQ0239+0115 ()
The nature of this object could not been established based on our spectrum. The object has narrow emission lines at 5122 Å and 5231 Å and a P-Cygni-like feature around 4890 Å. There is also tentative evidence for an emission line at 6960 Å. The photometry shows a red continuum with a break in the band to a blue continuum from to . Based on the SDSS photometry the object is flagged as QSO_REJECT. After submission of our paper DR9 was released. The object is included here and based on this spectrum a redshift of is reported (presumably based on narrow O II and O III emission as well as broad H and H). The emission lines in the blue end of the spectrum are also detected in the DR9 spectrum. Their nature remains unclear. Based on the shape of the spectrum we infer strong extinction corresponding to , but the assumption that the underlying spectrum is similar to the QSO template spectrum may be questionable in this case.
B.33 CQ02420000 ()
This is a reddened BAL-like QSO at (). The redshift is based on the identification of emission and BAL features from C IV, Si IV and Ly. Broad C III emission is also detected. Based on the SDSS photometry the source is flagged as STAR_CARBON, QSO_HIZ.
B.34 CQ02470052 ()
This is a strongly reddened QSO at with an estimated amount of extinction of . The spectrum displays emission from Mg II, O II, and indications of Ne III and Balmer lines. The reddened QSO model is again too red to match the near-IR photometry. Based on the SDSS photometry the object is not flagged as a QSO.
B.35 CQ0255+0048 ()
This object, observed by the SDSS, is the most distant QSO in our sample at a redshift of . The object shows no sign of reddening. It has a strong absorber detected both in Ly and at the Lyman limit. Based on the SDSS photometry the object is flagged as QSO_HIZ.
B.36 CQ0303+0105 ()
This is a QSO with relatively weak BAL-features and no evidence for reddening. C IV has a P-Cygni profile, Ly is weak and narrow, but N V appears very strong. The narrow feature at 4224 Å is an energetic cosmic ray hit that has not been completely removed by the rejection algorithm. The object is also observed spectroscopically by SDSS leading to a consistent redshift measurement. The object is flagged as QSO_HIZ based on the SDSS photometry.
B.37 CQ0310+0055 ()
This is a high redshift () QSO observed by the SDSS. There is no evidence for reddening. The object has strong associated absorption detected both in C IV, Si IV and at the Lyman-limit. Based on the SDSS photometry the source is flagged as QSO_FAINT, QSO_HIZ.
B.38 CQ0311+0103 (unknown redshift?)
The nature of this object is not established based on our spectrum. The signal-to-noise ratio is low, but there seems to be a double absorption line at 5400 Å and possible a broad emission line at 6600 Å. The object is also observed by SDSS where a redshift of 3.27 is determined. At this redshift the broad feature at 6600 Å would be C IV emission. The photometry is consistent with a reddened QSO () at this redshift. However, we still consider this redshift measurement insecure as there does not seem to be an onset for Ly forest absorption (and Ly emission or absorption at is absent). The doublet at 5400 Å is consistent with Ca II at . Based on the SDSS photometry the object is flagged as QSO_FAINT, QSO_HIZ.
B.39 CQ0312+0032 ()
This is a reddened QSO at . The redshift is based on the detection of Mg II emission (with a P-Cygni profile). The shape of the optical spectrum is well matched with the template spectrum reddened by an extinction curve except C III seems to be weak/absent. Based on the SDSS photometry the object is not flagged as a QSO.
B.40 CQ0312+0035 ()
This object looks very similar to CQ0312+0032, except here Mg II is not absorbed and C III is well detected. The redshift is slightly larger (). Based on the SDSS photometry the object is not flagged as a QSO. Note that CQ0312+0032 and CQ0312+0035 are only a few arcmin from each other on the sky. The redshifts of the two sources seems to be significantly different that this must be a coincidence.
B.41 CQ03210035 ()
This is a very bright BAL QSO at observed by the SDSS. The inferred amount of extinction corresponds to . based on the SDSS photometry the source is flagged as QSO_HIZ. Again, the reddened QSO template spectrum fails complete to match the UKIDSS photometry.
B.42 CQ0326+0106 (?)
The nature of this objet is not well established from our spectrum. There is an emission line at around 5200 Å and the shape of the optical spectrum can be well matched assuming that the line is Mg II at and assuming SMC-like extinction with . The object is also observed by SDSS where a redshift of is determined. Based on the SDSS spectrum we infer an extinction of . In SDSS the only flag for the object is SERENDIP_DISTANT.
B.43 CQ0327+0006 (?)
The spectrum shows a broad emission line around 5500 Å, which most likely is Ly at . There is evidence for mild reddening (). The object is not flagged as a QSO based on the SDSS photometry.
B.44 CQ03290057 ()
This object appears very similar to CQ0312+0032 and CQ0312+0035. It is a reddened QSO at with an inferred extinction of . The redshift is based on the detection of the Mg II emission line. The object is also observed by SDSS. Based on the SDSS spectrum we infer a somewhat larger amount of extinction (). The object is not flagged as a QSO based on the SDSS photometry.
B.45 CQ03320013 ()
This is the lowest redshift QSO in our sample. This object is a reddened () QSO at . The spectrum displays narrow O II and O III emission and broad lines from H and Ne III. The object is not flagged as a QSO based on the SDSS photometry.
B.46 CQ0336+0112 ()
This is an M-dwarf. Based on the SDSS photometry the source is not flagged as a QSO.
B.47 CQ0338+0004 ()
This is a reddened QSO at observed by the SDSS. The redshift is presumably based on the detection of Mg II and C III emission lines. Based on the SDSS spectrum we infer an amount of extinction corresponding to . In the SDSS catalog the source is flagged QSO_CAP.
B.48 CQ0339+0022 ()
This is a reddened QSO at . The shape of the optical spectrum is well matched with the template spectrum reddened by SMC-like extinction with . The spectrum displays emission lines from Mg II and C III. Mg II has a P-Cygni profile and there is broad Al III absorption bluewards of the C III emission line, characteristic of lo-BAL QSOs. The object is not flagged as a QSO based on the SDSS photometry.
B.49 CQ03500031 ()
This is a reddened QSO at . A spectrum has also been secured by the SDSS team. Based on both our and the SDSS spectrum we infer an amount of extinction corresponding to . The spectrum displays emission lines from C III, C IV, and Si IV. In the SDSS catalog the source is flagged QSO_CAP.
B.50 CQ03540012 ()
This is a reddened QSO at , but in this case the dust is Galactic () and there is no evidence for excess extinction in the host galaxy or intervening along the line-of-sight. Yet, the spectrum is still an unusual QSO spectrum in the sense that both C IV and Ly are strongly absorbed. The object is not flagged as a QSO based on the SDSS photometry.
B.51 CQ03540030 ()
This is a reddened QSO at . The redshift is based on the detection of the Mg II emission line. The objects is significantly reddened by Galactic extinction (), but it also has intrinsic excess reddening corresponding to . The object is not flagged as a QSO based on the SDSS photometry.
B.52 CQ0822+0004 ()
This spectrum shows strong Balmer absorption at , but no emission lines. This is most likely a compact post-starburst galaxy (so-called E+A galaxy). The object is flagged as QSO_HIZ based on the SDSS photometry.
B.53 CQ0822+0435 ()
This is an M-dwarf. Based on the SDSS photometry the source is not flagged as a QSO.
B.54 CQ0826+0728 ()
This is a reddened QSO at . The spectrum displays broad emission lines from Mg II and C III and narrower emission from C IV. The shape of the spectrum is well meatched with the template spectrum reddened by an SMC-like extinction curve with . The object is not flagged as a QSO based on the SDSS photometry.
B.55 CQ0831+0930 ()
This is a reddened QSO at . The inferred amount of extinction corresponds to . The spectrum displays broad emission from C III, whereas C IV and Si IV are only detected in absorption. The object is not flagged as a QSO based on the SDSS photometry.
B.56 CQ08310022 ()
This is a mildly reddened QSO at . The inferred amount of extinction corresponds to . The spectrum displays broad C III emission and complex absorption at the positions of C IV, Si IV, N V and Ly. The object is not flagged as a QSO based on the SDSS photometry.
B.57 CQ0832+0121 ()
This object is a compact, old galaxy (similar to CQ0105+0000). The object is not flagged as a QSO based on the SDSS photometry.
B.58 CQ0832+0606 ()
This spectrum is a reddened QSO at – similar to that of the nearby CQ08310022. The inferred amount of extinction corresponds to . The spectrum displays broad C III emission and complex absorption at the positions of C IV, Si IV, N V and Ly. The object is not flagged as a QSO based on the SDSS photometry.
References
- [1] Arnouts, S., Cristiani, S., Moscardini, L., Matarrese, S., Lucchin, F., Fontana, A., & Giallongo, E. 1999, MNRAS, 310, 540
- [2] Banerji, M., McMahon, R. G., Hewett, P. C., Alaghband-Zadeh, S., Gonzalez-Solares, E., & Venemans, B. P. 2012, ArXiv e-prints
- [3] Becker, R. H., White, R. L., & Helfand, D. J. 1995, ApJ, 450, 559
- [4] Benn, C. R., Vigotti, M., Carballo, R., Gonzalez-Serrano, J. I., & Sánchez, S. F. 1998, MNRAS, 295, 451
- [5] Bongiorno, A., et al. 2007, A&A, 472, 443
- [6] Ellison, S. L., Churchill, C. W., Rix, S. A., & Pettini, M. 2004, ApJ, 615, 118
- [7] Ellison, S. L., Yan, L., Hook, I. M., Pettini, M., Wall, J. V., & Shaver, P. 2001, A&A, 379, 393
- [8] Erkal, D., Gnedin, N. Y., & Kravtsov, A. V. 2012, ArXiv e-prints
- [9] Fleuren, S., et al. 2012, MNRAS, 423, 2407
- [10] Frank, S., & Péroux, C. 2010, MNRAS, 406, 2235
- [11] Franx, M., van Dokkum, P. G., Schreiber, N. M. F., Wuyts, S., Labbé, I., & Toft, S. 2008, ApJ, 688, 770
- [12] Fynbo, J. P. U., et al. 2011, MNRAS, 413, 2481
- [13] Gavignaud, I., et al. 2006, A&A, 457, 79
- [14] Glikman, E., Gregg, M. D., Lacy, M., Helfand, D. J., Becker, R. H., & White, R. L. 2004, ApJ, 607, 60
- [15] Glikman, E., Helfand, D. J., & White, R. L. 2006, ApJ, 640, 579
- [16] Glikman, E., Helfand, D. J., White, R. L., Becker, R. H., Gregg, M. D., & Lacy, M. 2007, ApJ, 667, 673
- [17] Glikman, E., et al. 2012, ApJ, 757, 51
- [18] Gosling, A. J., Bandyopadhyay, R. M., & Blundell, K. M. 2009, MNRAS, 394, 2247
- [19] Gregg, M. D., Lacy, M., White, R. L., Glikman, E., Helfand, D., Becker, R. H., & Brotherton, M. S. 2002, ApJ, 564, 133
- [20] Hall, P. B., et al. 2002, in Astronomical Society of the Pacific Conference Series, Vol. 255, Mass Outflow in Active Galactic Nuclei: New Perspectives, ed. D. M. Crenshaw, S. B. Kraemer, & I. M. George, 161
- [21] Hewett, P. C., Warren, S. J., Leggett, S. K., & Hodgkin, S. T. 2006, MNRAS, 367, 454
- [22] Hopkins, P. F., et al. 2004, AJ, 128, 1112
- [23] Horne, K. 1986, PASP, 98, 609
- [24] Hunt, L. K., Mannucci, F., Testi, L., Migliorini, S., Stanga, R. M., Baffa, C., Lisi, F., & Vanzi, L. 1998, AJ, 115, 2594
- [25] Ilbert, O., et al. 2006, A&A, 457, 841
- [26] Jarvis, M. J., et al. 2012, ArXiv e-prints
- [27] Jian-Guo, W., et al. 2012, ArXiv e-prints
- [28] Jorgenson, R. A., Wolfe, A. M., Prochaska, J. X., Lu, L., Howk, J. C., Cooke, J., Gawiser, E., & Gelino, D. M. 2006, ApJ, 646, 730
- [29] Kaplan, K. F., Prochaska, J. X., Herbert-Fort, S., Ellison, S. L., & Dessauges-Zavadsky, M. 2010, PASP, 122, 619
- [30] Khare, P., vanden Berk, D., York, D. G., Lundgren, B., & Kulkarni, V. P. 2012, MNRAS, 419, 1028
- [31] Laureijs, R., et al. 2011, ArXiv e-prints
- [32] Maddox, N., Hewett, P. C., Warren, S. J., & Croom, S. M. 2008, MNRAS, 386, 1605
- [33] McCracken, H. J., et al. 2012, A&A, 544, A156
- [34] Murphy, M. T., & Liske, J. 2004, MNRAS, 354, L31
- [35] Nilsson, K. K., & Møller, P. 2009, A&A, 508, L21
- [36] Nilsson, K. K., Tapken, C., Møller, P., Freudling, W., Fynbo, J. P. U., Meisenheimer, K., Laursen, P., & Östlin, G. 2009, A&A, 498, 13
- [37] Nishiyama, S., Nagata, T., Tamura, M., Kandori, R., Hatano, H., Sato, S., & Sugitani, K. 2008, ApJ, 680, 1174
- [38] Nishiyama, S., Tamura, M., Hatano, H., Kato, D., Tanabé, T., Sugitani, K., & Nagata, T. 2009, ApJ, 696, 1407
- [39] Noterdaeme, P., et al. 2012, A&A, 540, A63
- [40] Noterdaeme, P., Ledoux, C., Srianand, R., Petitjean, P., & Lopez, S. 2009, A&A, 503, 765
- [41] Noterdaeme, P., Petitjean, P., Ledoux, C., López, S., Srianand, R., & Vergani, S. D. 2010, A&A, 523, A80+
- [42] Pei, Y. C. 1992, ApJ, 395, 130
- [43] Pei, Y. C., Fall, S. M., & Bechtold, J. 1991, ApJ, 378, 6
- [44] Pei, Y. C., Fall, S. M., & Hauser, M. G. 1999, ApJ, 522, 604
- [45] Peth, M. A., Ross, N. P., & Schneider, D. P. 2011, AJ, 141, 105
- [46] Pontzen, A., & Pettini, M. 2009, MNRAS, 393, 557
- [47] Prochaska, J. X., Gawiser, E., Wolfe, A. M., Castro, S., & Djorgovski, S. G. 2003, ApJ, 595, L9
- [48] Rauch, M. 1998, ARA&A, 36, 267
- [49] Richards, G. T., et al. 2002, AJ, 123, 2945
- [50] —. 2006, ApJS, 166, 470
- [51] Schlegel, D. J., Finkbeiner, D. P., & Davis, M. 1998, ApJ, 500, 525
- [52] Sumi, T. 2004, MNRAS, 349, 193
- [53] Taylor, E. N., Franx, M., Glazebrook, K., Brinchmann, J., van der Wel, A., & van Dokkum, P. G. 2010, ApJ, 720, 723
- [54] Telfer, R. C., Zheng, W., Kriss, G. A., & Davidsen, A. F. 2002, ApJ, 565, 773
- [55] Truemper, J. 1982, Advances in Space Research, 2, 241
- [56] Urrutia, T., Becker, R. H., White, R. L., Glikman, E., Lacy, M., Hodge, J., & Gregg, M. D. 2009, ApJ, 698, 1095
- [57] van Dokkum, P. G. 2001, PASP, 113, 1420
- [58] van Dokkum, P. G., et al. 2008, ApJ, 677, L5
- [59] Vanden Berk, D. E., et al. 2001, AJ, 122, 549
- [60] Vladilo, G., & Péroux, C. 2005, A&A, 444, 461
- [61] Warren, S. J., Hambly, N. C., Dye, S., Almaini, O., Cross, N. J. G., & Edge, A. C. e. a. 2007, MNRAS, 375, 213
- [62] Warren, S. J., Hewett, P. C., & Foltz, C. B. 2000, MNRAS, 312, 827
- [63] Webster, R. L., Francis, P. J., Petersont, B. A., Drinkwater, M. J., & Masci, F. J. 1995, Nature, 375, 469
- [64] Wolfe, A. M., Gawiser, E., & Prochaska, J. X. 2005, ARA&A, 43, 861
- [65] Wright, E. L. 1981, ApJ, 250, 1
- [66] Wu, X.-B., Zuo, W., Yang, J., Yang, Q., & Wang, F. 2012, ArXiv e-prints
- [67] Zafar, T., et al. 2012, ApJ, 753, 82