A photometric and astrometric investigation of the brown dwarfs in Blanco 1
Abstract
We present the results of a photometric and astrometric study of the low mass stellar and substellar population of the young open cluster Blanco 1. We have exploited band data, obtained recently with the Wide Field Camera (WFCAM) on the United Kingdom InfraRed Telescope (UKIRT), and 10 year old and band optical imaging from CFH12k and Canada France Hawaii Telescope (CFHT), to identify 44 candidate low mass stellar and substellar members, in an area of 2 sq. degrees, on the basis of their colours and proper motions. This sample includes five sources which are newly discovered. We also confirm the lowest mass candidate member of Blanco 1 unearthed so far (29MJup). We determine the cluster mass function to have a slope of =+0.93, assuming it to have a power law form. This is high, but nearly consistent with previous studies of the cluster (to within the errors), and also that of its much better studied northern hemisphere analogue, the Pleiades.
Keywords:
stars: low-mass, brown dwarfs, open clusters and associations:individual:Blanco 11 Introduction
Open clusters are often acclaimed as excellent laboratories with which to study star formation. This is due to the co-eval nature of their members and estimates of their age being comparatively robust. Many open star clusters have been studied to date, yielding a large number of low mass members (e.g. Baker et al. 2010; Casewell et al. 2007; Lodieu et al. 2007) which have been used to refine our knowledge about the low mass end of star formation via mapping the initial mass function (IMF). The IMF, the number of objects per unit mass interval, is an observable outcome of star formation and can be used to critically examine theoretical models of this process.The IMF is commonly measured using an parameter, where dN/dM M-α and N is number of objects, and M is mass. For most open star clusters (ages 100 Myr), is roughly consistent across all samples and 0.6 (Bouvier et al., 2005). This value is also consistent with. field values such as those of Chabrier (2003), although recently it has been suggested that for very low mass field brown dwarfs the IMF may have a different form. Indeed Burningham et al. (2010) suggest that in this case may even have a negative value.
In recent years there has been a particular emphasis on building a solid comprehension of the mechanisms by which very low mass brown dwarfs and free-floating planetary mass objects form (e.g. Bate 2011). Nevertheless, key questions remain to be answered e.g. what is the lowest possible mass of object that can be manufactured by the star formation process From a theoretical stance, traditional models predict that if substellar objects form like stars, via the fragmentation and collapse of molecular clouds, then there is a strict lower mass limit to their manufacture of 0.007-0.010 . This is set by the rate at which the gas can radiate away the heat released by the compression (e.g. Low & Lynden-Bell 1976). However, in more elaborate theories, hypothetical magnetically mediated rebounds in collapsing cloud cores might lead to the decompressional cooling of the primordial gas, a lowering of the Jeans mass and hence the production of gravitationally bound fragments with masses of only 0.001 (Boss, 2001).
However, while many surveys of open star clusters have been performed to search for substellar members, the majority of these are in the heavily populated Northern hemisphere clusters. The lack of southern coverage from surveys (e.g. Sloan Digital Sky Survey York et al. 2000; UKIRT Infrared Deep Sky Survey Warren et al. 2007) has impeded detailed studies of the substellar population of a plethora of potentially interesting southern open clusters.
Blanco 1 is a 9025 Myr (Panagi & O’dell, 1997) open cluster with an age similar to that of the 125 Myr Pleaides cluster (Stauffer, Schultz & Kirkpatrick, 1998) at a distance of 20712 pc as determined from measurements (van Leeuwen, 2009). Recent work on the cluster includes spectroscopy of F and G type stars (Ford et al., 2005) which show that the metallicity is [Fe/H]=+0.04, with subsolar abundances for [Ni/Fe], [Si/Fe], [Mg/Fe], and [Ca/Fe]. Cargile, James & Jeffries (2010) have determined a Lithium age for the cluster of 13224 Myr which is closer to the age of the Pleiades than that of Panagi & O’dell (1997). We have taken the age of the cluster to be 120 Myr which is close to both measured values, and is present in the Chabrier et al. (2000) DUSTY models.
Recently Platais et al. (2011) surveyed 11 square degrees of the cluster to provide a comprehensive proper motion catalogue for all stellar objects down to M5V. Moraux et al. (2007) performed the first study of the cluster to search for brown dwarfs using CFH12k on the Canada-France-Hawaii Telescope in the optical and bands to image 2.3 square degrees of the cluster centre. They discovered 300 cluster members; 30-40 were estimated to be brown dwarfs, some of which had additional band photometry and optical spectroscopy. Three of these objects were subsequently confirmed as members by Cargile et al. (2010).
We have used the and band images from Moraux et al. (2007) and have combined them with additional deep () band photometry obtained using WFCAM on UKIRT allowing us to not only select fainter candidate cluster members, but also to measure the proper motion for some of the previously identified objects to prove if they are indeed associated with the cluster.
2 Observations and Data Reduction
2.1 CFHT12K data
The initial Blanco 1 data was taken with the CFHT12k optical mosaic camera during two separate runs as detailed in Moraux et al. (2007). The first of the runs occurred between 30 September 1999 and 2 October 1999, with the second occurring between 18 and 20 of December 2000. A total of 7 fields were observed covering an area of 2.3 square degrees, in a (mostly) non overlapping pattern. Each separate field covered an area of 28’42’. The area of sky covered is shown in Figure 1.

For each filter, Mould and Prime (see http://www.cfht.hawaii.edu/Instruments/Filters/cfh12k.html for filter profiles), a short observation of 10 s was accompanied by two longer 600 s exposures. These were then combined to produce an equivalent image containing 1200s worth of exposure. The detection limits of the data were 24 (Moraux et al., 2007),well below the stellar/substellar boundary which for Blanco 1 is estimated to lie at 19.15. The reduction of the initial data by Moraux et al. (2007) followed the same prescription as described in Moraux et al. (2003).
The raw CFHT12k data frames were extracted from the Canadian Astrophysical Data Centre (CADC) archive and were re-reduced using the imaging pipeline (Irwin & Lewis 2001) following the procedures described in Casewell et al. (2007). Subsequently the two 600s images in each filter at each pointing were co-added prior to source extraction and catalogue generation. Sources were identified as having a minimum of 5 interconnected pixels sitting at a significance of 1.5 above the background, with aperture photometry carried out using a radius of 3.5 pixels. In addition a morphological classification flag was provided with -1 indicating a stellar like profile, 0 noise and +1 non-stellar like sources. For the field-filter-extension/chip combinations of F4--10, F4--10, F6--6, F6--6 and F8--8 the astrometry needed further correction to that supplied by the CASU pipeline which was accomplished by using “AAA” rated stars in 2MASS.
To refine the photometric calibration used by Moraux et al. (2003) which was based on A0 stars, we calculated a zero point for each chip in each filter using data from ESO.
Blanco 1 formed part of a study of young open clusters by the Monitor project (e.g. Irwin et al. 2008; Irwin et al. 2009 and references therein). The observations were obtained using the MPG/ESO 2.2-m telescope with WFI in service mode, with around 500 epochs measured between July 2005 and October 2007 for four pointings (See Figure 2). The instrument provides a field of view of 3433 arcmin2 (0.31 deg2), using a mosaic of eight 2k4k pixel CCDs, at a scale of 0.238 arcsec pix-1. The filter used was the ESO WFI broadband I filter (designated BB# I203_ESO879, also known as the IEIS filter) with a central wavelength of 826.9nm, and a sharp cutoff in the red shortwards of 950nm.
For a full description of the data reduction steps, the reader is referred to Irwin et al. (2007). Briefly, we used the pipeline for the INT wide-field survey (Irwin & Lewis, 2001) for 2D instrumental signature removal (bias correction, flat-fielding, defringing) and astrometric and photometric calibration. We then generated a master catalogue for each filter by stacking 20 of the frames taken in the best conditions (seeing, sky brightness and transparency) and running the source detection software on the stacked image. Astrometric calibration is tied into 2MASS and has residuals of better than 0.05 arcseconds per pointing. Photometric calibration of our data was carried out using regular observations of Landolt (1992) equatorial standard star fields, measured as part of the standard ESO nightly calibrations. Prior to applying the calibration, we converted the Landolt (Cousins) photometry into the IEIS system using colour equations from Mike Irwin (private communication), see Equation 1
| (1) |
(and also Irwin et al. 2008). By converting the Landolt standards into the system, and working entirely in the natural system of the instrument, this stage of the calibration of the CCD photometry is independent of the differences in colour between the cluster members which are somewhat redder than the Landolt standards.

The and zeropoints used to calibrate the CFHT data were then calculated by comparing the uncalibrated instrumental magnitudes against those from the Monitor project. Data from each of the 12 CFHT12k CCDs were binned for each of the two separate runs, i.e. all the objects found on chip 6 (over the different fields) taken in the 1999 run were combined to provide one single photometric zero-point for that chip. As small regions of overlap exist between some of the CFHT12k fields, a test of photometric accuracy was conducted for those objects with duplicate detections. This yielded RMS values of 0.035 and 0.040 for the and filters respectively.
To confirm the calibration we first attempted to use the APASS survey (http://www.aavso.org/apass), however, there was insufficient overlap in magnitudes (the survey objects are saturated in the CFHT image) for us to use these data. We then cross-correlated the objects from Moraux et al. (2007) with our data and used them to check the calibration. We obtain an offset of =+0.0660.018 and =+0.0800.012 between the original CFHT data and our reprocessed images, with the original data being fainter. This is marginally larger than the RMS scatter, but is in general smaller than the errors on the measurements, and so we are satisfied that our calibration is accurate.
Following the photometric calibration, the separate and catalogues for each CFHT12k CCD chip were merged. This was done by using a flux limited sample of objects that had been morphologically classified as stellar. This subset was used as an input for pattern matching and linear transformation equation generation between the associated and pixel coordinates of the objects. Once a transformation had been established for the “clean” sample it was used to match the full sample together helping to reduce the number of spurious detections between the two images.
2.2 WFCAM data
In addition to the optical data, near-IR observation were also taken. Three WFCAM (Casali et al., 2007) band tiles were obtained in UKIRT service mode, 2 on the night of 31 October 2006 and 1 on the night of 22 July 2009. Each WFCAM pawprint used exposures of 18 s and a 9 point jitter pattern with 2x2 microstepping to improve the spatial sampling, making 1 hour of observations in total per tile:600s exposure per pawprint, in seeing of 1” or better. The WFCAM data was processed as for the Pleiades survey of Casewell et al. (2007). The calibration and pipeline for the data reduction are described in Hodgkin et al. (2009).The photometric calibration is tied to 2MASS photometry resulting in accuracies of 1.5 per cent. The total area covered by the WFCAM fields is 2.25 square degrees, of which 2 square degrees overlaps with the CFH12k data as shown in Figure 1.
The CFHT12k data was pattern matched to the WFCAM data on an individual field by field, chip by chip basis to minimise multiple detections. Each source also had to be classified as stellar in both the CFHT12k and band images as well as the WFCAM band image. The resulting catalogue contained 9853 sources (8440 of which were unique).
We estimated the completeness of both the CFHT12k and WFCAM images using the method described in Casewell et al. (2007). We inserted 200 fake stars (1222, 1530) generated by iraf into each chip, 10 times to enable us to have sufficient objects on which to perform the statistics. The skylevel, detector gain, seeing, exposure times and zeropoint of the images was taken into account when creating the fake stars. The CASU routine imcore was used to extract the objects from each image and then the numbers of inserted and extracted objects were compared per magnitude bin. The data were found on average to be 90 per cent complete at 19.73 in the band, and 21.5 and 20.6 in the and bands respectively, and 50 per cent complete at 20.8 in and 22.2 and 21.5 in the and bands respectively. In general it was found that chip number 4 of WFCAM was about 0.2 mags less sensitive than the other 3 chips.
3 Results
3.1 Photometric selection
For consistency with previous studies of objects within this effective temperature range we chose to use the DUSTY models of Chabrier et al. (2000). We selected all sources with - within 0.5 of each side of the model for 120 Myrs at 207 pc. This selection allows for uncertainty in distance and the equal mass binary sequence. We then applied additional selection criteria of 1.95 and to extract the sequence from the bulk of the field stars. Figure 3. We selected a total of 83 objects using this method.
To determine the accuracy of our selection criteria, we compared how many of the objects presented in Moraux et al. (2007) were recovered by our survey. Moraux et al. (2007) present 764 unique sources, titled Low Mass Candidates (LMC) and Very Low Mass Candidates (VLMC), 578 of which are located within our survey area. Many of these objects were discovered using short exposures of 10s and so are saturated in our data (1200 s in the and bands). To allow for this, and to better exploit our deeper data, we then applied a bright limit of in our selection criteria. We recovered 522 objects in our survey area before the selection criteria were applied. The missing 50 objects have not been recovered due to falling between chip gaps, or not being detected in our band data as they are not red enough to be cluster members. Of the very low mass candidates, 81 are covered by our survey, and we recover all of these objects in our data.
However, after the selection cuts were made,only 27 LMC objects remained and 38 VLMC objects although there is some overlap between the lists (Table 3; Appendix A). The remainder were lost as they were brighter than , or fell outside the strip defined by the model i.e. despite appearing to belong to the cluster sequence in , they do not appear to belong to the sequence in or (generally being too blue), and so are probably not members of the cluster.

3.2 Proper motions and membership probabilities
We measured the proper motions of the 83 selected objects using the and bands, which gave an epoch difference of 10 years for the majority of objects, although a handful had a shorter epoch difference of only 8 years. The band was chosen over the band to minimise any effects of differential chromatic refraction as all images were taken at high airmass, due to Blanco 1 being near the observing limits of both UKIRT and CFHT. We used a pixel-pixel transformation routine that uses a set of stationary reference sources in each image as described by Casewell et al. (2007). The reference objects were selected to have magnitudes 16 mag 20 in , similar to that of the candidates, but not so faint as to have poor pixel centroiding. It was also required that they have an ellipticity of less than 0.2 in the band image and be located within 10’ of the candidate to minimise radial distortion effects.In regions of overlap it was also ensured that the candidate be on the same chip as the reference stars in each image.
Centroiding errors were estimated using fake stars as for the completeness calculations, only this time the difference in pixel positions between the inserted and recovered stars was measured. This difference was measured in magnitude bins, as it was anticipated that fainter objects would have larger centroiding errors. These errors were 0.01 pixels in for and 0.07 for , where the detector pixel size is 0.4”. For the band, the errors were 0.03 for , where the detector pixel size is 0.2”. These pixel measurements were added quadratically to the rms error on the pixel-pixel transforms to generate the proper motion errors.
Once we had measured the proper motions, the data were then binned in 10 mas yr-1 bins in both RA and dec, and a 2D Gaussian was fitted to the data in proper motion space. The derived was then used to reject objects outside the 2 boundary to remove outliers, and the fit was then recalculated. This gave a Gaussian width of 9.0 mas yr-1 to be used for candidate selection.
It is obvious from Figure 4 that the average proper motion of our selected objects ( = 8.93 mas yr-1, =6.70 mas yr-1) is significantly different from the literature value of the cluster proper motion ( = 20.11 mas yr-1, =2.43 mas yr-1; van Leeuwen 2009). Platais et al. (2011) determined that the mean motion of field stars is not at 0,0 as is generally used for relative proper motions, but at = 8.0 mas yr-1, =-6.0 mas yr-1. To determine if this offset was applicable to our data we modified our photometric selection criteria to obtain everything 0.5 mag bluer in than the Dusty model (Chabrier et al., 2000). We then measured proper motions for these 250 objects, and fitted a 2D Gaussian to their proper motions as before. We determined that the centre of this distribution is at = 1.96 mas yr-1, =-3.64 mas yr-1, with a width of 12 mas yr-1. This motion is smaller than that measured by Platais et al. (2011), but they measured many more stars, and to a better accuracy than this work which has concentrated on the fainter members of the cluster. This mean motion explains the offset between our candidate distribution and the cluster motion. Taking into account the offset makes our mean proper motion = 16.93 mas yr-1, =0.70 mas yr-1 which is much closer to the reported value for the cluster. We used the literature value of the cluster proper motion, minus the Platais et al. (2011) estimation of the field star motion, mas yr-1, mas yr-1, as the cluster centre for selection purposes. It should also be noted that the field and cluster stars are not that far apart in terms of the relative errors which Platais et al. (2011) discuss in more depth in their work on Blanco 1. Despite the small difference between the proper motion of the cluster and field stars, the narrower dispersion in proper motion for the cluster objects, and the colour selections in and mean we can be confident that we are selecting true cluster members.
Of the 83 candidates for which we obtained astrometry, 44 had proper motions within (or with errors within) 3 of the cluster value adjusted to take into account the field star relative motion (, ; Platais et al. 2011; van Leeuwen 2009). Of these 44 members, 33 are present in the VLMC list and 24 are present on the LMC list, with 18 objects common to both lists of candidate sets. This leaves 5 new low-mass candidate members to the cluster. The previously identified objects that were rejected are LMC694/VLMC66, VLMC64, VLMC68, VLMC69, VLMC71 and VLMC74. All VLMC objects with spectra remain in our candidates apart from objects 29,38,48 and 49 which are not in our survey area, and 16 and 22 which did not meet our photometric selection criteria (they are too bright). It should be noted that the 3 objects identified by (Moraux et al., 2007) as non-members based upon their spectroscopy, VLMC28, 37 and 44 were not selected, (VLMC28 also does not have a spectrum indicative of it being a cluster member; Cargile et al. 2010). The sucess of this method in recovering the previously identified spectroscopic members, despite large errors on the small cluster proper motion, leads us to believe this is a robust method for determining cluster members.
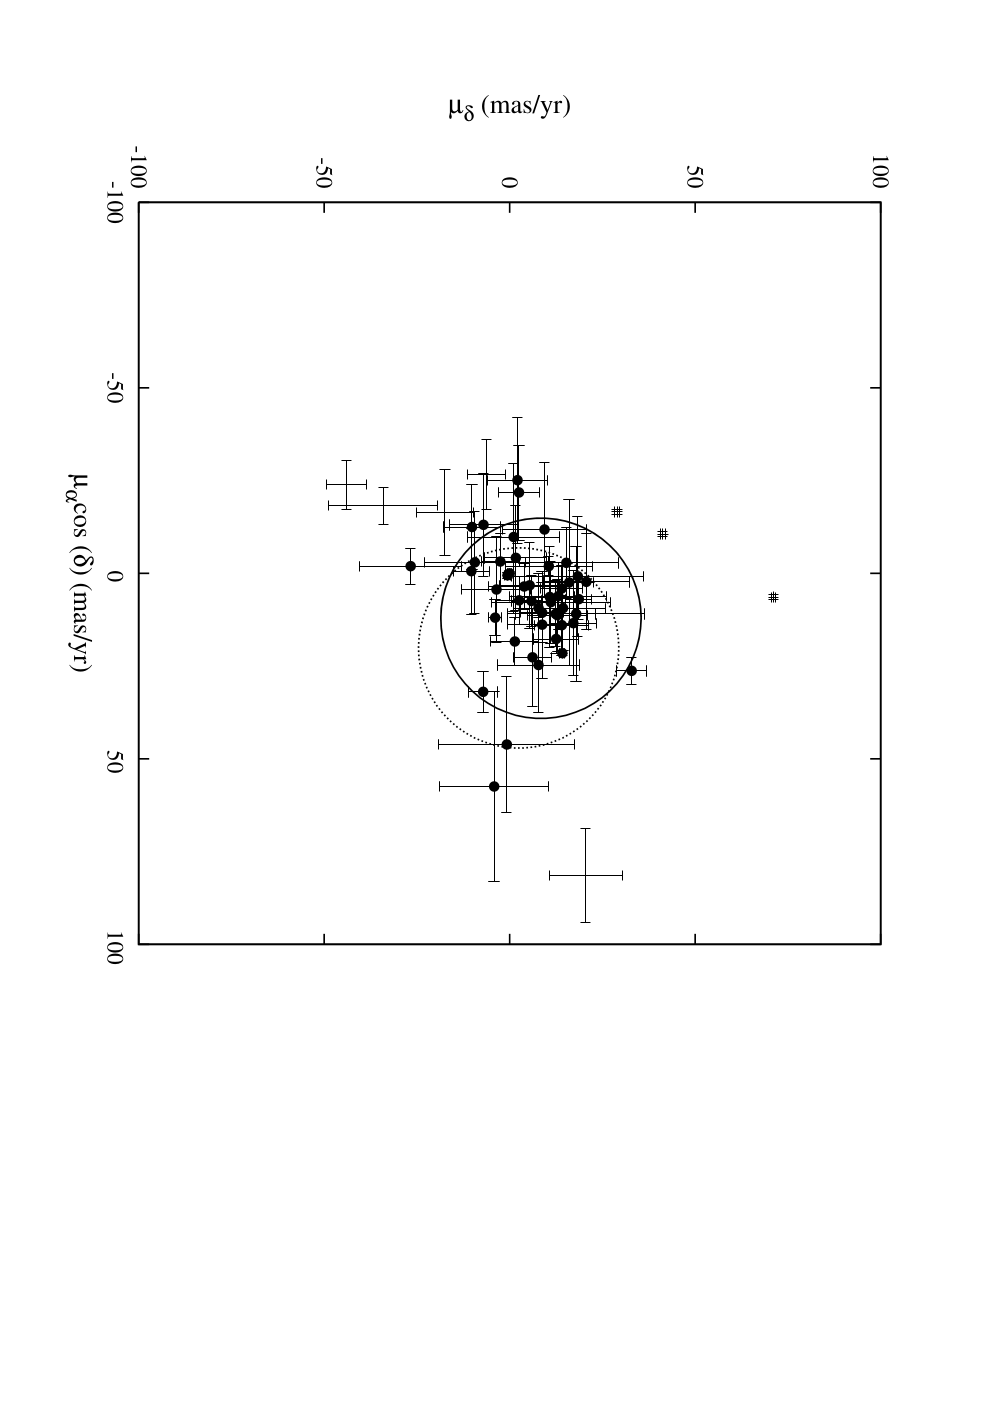
Examining the proper motion vector point diagram (Figure 4) it is clear that towards the location of the cluster there is an overdensity of objects when compared with regions at a similar distance from 0,0 but on the opposing side of the field star distribution. Unfortunately, the low number of sources coupled with a cluster proper motion comparable to the average proper motion error means that the two Gaussian approach to calculating membership probability as used by Baker et al. (2010) is not applicable. Instead the simpler annulus method was used as in Casewell et al. (2007). All non-selected objects with measured proper motions (barring those where there has obviously been a problem with the fit - 7 cases) were used per magnitude bin to assess the contamination and membership probabilities. We were unable to use an annulus centred on 0,0 as there are very few objects there not deemed to be members of Blanco 1 due to the low proper motion of the cluster. This may mean that some of the membership probabilities have been underestimated (Table 1).
| Probability | Completeness | |
|---|---|---|
| 19.5 | 91% | 100% |
| 19.5-20.5 | 75% | 97% |
| 20.5 to 21.5 | 50% | 93% |
| 21.5-22.5 | 50% | 62% |
| 22.5 | 40% | 16% |
| Name | Alternate name | RA | dec | cos | ||||
|---|---|---|---|---|---|---|---|---|
| J2000.0 | mas yr-1 | |||||||
| bl2399-4716 | 00 00 6.83 | -30 13 33.72 | +2.27 12.96 | +20.66 11.56 | 19.0450.010 | 18.2010.033 | 16.8510.007 | |
| bl28626-47167 | LMC571/VLMC19 | 00 07 50.63 | -30 5 9.97 | +7.45 6.86 | +5.90 5.45 | 18.5150.013 | 17.6880.037 | 16.3910.005 |
| bl2868-4699 | VLMC89 | 00 00 5.86 | -30 20 18.39 | +13.99 8.10 | +14.07 7.33 | 21.9710.050 | 20.7550.073 | 18.6250.027 |
| bl28691-43204 | VLMC54 | 00 07 41.46 | -29 56 20.39 | +31.93 5.57 | -7.13 3.81 | 19.9710.017 | 18.7820.041 | 16.9930.008 |
| bl32426-33057 | LMC629/VLMC46 | 00 05 57.04 | -29 43 48.33 | -1.93 4.90 | -26.66 13.69 | 19.3280.015 | 18.4310.039 | 17.1280.009 |
| bl32697-33301 | LMC729/VLMC72 | 00 06 8.96 | -29 44 25.22 | +2.45 22.41 | +16.06 6.60 | 21.2800.029 | 20.0350.054 | 18.2190.019 |
| bl33600-62347 | LMC626 | 00 06 41.73 | -29 42 52.52 | -13.07 13.81 | -7.03 9.07 | 19.3100.015 | 18.4660.039 | 17.2480.009 |
| bl33721-62566 | LMC705/VLMC63 | 00 06 49.36 | -29 40 41.18 | +10.90 8.92 | +12.40 10.72 | 20.6980.022 | 19.5210.046 | 17.7980.013 |
| bl34536-62053 | VLMC118 | 00 06 32.59 | -29 46 05.57 | +11.29 9.71 | +12.87 8.17 | 22.7820.086 | 21.3570.097 | 19.1110.037 |
| bl37640-49624 | LMC592/VLMC30 | 00 08 27.38 | -29 43 54.26 | +10.94 18.20 | +17.94 18.40 | 18.7080.014 | 17.9650.037 | 16.7370.006 |
| bl3800-15178 | LMC580/VLMC25* | 00 00 42.74 | -30 17 43.43 | +6.40 13.62 | +10.82 6.75 | 18.6120.010 | 17.7790.032 | 16.4970.006 |
| bl3819-15319 | LMC621 | 00 00 36.44 | -30 19 15.95 | +22.62 13.28 | +6.14 5.19 | 19.1840.011 | 18.2880.033 | 17.0020.008 |
| bl43328-55651 | VLMC57 | 00 07 22.76 | -30 01 57.32 | -4.16 14.08 | +1.65 8.34 | 20.1390.018 | 18.9520.043 | 17.6230.012 |
| bl44742-27543 | VLMC82 | 00 04 42.00 | -30 04 33.52 | +11.93 4.88 | -3.91 1.70 | 21.7040.041 | 20.4970.058 | 18.4250.034 |
| bl46456-37665 | VLMC70 | 00 05 45.83 | -30 03 46.14 | +24.71 12.74 | +7.79 11.09 | 21.2210.028 | 20.0310.049 | 18.1420.019 |
| bl51473-23799 | LMC582/VLMC26 | 00 04 54.98 | -29 46 32.88 | +7.79 10.99 | +11.10 16.02 | 18.6630.010 | 17.9350.031 | 16.6530.006 |
| bl51714-24041 | LMC719/VLMC67 | 00 05 05.19 | -29 49 55.81 | +13.41 14.08 | +17.17 6.20 | 20.9430.025 | 19.9250.042 | 18.0350.016 |
| bl54505-36470 | 00 03 24.26 | -30 00 51.66 | +0.82 16.17 | +18.36 17.75 | 18.9590.010 | 18.0940.031 | 16.7850.007 | |
| bl54514-36502 | LMC608/VLMC41* | 00 03 23.62 | -29 55 17.56 | +0.00 0.63 | -0.00 0.63 | 19.0580.010 | 18.0330.031 | 16.5220.006 |
| bl54613-36058 | LMC663/VLMC60 | 00 03 40.17 | -30 03 40.85 | -0.57 11.55 | -10.33 4.90 | 20.4780.017 | 19.3840.038 | 17.6540.012 |
| bl54805-35986 | VLMC74 | 00 03 43.78 | -30 04 01.66 | +26.29 3.66 | +32.89 3.99 | 21.4040.030 | 20.1670.047 | 18.2020.019 |
| bl55543-35398 | LMC645/VLMC51* | 00 04 07.62 | -29 59 18.78 | +3.57 6.12 | +3.91 9.53 | 19.8060.014 | 18.7820.036 | 17.2100.009 |
| bl56159-35803 | 00 03 50.87 | -30 01 58.01 | +17.68 3.98 | +12.55 5.98 | 22.3290.070 | 21.0840.087 | 18.8550.032 | |
| bl56339-2865 | LMC624/VLMC45* | 00 01 35.71 | -30 03 10.13 | +18.36 6.54 | +1.41 6.49 | 19.2680.012 | 18.3260.033 | 16.9150.008 |
| bl57823-3435 | VLMC114 | 00 02 5.68 | -30 01 23.65 | +10.59 8.078 | +8.75 5.89 | 22.6550.110 | 21.3820.105 | 19.0770.042 |
| bl57973-12146 | LMC647/VLMC55 | 00 02 15.12 | -30 09 52.64 | -1.94 2.57 | +10.56 11.70 | 19.8350.016 | 18.8430.036 | 17.2350.009 |
| bl58756-8496 | VLMC65 | 00 00 7.31 | -29 54 26.81 | -2.81 9.46 | +15.26 14.08 | 20.5750.021 | 19.4950.043 | 17.7510.015 |
| bl6053-16818 | VLMC53 | 00 02 16.10 | -30 18 41.03 | +13.82 14.46 | +8.77 9.38 | 19.8100.013 | 18.7470.034 | 17.0310.008 |
| bl60868-7134 | VLMC32 | 00 01 19.28 | -29 54 06.58 | +57.44 25.62 | -4.17 14.72 | 18.7790.010 | 17.9910.031 | 16.7620.007 |
| bl63549-4173 | LMC639/VLMC50* | 00 00 9.86 | -30 01 59.39 | -9.78 19.95 | +1.10 12.38 | 19.6120.013 | 18.6510.034 | 17.2290.011 |
| bl65492-14209 | VLMC83 | 00 00 34.79 | -30 02 51.04 | +21.52 0.63 | +14.18 0.63 | 21.8000.044 | 20.4940.059 | 18.4500.026 |
| bl71077-57153 | LMC609/VLMC36* | 00 07 08.79 | -30 06 42.35 | +7.29 6.58 | +2.57 6.10 | 18.9580.014 | 18.0720.038 | 16.7130.006 |
| bl73194-41854 | LMC632 | 00 08 13.55 | -30 16 50.17 | -12.48 11.52 | -10.16 7.71 | 19.3840.015 | 18.2080.038 | 16.9640.008 |
| bl7507-10415 | LMC585 | 00 00 12.10 | -30 35 56.07 | +6.15 8.99 | +13.13 13.04 | 18.6760.010 | 17.8330.031 | 16.5990.006 |
| bl76145-40818 | LMC595/VLMC33 | 00 06 10.79 | -30 21 37.02 | +3.23 11.65 | +5.40 8.18 | 18.8170.014 | 17.9610.037 | 16.6910.007 |
| bl76187-40858 | 00 06 08.53 | -30 25 42.12 | -2.96 13.80 | -9.37 13.61 | 19.7670.017 | 18.8510.040 | 17.4830.011 | |
| bl76366-40509 | VLMC75 | 00 06 29.32 | -30 20 33.54 | +4.38 14.23 | -3.55 9.32 | 21.3210.035 | 20.2600.054 | 18.4540.023 |
| bl78357-42493 | LMC631 | 00 07 33.84 | -30 24 35.13 | +9.32 9.17 | +7.78 6.73 | 19.3270.015 | 18.3760.039 | 16.9370.008 |
| bl84053-20433 | 00 03 17.87 | -30 11 40.93 | +6.94 5.57 | +18.65 3.55 | 21.6630.037 | 20.3500.052 | 18.3820.023 | |
| bl85709-22911 | LMC604/VLMC43* | 00 04 32.88 | -30 18 41.90 | +9.41 11.43 | +14.39 11.46 | 19.1270.010 | 18.2380.031 | 16.8940.008 |
| bl862-2266 | LMC600/VLMC34* | 00 01 48.76 | -30 38 06.81 | -3.19 7.45 | -2.53 5.11 | 18.9510.011 | 17.9600.032 | 16.6240.007 |
| bl87593-22425 | VLMC93 | 00 04 57.74 | -30 14 02.01 | +46.11 18.36 | -0.75 18.34 | 22.1860.073 | 20.9030.058 | 18.8220.034 |
| bl89514-11054 | LMC619 | 00 02 50.60 | -30 28 53.89 | -11.83 17.94 | +9.38 11.27 | 19.2410.011 | 18.4290.033 | 17.2110.010 |
| bl90054-11175 | VLMC85 | 00 03 06.63 | -30 29 53.90 | +4.08 6.31 | +14.00 5.78 | 21.9990.049 | 20.7630.067 | 18.6240.029 |
4 Mass Spectrum
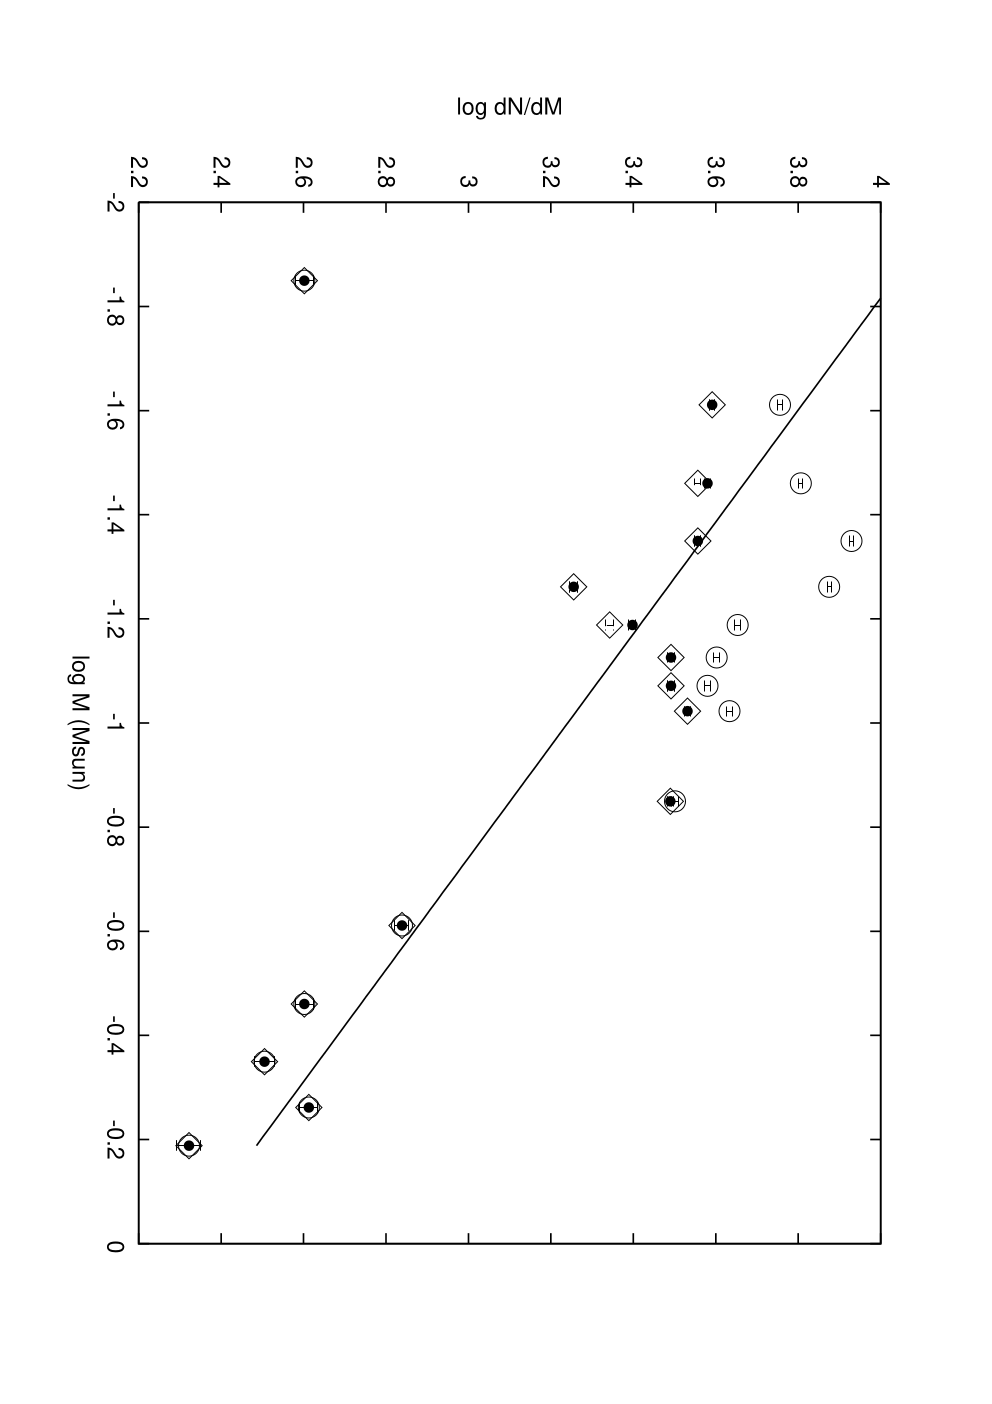
We were not able to generate mass functions for our new candidate members alone, due to there being too few objects to be statistically significant. However, we have used the Moraux et al. (2007) members combined with the colour and the NextGen model (Baraffe et al., 1998) for objects brighter than =20.0, and the DUSTY model (Chabrier et al., 2000) for object fainter than this. Both models are for 120 Myr. We present 3 mass spectra, one the original data from Moraux et al. (2007), and the second with the non-members, as determined from this work, excluded. The third dataset is all the members, including our 5 new objects (Figure 5). These new objects have masses between 35 MJup and 46 MJup, whereas the whole mass range of candidates is between 29 and 80 MJup. The third dataset (filled circles)is fitted by the straight line in Figure 5, with an value of 0.93 0.11. However, to obtain this fit, we have omitted the point at log M = -1.85: the faintest objects and lowest mass bin where we know the incompleteness is largest. We do not have a good enough photometry to accurately separate the single and binary star sequences, and thus suspected binaries have been assigned a mass equivalent to that of a single object at their recorded magnitude. The point at log M=-0.85 is discrepantly high and appears to be affected by binaries and possibly higher multiples at 20 (Figure 3).
The =0.930.11 indicates the slope is higher, but is consistent (to within the errors) with the values given by Moraux et al. (2007), which are 0.670.14 and 0.710.13 for 100 and 150 Myr models respectively, especially considering we have small number statistics in some mass bins.
While we have discovered 5 new low mass cluster members, our band data did not allow us to probe deeper into Blanco 1 than the original survey by Moraux et al. (2007). This situation will be improved as the VISTA VIKING survey which aims to cover the whole of the Blanco 1 cluster. It will also provide deeper multi-band photometry, as well as a far greater baseline between observations to be used for proper motion analysis. Our work has shown that Blanco 1 does contain brown dwarfs as low in mass as 30 MJup, making it similar to the Pleiades.
Follow up spectroscopic data will allow us to place constraints on the binary fraction of the cluster, as well as confirm membership for the objects without spectra. Decreasing the errors on the proper motions will allow us to determine members with much more confidence than we are currently able to due to the low space motion of the cluster. Once a full census of the cluster has been performed, Blanco 1 can then be properly compared to clusters such as the Pleiades. One can then test for the environmental tolerance of the IMF, dynamical evolution and mass segregation effects as well as providing further observational constraints to compare with the results of brown dwarf formation simulations.
5 Summary
We have used near-IR and optical photometry with proper motions derived from CFHT and WFCAM band images to identify 44 candidate cluster members with masses between 29 MJup and 80 MJup. 5 of these are previously unidentified candidate members and 40 have been identified by Moraux et al. 2007, 8 of which have been confirmed as cluster brown dwarfs from spectra. We derive =0.930.11 from the mass spectrum, which is consistent with the literature for this cluster.
6 Acknowledgements
DEAB acknowledges support from STFC and SLC is supported by a University of Leicester post-doctoral research position. This paper made use of data from the United Kingdom Infrared Telescope which is operated by the Joint Astronomy Centre on behalf of the Science and Technology Facilities Council of the U.K.We would also like thank France Allard for the use of the Phoenix web simulator at http://phoenix.ens-lyon.fr/simulator/index.faces which has been used in this research. This research has also made use of NASA’s Astrophysics Data System Bibliographic Services.
References
- Baker et al. (2010) Baker D. E. A., Jameson R. F., Casewell S. L., Deacon N., Lodieu N., Hambly N., 2010, MNRAS , 408, 2457
- Baraffe et al. (1998) Baraffe I., Chabrier G., Allard F., Hauschildt P. H., 1998, A&A , 337, 403
- Bate (2011) Bate M. R., 2011, MNRAS , 417, 2036
- Boss (2001) Boss A. P., 2001, ApJL , 551, L167
- Bouvier et al. (2005) Bouvier J., Moraux E., Stauffer J., 2005, in E. Corbelli, F. Palla, & H. Zinnecker ed., The Initial Mass Function 50 Years Later Vol. 327 of Astrophysics and Space Science Library, The 0.03-10 M☉ mass function of young open clusters. p. 61
- Burningham et al. (2010) Burningham B., et al., 2010, MNRAS , 406, 1885
- Cargile et al. (2010) Cargile P. A., James D. J., Jeffries R. D., 2010, ApJL , 725, L111
- Casali et al. (2007) Casali M., et al., 2007, A&A , 467, 777
- Casewell et al. (2007) Casewell S. L., Dobbie P. D., Hodgkin S. T., Moraux E., Jameson R. F., Hambly N. C., Irwin J., Lodieu N., 2007, MNRAS , 378, 1131
- Chabrier (2003) Chabrier G., 2003, PASP , 115, 763
- Chabrier et al. (2000) Chabrier G., Baraffe I., Allard F., Hauschildt P., 2000, ApJ , 542, 464
- Ford et al. (2005) Ford A., Jeffries R. D., Smalley B., 2005, MNRAS , 364, 272
- Hodgkin et al. (2009) Hodgkin S. T., Irwin M. J., Hewett P. C., Warren S. J., 2009, MNRAS , 394, 675
- Irwin et al. (2009) Irwin J., Aigrain S., Bouvier J., Hebb L., Hodgkin S., Irwin M., Moraux E., 2009, MNRAS , 392, 1456
- Irwin et al. (2008) Irwin J., Hodgkin S., Aigrain S., Bouvier J., Hebb L., Irwin M., Moraux E., 2008, MNRAS , 384, 675
- Irwin et al. (2007) Irwin J., Irwin M., Aigrain S., Hodgkin S., Hebb L., Moraux E., 2007, MNRAS , 375, 1449
- Irwin & Lewis (2001) Irwin M., Lewis J., 2001, NewAR , 45, 105
- Landolt (1992) Landolt A. U., 1992, AJ , 104, 340
- Lodieu et al. (2007) Lodieu N., Hambly N. C., Jameson R. F., Hodgkin S. T., Carraro G., Kendall T. R., 2007, MNRAS , 374, 372
- Low & Lynden-Bell (1976) Low C., Lynden-Bell D., 1976, MNRAS , 176, 367
- Moraux et al. (2007) Moraux E., Bouvier J., Stauffer J. R., Barrado y Navascués D., Cuillandre J., 2007, A&A , 471, 499
- Moraux et al. (2003) Moraux E., Bouvier J., Stauffer J. R., Cuillandre J., 2003, A&A , 400, 891
- Panagi & O’dell (1997) Panagi P. M., O’dell M. A., 1997, A&AS , 121, 213
- Platais et al. (2011) Platais I., et al., 2011, MNRAS , 413, 1024
- Stauffer et al. (1998) Stauffer J. R., Schultz G., Kirkpatrick J. D., 1998, ApJL , 499, L199+
- van Leeuwen (2009) van Leeuwen F., 2009, A&A , 497, 209
- Warren et al. (2007) Warren S. J., et al., 2007, MNRAS , 375, 213
- York et al. (2000) York D. G., et al., 2000, AJ , 120, 1579
Appendix A Supplementary table
Table 3 displays a list of the Low Mass Candidates (LMC) and Very Low Mass Candidates (VLMC) identified by Moraux et al. (2007), that were present in our survey area, but were rejected by our photometric selection.
| Name | Name |
|---|---|
| LMC573 | LMC678 |
| LMC574 | LMC679 |
| LMC576 | LMC682 |
| LMC578 | LMC683 |
| LMC581/VLMC28 | LMC684 |
| LMC586 | LMC685 |
| LMC587 | LMC686 |
| LMC588 | LMC688 |
| LMC590 | LMC689 |
| LMC593 | LMC690 |
| LMC594 | LMC692 |
| LMC596 | LMC695 |
| LMC597 | LMC699 |
| LMC598 | LMC700 |
| LMC603/VLMC39 | LMC702 |
| LMC610 | LMC704 |
| LMC611 | LMC707 |
| LMC614 | LMC708 |
| LMC616 | LMC709 |
| LMC620 | LMC710 |
| LMC625 | LMC711 |
| LMC627 | LMC712 |
| LMC630 | LMC713 |
| LMC635 | LMC715 |
| LMC637 | LMC716 |
| LMC638 | LMC717 |
| LMC640 | LMC718 |
| LMC642 | LMC720 |
| LMC643 | LMC721 |
| LMC644 | LMC722 |
| LMC646 | LMC724 |
| LMC652 | LMC725 |
| LMC655/VLMC58 | LMC726 |
| LMC656 | LMC727 |
| LMC657 | LMC728 |
| LMC658 | LMC730 |
| LMC659 | LMC732 |
| LMC660 | LMC735 |
| LMC661 | LMC736 |
| LMC662 | LMC738 |
| LMC666 | LMC739 |
| LMC668 | LMC741 |
| LMC669 | LMC747 |
| LMC671 | LMC749 |
| LMC673 | LMC752 |
| LMC674 | LMC755 |
| LMC675 | LMC762 |
| LMC677 |