Resonant excitation of graphene K-phonon and intra-Landau level excitons in magneto-optical spectroscopy.
Abstract
Precise infra-red magneto-transmission experiments have been performed in magnetic fields up to 32 T on a series of multi-layer epitaxial graphene samples. We observe changes in the spectral features and broadening of the main cyclotron transition when the incoming photon energy is in resonance with the lowest Landau level separation and the energy of a point optical phonon. We have developed a theory that explains and quantitatively reproduces the frequency and magnetic field dependence of the phenomenon as the absorption of a photon together with the simultaneous creation of an intervalley, intra-Landau level exciton and a -phonon.
pacs
78.30.Fs, 71.38.-k, 78.66.FdPhonons, electrons, holes and plasmons are fundamental elementary excitations in solids, and their interactions among themselves and with light strongly influence the electronic and optical properties of a system. Graphene, a single atomic layer of carbon, exhibits many fascinating properties of basic and practical interest. Its low-energy charge carriers behave like two-dimensional (2D) massless Dirac fermions. The unique electronic structure of graphene has led to the prediction and observation of a number of novel phenomena involving various multi-elementary excitation interactions including electron-photon, electron-phonon, electron-electron, and electron-plasmon couplings. Recent discoveries include the observation of plasmarons in ARPES [1], controlling of quantum pathways in inelastic light scattering [2], and strong excitonic effects in optical absorption [3, 4, 5], among others.
In this paper, we report the discovery of another intriguing phenomenon seen in the magneto-optical response of graphene when the incoming photon energy is in resonance with the lowest Landau level separation and the energy of a Brillouin-zone-boundary phonon at the point. The frequency and magnetic field dependence of the spectral features are understood and explained in terms of resonant transitions which involve the absorption of a photon together with the simultaneous creation of an intervalley, intra-Landau level exciton and a -phonon. The phenomenon provides a novel manifestation of multi-elementary excitation interactions in condensed matter.
The phonons that interact the most strongly with electrons in graphene are those at the Brillouin-zone-center () and at the Brillouin-zone-boundary () [6]. The -phonon has been the subject of theoretical study [6] and its signatures have been observed in several experiments[8, 7]. The -phonon also interacts strongly with electrons, giving rise to characteristic features in Raman spectra [8]. Compared to -phonons, the effect of -phonons on optical experiments is more subtle and indirect, due to the large difference in momenta between photons and the -phonons. The large wavevector of the -phonons may also couple the two inequivalent valleys in the graphene band structure, introducing an additional degree of freedom into the system. The present study shows that this valley degree of freedom in the coupling has unique and important consequences in the magneto-optical response of graphene.
In our experiment, precise infra-red transmission measurements were performed on multi-layer epitaxial graphene samples, at 1.8 K, under magnetic fields up to 32 T. It is known that under a perpendicular magnetic field , the electronic structure of graphene is quantized to discrete Landau levels (LL) with the energy where are integers including 0. Multiple optical transitions are allowed and have been observed [9] between LL to if these levels have appropriate occupation factors. We focus our attention on the magnetic field evolution of the transmission spectrum near the main optical absorption peak, with energy involving the LL (i.e., transitions from to or from to .) It is discovered that a strong change in the optical spectrum occurs when reaches an energy near the energy of a -phonon. This is interpreted as a signature of a new multi-elementary excitation phenomenon involving interaction between electrons and the -phonon, and a theory is developed to explain quantitatively the phenomenon.

A series of four multi-layer epitaxial graphene samples were grown [10] on the C-terminated surface of SiC. The thickness of the SiC substrate has been reduced to in order to minimize the very strong double-phonon absorption of SiC in the energy range of interest. Whereas the transmission spectra reveal some contributions of graphite Bernal-stacked inclusions, the major part displays the electronic band structure of an isolated graphene monolayer resulting from the characteristic rotational stacking of the sheets [11]. Using standard techniques [12], we measure the relative transmission spectra TR()(see Supplementary Information SI-I).
The TR spectra of the sample S1 are displayed in Fig. 1a and b for different values of . They show, as for all samples, an apparent splitting of the transmission dip into two and a pronounced increase of the broadening of the dip, as well as a change in the -field dependence of the overall position for fields larger than 17 T.
In general, the detailed analysis of such spectra requires the use of a multi-layer dielectric model including all layer dielectric properties of the sample. In particular, for each graphene sheet, one has to introduce the corresponding components of the optical conductivity tensor and , defined by ( and denote current density and electric field vectors respectively). Here, the and -axis lie in the plane of the sample. For instance , for transitions involving the n=0 LL, is written as:
| (1) |
where , scan the values 0 and , is the occupation factor of the LL , the optical matrix element, and measures the broadening of the transition . However this approach requires the knowledge of the number of effective active layers as well as their carrier densities which, in turn, implies some approximations (see SI-II for details). We will use this approach in a refined analysis, but in our initial analysis, fit directly the transition with a single Lorentzian line.
This fit provides, for each value of , two independent parameters and which are plotted in Fig. 1c as a function of . The variation of shows clearly an extra bump beyond 17 T (clearly apparent in Fig. 1b ) whereas that of exhibits a downwards kink at the same field. The evolution of is decomposed in two parts: one named (full dots) and an extra contribution to represented by stars in the top panel of Fig. 1c. The same decomposition is obtained for all samples with slightly different coefficients which are discussed in SI-II. The dependence of is attributed to scattering with short range impurities [14]; the linear variation with is not predicted by scattering mechanisms considered in previous studies [14] and will be discussed later. The shape of the extra contribution to has a threshold at around 17 T () with a maximum amplitude of about for all samples, within the experimental uncertainties, before decreasing at higher fields. In that energy range the only likely excitations in graphene which could play a role are the zone-boundary -phonons [15, 16]. Note that, at this threshold energy, the evolution (bottom panel of Fig. 1c) is the signature of interactions because, in the absence of such interactions, it should be an horizontal line. This is reminiscent of the response function of the Fröhlich interaction observed in polar semiconductors [12, 13] where a zone-center longitudinal optical phonon is emitted when the energy of the cyclotron transition exceeds that of the phonon. However, graphene is not a polar material and, furthermore, we are not expecting a direct interaction of the -phonon with the infra-red light. One therefore has to explain why and how the -phonons enter the interaction.

The mechanism for the interaction of the cyclotron transition with the -phonon is not a priori clear for the reason of conservation of wavevector, i.e., a state corresponding to an optical cyclotron transition which has wavevector cannot decay into a state with a phonon of wavevector without simultaneously emitting another entity of wavevector . Given that this interaction must necessarily involve the electron-phonon interaction, and that the low-energy electronic states at the two valleys of graphene are separated in reciprocal space by a wavevector , we propose that an intervalley intra-LL electron scattering process (creation of a zero-energy intervalley electron-hole pair) is responsible for the observed phenomenon (Fig. 2.)
To explain the observed spectral features, we shall consider the coupling of the photo-excited (cyclotron transition) states (denoted as and for the and LL transitions respectively) with an excited state of the system containing an intervalley, intra-Landau level electron-hole pair excitation and a -phonon of wavevector (denoted as ). See Fig. 2. Here is the valley index and is the quantum number which describes the degenerate states within a LL. As illustrated in Fig. 2, at cyclotron transition energy near , and are connected to via an emission of phonons. The electron-phonon coupling in the system can then strongly mix these states at resonance and lead to significant changes in the absorption spectrum.
In order to reproduce quantitatively the transmission spectra, one has now to use the multi-layer dielectric model (see SI-II for details). The optical conductivity is calculated using the Green’s function formalism introduced by Toyozawa [18]. The conductivity components are
| (2) |
where is the ground state of the system, and , are row and column vectors containing optical matrix elements. is the retarded Green’s function written here as with with being a 3x3 Hamiltonian describing the interaction between the three states , and . The poles of are broadened by a self energy reflecting additional lifetime effects due to the -phonon dispersion and the excitations from electron-acoustic phonons scattering, electron-electron interactions and other environmental effects not captured by (see SI-V). In the theoretical calculations, we have incorporated this additional physics near resonance with a broadening function of the form with given above and taken to be . The derivation of the form of within our theoretical model is given in SI-IV and SI-V. is the electron-phonon parameter determined from Ref. [16]. is a factor, dependent on the relative magnitudes of the valley () and spin () spittings of the LL, that is determined by the occupations of the spin and valley sublevels of the LL (see SI-IV). The threshold structure of represents the onset of -phonon emission at energies above . The only parameters in the theory are the phonon energy and the factor . The absorption spectra can be obtained from by a simple proportionality relation (see SI-V and [9]).

In Fig. 3 we compare the experimental data, for sample S1, with the calculated results from the model with . We have taken and . The Fermi velocity for the transitions between the LL and LL has been determined experimentally from the positions of the cyclotron transition lines (see SI-II and SI-III.) The same parameters have been used for all the graphene samples (see SI-III). The good agreement between theory and experiment, for all samples, lends strong support to the physical mechanism proposed for the phenomenon. It is , however only obtained when assuming (Fig. 4).
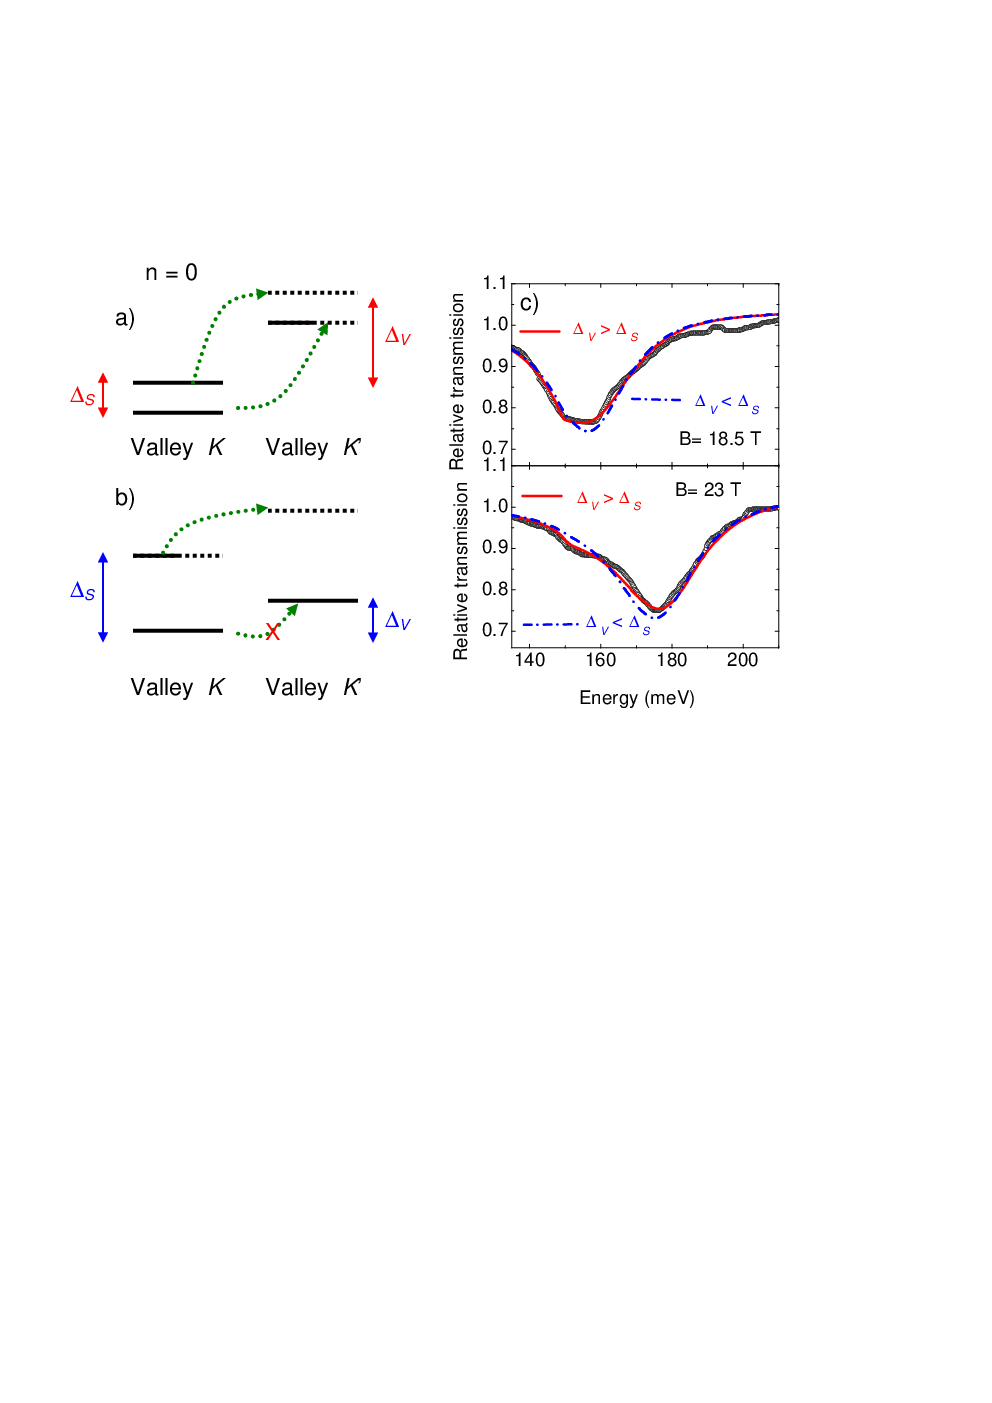
An interpretation of the linear term in is that it may be a broadening resulting from the breaking of the valley degeneracy (Fig. 4), consistent with the prediction that , according to several theoretical models [20, 21, 22]. In this picture, the values of at the two valleys differ by [23], resulting in a broadening of the main line by a similar amount. An inspection of the linear term in shows that it is greater than the value of due to Zeeman splitting. This is consistent with our conclusion that in our samples (Fig. 4). However, further investigations are needed to test if the valley splitting is indeed the main contributor to the linear term in .
To conclude, we have observed splitting of spectral features and broadening of the main absorption line above 17 T in our infra-red transmission experiments on epitaxial graphene that we attribute to a resonance between cyclotron transitions and K-phonon emission coupled with a zero-energy intervalley electron-hole excitation. We have developed a theoretical model that reproduces the experimental results with quantitative agreement, thereby shedding light on the nature of the optical transitions and electron-phonon interaction in graphene under strong magnetic fields. Our results indicate that the valley splitting of the LL is larger than the spin splitting in our samples. To our knowledge, this is the first instance where information on the sublevel structure of graphene has been obtained using infra-red transmission measurements, complementing transport- [26, 27] and tunnelling-based [19] experiments.
We thank Cheol-Hwan Park for useful discussions. L.Z.T. and the theoretical analysis were supported by the Director, Office of Science, Office of Basic Energy Sciences, Materials Sciences and Engineering Division, U.S. Department of Energy under Contract No. DE- AC02-05CH11231. Numerical simulations were supported in part by NSF Grant DMR10-1006184. Computational resources were provided by NSF through TeraGrid resources at NICS and by DOE at Lawrence Berkeley National Laboratory’s NERSC facility.This work has been supported in part by by EuroMagNET II under EU Contract No. 228043. This work has also been supported by projects GACR P204/10/1020, GRA/10/E006 (Eurographene-EPIGRAT) and IRMA.
References
- [1] A. Bostwick et al., Science 328, 999-1002 (2010).
- [2] C.-F. Chen et al., Nature 471, 617-620 (2011).
- [3] L. Yang et al., Phys. Rev. Lett. 103, 186802 (2009).
- [4] V. G. Kravets et al., Phys. Rev. B 81, 155413 (2010).
- [5] K. F. Mak, J. Shan and T. F. Heinz, Phys. Rev. Lett. 106, 046401 (2011).
- [6] H. Suzuura and T. Ando, J. Phys. Soc. Jpn. , 77, 044703 (2008).
- [7] A. Bostwick et al., Nature physics 3, 36-40 (2007).
- [8] A. C. Ferrari et al., Phys. Rev. Lett. 97, 187401 (2006).
- [9] M. L. Sadowski et al.,Phys. Rev. Lett. 97, 266405 (2006).
- [10] C. Berger et al., J. Phys. Chem. B 108,19912-19916 (2004)
- [11] J. Hass et al., Phys. Rev. Lett. 100, 125504 (2008).
- [12] C. Faugeras et al., Phys. Rev. B 80, 073303 (2009).
- [13] M. Orlita et al.,Euro. Phys. Lett. 92, 37002 (2010).
- [14] C. H. Yang, F. M. Peeters and W. Xu, Phys. Rev. B 82, 075401 (2010). ibid, Phys. Rev. B 82, 205428 (2010).
- [15] J. Maultzsch, S. Reich, C. Thomsen, H. Requardt and P. Ordejón, Phys. Rev. Lett. 92, 075501 (2004).
- [16] A. Grüneis et al., Phys. Rev. B 80, 085423 (2009).
- [17] U. Fano, Phys. Rev. 124, 1866-1878 (1961).
- [18] Y. Toyozawa et al., J. Phys. Soc. Jpn. 22 1337-1349 (1967).
- [19] Y. Song et al., Nature 467, 185-189 (2010).
- [20] K. Nomura and A. MacDonald, Phys. Rev. Lett. 96, 256602 (2006).
- [21] J. Alicea and M. Fisher, Phys. Rev. B 74, 075422 (2006).
- [22] K. Yang, S. Das Sarma and A. MacDonald, Phys. Rev. B 74, 075423 (2006).
- [23] J.-N. Fuchs and P. Lederer, Phys. Rev. Lett. 98, 016803 (2007).
- [24] M. O. Goerbig, R. Moessner and B. Doucot, Phys. Rev . B 74, 161407 (2006)
- [25] D. Abanin, P. Lee and L. Levitov, Phys. Rev. Lett. 98, 156801 (2007).
- [26] K. Bolotin et al., Nature 462, 196-199 (2009)
- [27] X. Du et al., Nature 462, 192-195 (2009).