GRB 120422A: A Low-luminosity Gamma-ray Burst Driven by Central Engine
Abstract
GRB 120422A is a low-luminosity Gamma-ray burst (GRB) associated with a bright supernova, which distinguishes itself by its relatively short ( s) and an energetic and steep-decaying X-ray tail. We analyze the Swift BAT and XRT data and discuss the physical implications. We show that the early steep decline in the X-ray light curve can be interpreted as the curvature tail of a late emission episode around 58-86 s, with a curved instantaneous spectrum at the end of the emission episode. Together with the main activity in the first s and the weak emission from 40 s to 60 s, the prompt emission is variable, which points towards a central engine origin, in contrast to the shock breakout origin as invoked to interpret some other nearby low-luminosity supernova GRBs. The curvature effect model and interpreting the early shallow decay as the coasting external forward shock emission in a wind medium both give a constraint on the bulk Lorentz factor to be around several. Comparing the properties of GRB 120422A and other supernova GRBs, we find that the main criterion to distinguish engine-driven GRBs from the shock breakout GRBs is the time-averaged -ray luminosity. Engine-driven GRBs likely have a luminosity above .
Subject headings
X-rays: general—gamma ray burst: generalI. Introduction
GRB 110422A triggered the Burst Alert Telescope (BAT; Barthelemy et al. 2005) on-board Swift at 07:12:03 UT on 2012 April 22 (Troja et al 2012). Swift slewed to the burst immediately. The two narrow field instruments, the X-ray Telescope (XRT; Burrows et al. 2005) and the Ultraviolet Optical telescope (UVOT; Roming et al. 2005) on-board Swift began to observe the field at s and s, respectively, where is the BAT trigger time. A bright X-ray afterglow was localized at , with an uncertainty of 19 (90% confidence, Beardmore et al. 2012). A UVOT source was found within the XRT error circle (Kuin & Troja 2012) and was confirmed by several ground follow-ups (e.g., Tanvir et al. 2012; Nardini et al 2012; Rumyantsev et al. 2012). A redshift was measured, and an associated supernova was soon discovered (Malesani et al 2012a, b; Melandri et al 2012; Wiersema et al. 2012; Sanchez-Ramirez et al 2012). This firmly places the burst in the massive-star core collapse category (Type II/Long, Zhang et al. 2009a). An unusual property of the burst is the large offset of the GRB position from the center of its host galaxy, which is often interpreted as evidence for a compact-star-merger origin (Type I/short) of the burst (had the associated SN not been discovered). This might be related to massive star formation/death in an interacting system (Tanvir et al 2012; Sanchez-Ramirez et al 2012).
In this paper, we focus on the early-time Swift data of this burst, aiming at understanding its physical origin. We present our data analysis of the BAT and XRT data in §2, and compare GRB 120422A with other SN-associated GRBs in §3. In §4, we then discuss the possible physical origins of prompt emission and early afterglow and constrain the bulk Lorentz factor. The results are summarized in §5, along with a discussion on the physical implications of this event.
II. Data analysis
We processed the Swift/BAT data using standard HEAsoft tools (version 6.11). As shown in Fig. 1, the main burst lasted from seconds to seconds with seconds. We extracted the BAT spectra in five time slices. The lower panel in Fig. 1 shows the photon indices obtained by fitting the spectra with a simple power-law model. It is obvious that this burst has a strong hard-to-soft spectral evolution, which is similar to most other Swift/BAT GRBs. The photon indices range from to . The time-integrated spectrum from s can be fitted with a simple power law with photon index . Weak emission (at 3 level) was observed at s with a low-significance peak at s and photon index . No significant pre-trigger emission was detected in the BAT band up to s.
The BAT band (15-150 keV) peak flux is 0.6 0.2 photons cm-2 s -1, and the total fluence is about . For a burst at a redshift , this corresponds to a peak luminosity erg s-1 and total isotropic energy erg. The peak luminosity is well below the typical luminosity erg/s of bright GRBs, but is considerably higher than those of some nearby low-luminosity GRBs (e.g. erg/s).
In a standard fashion, we processed the Swift/XRT data using our own IDL code which employs the standard HEAsoft analysis tools. For technical details please refer to Zhang et al. (2007a). Fig. 2 shows the XRT light curve and spectral evolution. The XRT light curve shows an unusually steep (decay slope 6) X-ray tail between s to s, then followed by a shallow decay phase with decay slope . A break is observed at s before the final normal decay phase (decay slope ). The X-ray spectrum can be fitted with an absorbed power-law. Strong spectral evolution was observed in the steep decay phase where the photon indices vary significantly from to . The late time spectrum has no significant evolution with an average photon index . The total fluence in the XRT band (0.3-10 keV) is (from s to s; corrected for XRT observation gaps).

III. Comparison with other supernova GRBs
As shown in Table 1, among the bursts associated with a well-monitored supernova, GRB 120422A distinguishes itself by the following facts: (1) it has the shortest ; (2) the initial luminosity of the X-ray radiation is high (e.g. greater than that of GRB 060218 and GRB 100316D by a factor of 100, see Fig.4) and the temporal decay slope is steep; (3) the X-ray afterglow plateau is also significantly brighter than GRB 060218 and GRB 100316D in the same time frame (i.e., - s), even though the total prompt emission /X-ray energies of these three bursts are comparable. This suggests that a much higher energy is carried by the relativistic outflow in GRB 120422A. In fact, among the bursts with a well-monitored spectroscopic supernova detected so far (the “Gold” sample in Table 1), at one day after the burst, the X-ray afterglow of GRB 120422A is only dimmer than that of GRB 030329, a typical high luminosity GRB in the nearby universe. (4) There is a large offset ( kpc; Tanvir et al 2012) between the burst location and the center of its host galaxy, which is rather unusual for massive star core-collapse GRBs (see e.g., Fruchter et al. 2006; Zhang et al 2009a). Within the Gold sample of supernova GRBs, the isotropic gamma-ray energy of GRB 031203, GRB 060218, GRB 100316D, GRB 120422A are rather similar. Interestingly they seem to belong to two sub-classes. As already noticed earlier (e.g., Fan et al 2011; Starling et al. 2011), XRF 060218 and XRF 100316D are cousins, since both their spectral and temporal behaviors are rather similar (see also Fig.4), except that the former was associated with a less energetic SN 2006aj. On the other hand, GRB 120422A and GRB 031203 share quite a few similarities. For example, they are both relatively short; their peak luminosities during the prompt emission phase are almost identical; their 15-150 keV spectra are both soft with spectral indices ( is defined as ); and their late-time ( day) X-ray afterglow luminosities are comparable with each other, but are significantly brighter than GRB 060218 and XRF 100316D.
| GRB | Ref.bbReferences: [1] Hjorth & Bloom (2011); [2] Zhang et al. (2008); [3] Sazonov et al. (2004); [4] Sakamoto et al. (2010); [5] Barthelmy et al. (2012); [6] Schulze et al. (2012); [7] Garnavich et al. (2003); [8] Sakamoto et al. (2004); [9] Soderberg et al. (2004); [10] Crew et al. (2003); [11] Blustin et al. (2006); [12] Jin et al. (2012); [13] Sparre et al. (2011). | ||||
| (s) | (keV) | ( erg) | |||
| Gold11 1 The gold sample includes Type II GRBs that have spectroscopically identified supernova association, and also well-monitored supernova emission. The Silver sample includes GRBs that have a clear supernova bump along with some spectroscopic evidence. The similar categorization was also adopted by Hjorth & Bloom (2011). | |||||
| 980425 | 0.0085 | 34.93.8 | 12217 | 1,2 | |
| 030329 | 0.1685 | 22.9 | 702 | 13 | 1 |
| 031203 | 0.1055 | 37.01.3 | 0.17 | 1,3 | |
| 060218 | 0.0334 | 2100100 | 4.71.2 | 0.04 | 1,2 |
| 100316D | 0.0591 | 1300 | 18 | 0.06 | 1,4 |
| 120422A | 0.283 | 5.351.4 | aafootnotemark: | 0.045 | 5,6 |
| Silvera | |||||
| 011121 | 0.362 | 27 | 7 | ||
| 020903 | 0.251 | 0.011 | 8,9 | ||
| 021211 | 1.006 | 6.6 | 10 | ||
| 050525A | 0.606 | 23 | 11 | ||
| 081007 | 0.5295 | 8 | 1.5 | 12 | |
| 101219B | 0.55 | 51 | 4.2 | 13 | |

IV. X-ray afterglow modeling and engine-driven GRB
IV.1. The steep decay phase
The steep decay phase is commonly observed in Swift GRBs (e.g. Tagliagerri et al. 2005; Barthelmy et al. 2005). The standard interpretation of this phase is the “curvature” tail of the prompt emission (Fenimore et al. 1996; Kumar & Panaitescu 2000; Zhang et al. 2006; Liang et al. 2006; Zhang et al. 2009b), which arises from delayed photon emission from high latitudes with respect to the line of sight upon the abrupt cessation of the prompt emission. Other interpretations include rapid expansion of a thermal plasma associated with shock breakout or a hot cocoon surrounding a jet after exiting the progenitor star (e.g. Fan et al. 2006; Pe’er et al. 2006).
In the shock breakout picture (Fan et al. 2006), a quick decline in X-rays is possible for a quasi-thermal spectrum for . The temperature drops with time as , where if the width of the hot material is fixed, or if the width of the hot material is proportional to the radius . Taking as an example, i.e., , the XRT-band luminosity can be expressed as
| (1) |
where is a constant and is a function of . In principle, this model can give rise to a progressively steepening steep-decay phase with rapid spectral evolution (for keV). This model does not fit the data. Also the emergence of a shallow decay component is not expected within such a scenario.
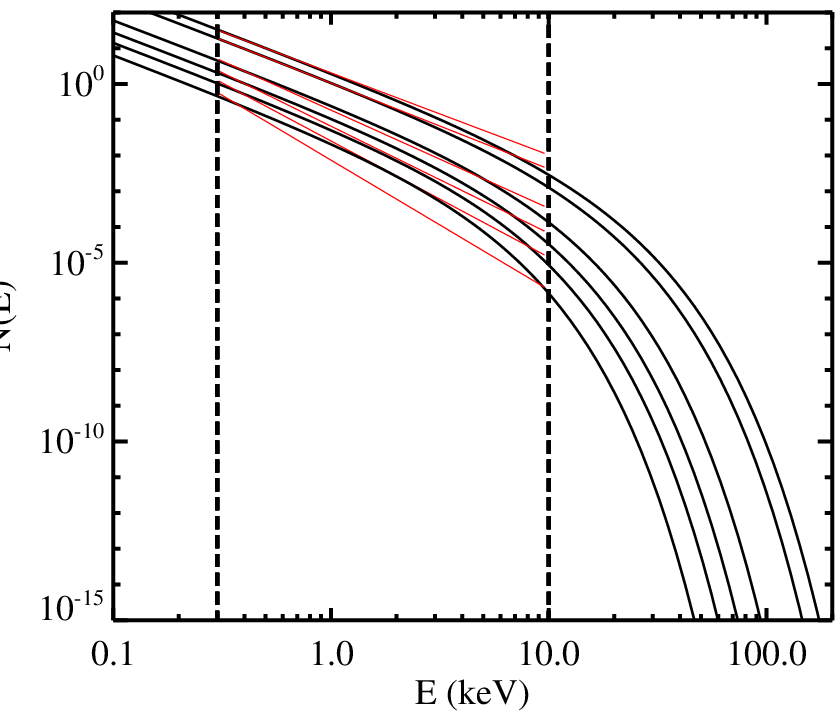
We then investigate the curvature effect model for a non-power-law spectrum (Zhang et al. 2009b). We consider a time-dependent cut-off power-law photon spectrum taking the form
| (2) |
where is the power-law photon spectral index, is the time-dependent characteristic cut-off photon energy, is a time-dependent photon flux, and refers to the time origin of the last/main pulse in the prompt emission. Denoting as the peak time of the last pulse, one can derive time-dependent decay index and the effective spectral index using the formalism derived in Zhang et al. (2009b). For GRB 120422A, cannot be inferred from the XRT light curve, since the X-ray already entered the steep decay phase when the XRT slewed to the source. To constrain , we extrapolate the BAT flux to the XRT band assuming a simple power law model extending all the way to the XRT band. It is found that the extrapolated BAT flux to the XRT band and the observed XRT light curve intersect around the time when the XRT observation started (Fig.2). We thus take s (the beginning of XRT observation) in our modeling.
We successfully fit both the observed light curve and the photon index curve with our model, and get the following best-fit parameters: , keV, , s, with . (Fig.2). Figure 3 gives the modeled spectra as a function of time. This suggests that there was likely a central-engine-powered emission in the time interval . Together with the main activity in the first s and the weak/soft radiation from 40 s to 60 s, the variability of the prompt emission of GRB 120422A is well established. This strongly favors a central engine origin of the observed prompt emission.
For high latitude emission, a rough constraint on the emission radius, and hence, bulk Lorentz factor of the outflow (within the framework of the internal shock model) may be imposed (e.g. Zhang et al. 2006; Jin et al. 2010). The length of the tail emission can be expressed as , where is the variability time scale, and is the jet opening angle. Plugging in the numbers, i.e. s, s, one can derive a constraint
| (3) |
For , the corresponding constraints are , respectively.
IV.2. The plateau phase
Following the steep decay phase is an X-ray plateau, lasting until 1 day after trigger. This component is commonly observed in high-luminosity GRBs, and there is no consensus regarding its interpretation. We discuss the following two possible interpretations:
Scenario I: The X-ray plateau is due to the forward shock emission of a mildly relativistic outflow during the “coasting phase” before significant deceleration starts (e.g. Shen & Matzner 2012). For a wind medium with density profile , one can show that the decay rate is very shallow in this phase, i.e. , if the X-ray band frequency satisfies . The post-deceleration decay behavior in the same spectrum regime is . Both behaviors are in agreement with the data.
This interpretation leads to the following constraints: (1) the outflow deceleration time , where s is the shallow-to-normal break time; (2) the external forward shock flux density at is as measured, Jy; (3) ; and (4) , where s and s are the observed starting time of the shallow decay and the lower limit of the end time of normal decay, respectively. The last two constraints are set in order to satisfy the spectral regime requirement for both the plateau and the normal decay phase, and are utilizing the model prediction that decreases and increases both with monotonically. We follow the formulae in Shen & Matzner (2012, Eqs. 14-17 therein) which are based on the standard external shock synchrotron emission calculation (e.g., Sari et al. 1998) and include the numerical correction factor due to internal structure of shock and the equal-arrival-time surface (Granot et al. 1999). We adopt keV and use as observed.
Constraint (2) gives the wind medium density normalization
| (4) |
where is the initial Lorentz factor of the outflow, and and are the shock s electron and magnetic equipartition parameters, respectively. Combining constraints (1) and (2) gives the isotropic equivalent kinetic energy of the outflow
| (5) |
Constraint (3) is trivial and easily satisfied. Utilizing Eq. (4), constraint (4) gives
| (6) |
This constraint is consistent with the curvature effect constraints if . So the entire afterglow data are consistent with a wide jet with a moderately high Lorentz factor .
Scenario II: If the jet is narrower, say , the X-ray plateau cannot be interpreted as the pre-deceleration forward shock in a wind medium. The deceleration time has to be much earlier, and the extended plateau can be interpreted as forward shock emission with significant energy injection22 2 An alternative solution is to explain plateau phase as late prompt emission (see, e.g., Ghisellini et al. 2007). (e.g. Zhang et al. 2006 and the references therein). There are two possible cases. Case (A): One can argue that the central engine is a millisecond magnetar with a dipole radiation luminosity and a spin down timescale s. This gives a constraint on the surface magnetic field Gauss and the initial spin period ms. One potential challenge of this scenario is that the efficiency of the forward shock radiation in XRT band has to be extremely small (say, very low ). Otherwise, the resulting X-ray emission would be much brighter than what is observed. Case (B): One may argue that the outflow has a Lorentz factor distribution and the distribution satisfies .
In both scenarios, the X-ray flux at s constrains the total kinetic energy of the outflow at that time, which is given by Equation (5). However, the total kinetic energy of the initial outflow that produces the prompt burst, , is different for the two scenarios. In scenario I, , while in scenario II, .
V. Conclusions and Discussion
We have analyzed the BAT and XRT data of the nearby, low-luminosity, supernova-associated GRB 120422A. Even though of the burst is short, BAT emission shows extended fluctuation signals, suggesting a possible extended central engine activity. This is confirmed by the XRT data, which showed a rapid decline followed by an extended plateau similar to most other high-luminosity GRBs. The rapid decline tail can be modeled by the curvature effect model of Zhang et al. (2009b). The derived beginning time of the last emission episode is about 58 s, with the last peak near 86 s. Various arguments (see below for more discussion) suggest that this low-luminosity GRB is central-engine-driven, rather than powered by shock breakout. The Lorentz factor of the ejecta is constrained to be at least moderately relativistic.
As discussed above, an engine-driven origin is supported by the following facts: (1) The -ray light curve is variable; (2) the rapidly decaying prompt tail emission is inconsistent with a cooling thermal emission component from shock breakout, but is consistent with the curvature tail of a successful jet; and (3) a long lasting X-ray shallow decay followed by the steep decay is consistent with external shock emission of a successful jet.
Some nearby low-luminosity GRBs may have signature of shock breakout (e.g. GRB 060218, Campana et al. 2006; Waxman et al. 2007, but see Ghisellini et al. 2006, 2007; Li 2007; Bjornsson 2008; Chevalier & Fransson 2008; Page et al. 2011). The event rate of nearby low-luminosity GRBs is much higher than the simple extrapolation of the high-luminosity GRB event rate, making a distinct population (e.g. Soderberg et al. 2006; Liang et al. 2007; Virgili et al. 2009; Coward 2005). Some authors have suspected that low-luminosity GRBs may be unsuccessful jets, and the radiation signal is mostly powered by shock breakout. The relativistic shock break out model predicts a “fundamental plane” correlation (Nakar & Sari 2012). For the parameters of this burst, erg and keV, the predicted shock breakout duration is s, much longer than s, or the extended duration derived from the curvature effect fitting. This is a strong evidence against the shock breakout interpretation of this burst.


In the collapsar model for GRBs, in order to make a successful jet, the central engine has to be active for a duration longer than the time for the jet to penetrate the star before breaking out. Otherwise the jet would be choked inside the star or quickly spread out upon the breakout. Considering the collimation of the jet by a surrounding cocoon, Bromberg et al. (2011) estimate the breakout time as
| (7) | |||||
where is the burst radiation efficiency, and is the initial opening angle of the jet when it is injected from the central engine. Statistically, one would expect that the observed burst duration to be comparable or longer than this duration. For GRB 120422A, even if is shorter than this jet penetration time, the real duration of the successful jet is actually near 86 s, as is constrained by the curvature effect modeling. The jet breakout condition is therefore satisfied.
What is the separation line between the engine-driven and shock-break GRBs? In Fig.5 all the supernova GRBs are plotted in the plane of time-averaged luminosity and . It is shown that above , an engine-driven GRB is possible. Shock breakout luminosity cannot be much higher than this value. GRB 120422A belongs to the low end of engine-driven GRBs.
How could a successful GRB jet have such a low luminosity? The first possibility may be related to its relatively low Lorentz factor (for the scenario I of plateau interpretation). If this burst satisfies the empirical and relations (Liang et al. 2010; Lü et al. 2012; Fan et al. 2012), one would expect a moderately low . This is generally consistent with the model constraints of . Low- outflows tend to have low emissivities. This can be due to an intrinsically low wind luminosity, or a smaller radiation efficiency for an otherwise normal wind luminosity. This second possibility can be related to internal shock model when the relative Lorentz factor between the colliding shells is small (e.g. Barraud et al. 2005). Alternatively, the low luminosity can be related to the viewing angle effect. A low-luminosity GRB can be obtained by an observer viewing at a large angle from the jet axis of a structured jet (e.g. Zhang et al. 2004a). This may be relevant for a hot cocoon surrounding a successful jet (e.g. Zhang et al. 2004b), which is consistent with low-, large scenario discussed in this paper. The scenario can be tested with the late-time radio observations, which would give a more robust measure of the total energetics of the event.
References
- [1] Barraud, C., Daigne, F., Mochkovitch, R., & Atteia, J. L. 2005, A&A, 440, 809
- [2] Barthelmy, S. D. et al. 2005, Space Science Reviews, 120, 143
- [3] Barthelmy, S. D., Baumgartner, W. H., Cummings, J. R., et al. 2012, GCN. Circ. 13246
- [4] Beardmore, A. P., Evans, P. A., Goad, M. R., & Osborne, J. P. 2012, GCN. Circ. 13247
- [5] Björnsson, C.-I. 2008, ApJ, 672, 443
- [6] Blustin, A. J., Band, D., Barthelmy, S., et al. 2006, ApJ, 637, 901
- [7] Bromberg, O., Nakar, E., Piran, T., Sari, R., 2011, ApJ, 740, 100
- [8] Burrows, D. N., et al., 2005, Space Science Reviews, 120, 165
- [9] Campana, S. et al., 2006, Nature, 442, 1008
- [10] Chevalier, R. A., & Fransson, C. 2008, ApJ, 683, L135
- [11] Coward, D. M. 2005, MNRAS, 360, L77
- [12] Crew, G. B., Lamb, D. Q., Ricker, G. R., et al. 2003, ApJ, 599, 387
- [13] Fan, Y. Z., Piran, T., & Xu, D. 2006, JCAP, 09, 013
- [14] Fan, Y. Z., Zhang, B. B., Xu, D., Liang, E. W., & Zhang, B. 2011, ApJ, 726, 32
- [15] Fan, Y.-Z., Wei, D.-M., Zhang, F.-W., & Zhang, B.-B. 2012, arXiv:1204.4881
- [16] Fenimore, E. E., Madras, C. D., & Nayakshin, S. 1996, ApJ, 473, 998
- [17] Fruchter, A. S., Levan, A. J., Strolger, L., et al. 2006, Nature, 441, 463
- [18] Garnavich, P. M., Stanek, K. Z., Wyrzykowski, L., et al. 2003, ApJ, 582, 924
- [19] Ghisellini, G., Ghirlanda, G., & Tavecchio, F. 2007, MNRAS, 375, L36
- [20] Ghisellini, G., Ghirlanda, G., Nava, L., & Firmani, C. 2007, ApJ, 658, L75
- [21] Granot, J., Piran, T., & Sari, R. 1999, ApJ, 513, 679
- [22] Hjorth, J., & Bloom, J. S. 2011, arXiv:1104.2274
- [23] Jin, Z. P., Fan, Y. Z., & Wei, D. M. 2010, ApJ, 724, 861
- [24] Jin, Z. P. et al. 2012, ApJ, to be submitted.
- [25] Kumar, P., & Panaitescu, A. 2000, ApJ, 541, L51
- [26] Kuin, N. P. M. & Troja, E. 2012, GCN Circ. 13248
- [27] Li, L.-X. 2007, MNRAS, 375, 240
- [28] Liang, E., Zhang, B., Virgili, F., Dai, Z. G. 2007, ApJ, 662, 1111
- [29] Liang, E.-W. et al. 2010, ApJ, 725, 2209
- [30] Lü, J. et al. 2012, ApJ, 751, 49
- [31] Malesani, D. et al. 2012a, GCN Circ. 13275
- [32] Malesani, D. et al. 2012b, GCN Circ. 13277
- [33] Mazzali, P. A. et al., 2006, ApJ, 645, 1323
- [34] Melandri, A., Pian, E., Ferrero, P., et al. 2012, arXiv:1206.5532
- [35] Nakar, E., & Sari, R. 2012, ApJ, 747, 88
- [36] Nardini, M., Schmidl, S.,Greiner, J., & Kann, D. A. 2012, GCN Circ. 13256
- [37] Page, K. L., Starling, R. L. C., Fitzpatrick, G., et al. 2011, MNRAS, 416, 2078
- [38] Pe’er, A., Mészáros, P., Rees, M. J. 2006, ApJ, 652, 482
- [39] Roming, P. W., et al. 2005, Space Science Reviews, 120, 95
- [40] Rumyantsev, V., Antonyuk, K., & Pozanenko, A. 2012, GCN Circ. 13273
- [41] Sakamoto, T., Lamb, D. Q., Graziani, C., et al. 2004, ApJ, 602, 875
- [42] Sakamoto, T., Barthelmy, S. D., Baumgartner, W. H., et al. 2010, GCN. Circ. 10511
- [43] Sanchez-Ramirez, R. et al., 2012, GCN Circ. 13281
- [44] Sari, R., Piran, T., & Narayan, R. 1998, ApJ, 497, L17
- [45] Schulze, S., Levan, A. J., Malesani, D., et al. 2012, GCN. Circ. 13257
- [46] Sazonov, S. Y., Lutovinov, A. A., & Sunyaev, R. A. 2004, Nature, 430, 646
- [47] Shen, R. F., Matzner, C. D., 2012, ApJ, 744, 36
- [48] Soderberg, A. M., Kulkarni, S. R., Berger, E., et al. 2004, ApJ, 606, 994
- [49] Soderberg, A. M., Kulkarni, S. R., Nakar, E., et al. 2006, Nature, 442, 1014
- [50] Sparre, M., Sollerman, J., Fynbo, J. P. U., et al. 2011, ApJ, 735, L24
- [51] Starling, R. L. C., Wiersema, K., Levan, A. J., et al. 2011, MNRAS, 411, 2792
- [52] Tagliaferri, G., Goad, M., Chincarini, G., et al. 2005, Nature, 436, 985
- [53] Tanvir, N. R., Levan, A. J., Cucchiara, A., & Fox, D. B. 2012, GCN Circ. 13251
- [54] Troja, E., et al., 2012, GCN Circ. 13243
- [55] Virgili, F., Liang, E.-W., Zhang, B. 2009, MNRAS, 392, 91
- [56] Waxman, E., Mészáros, P., & Campana, S. 2007, ApJ, 667, 351
- [57] Wiersema, K. et al., 2012, GCN Circ. 13276
- [58] Zhang, B., Dai, X., Lloyd-Ronning, N. M., & Mészáros, P. 2004a, ApJ, 601, L119
- [59] Zhang, B., et al. 2006, ApJ, 642, 354
- [60] Zhang, B., Zhang, B.-B., Liang, E.-W. et al. 2007b, ApJ, 655, L25
- [61] Zhang, B., Zhang, B.-B., Virgili, F. et al. 2009a, ApJ, 703, 1696
- [62] Zhang, B. B., Liang, E. W., & Zhang, B., 2007a, ApJ, 666, 1002
- [63] Zhang, B. B., Zhang, B., Liang, E. W., & Wang, X. Y. 2009b, ApJ, 690, L10
- [64] Zhang, F.-W. 2008, ApJ, 685, 1052
- [65] Zhang, W. Woosley, S. E., Heger, A. 2004b, ApJ, 608, 365