A FAR-ULTRAVIOLET ATLAS OF LOW-RESOLUTION HST SPECTRA OF T TAURI STARS Alternate Affiliation: Based on observations made with the NASA/ESA Hubble Space Telescope, obtained from the data archive at the Space Telescope Science Institute. STScI is operated by the Association of Universities for Research in Astronomy, Inc. under NASA contract NAS 5-26555. This work also contains results from Chandra projects 09200763 and 10200804 supported by SAO grants GO8-9024X and GO9-0020B to the University of Colorado. This work was supported in part by NASA Swift grants NNX09AL59G and NNX10AK88G, and Smithsonian Institution Chandra grants GO8-9024X, GO9-0020B, GO0-11042X, and GO1-12031X to the University of Colorado.
Abstract
We present a far-ultraviolet (FUV) spectral atlas consisting of spectra of 91 pre-main sequence stars. Most stars in this sample were observed with the Space Telescope Imaging Spectrograph (STIS) and Advanced Camera for Surveys (ACS) on the Hubble Space Telescope (HST). A few archival spectra from International Ultraviolet Explorer (IUE) and the Goddard High Resolution Spectrograph (GHRS) on the HST are included for completeness. We find strong correlations among the O I 1304 triplet, the Si IV 1394/1403 doublet, the C IV 1549 doublet, and the He II 1640 line luminosities. For classical T Tauri stars (CTTSs), we also find strong correlations between these lines and the accretion luminosity, suggesting that these lines form in processes related to accretion. These FUV line fluxes and X-ray luminosity correlate loosely with large scatters. The FUV emission also correlates well with H, H, and Ca II K line luminosities. These correlations between FUV and optical diagostics can be used to obtain rough estimates of FUV line fluxes from optical observations. Molecular hydrogen (H2) emission is generally present in the spectra of actively accreting CTTSs but not the weak-lined T Tauri stars (WTTSs) that are not accreting. The presence of H2 emission in the spectrum of HD 98800 N suggests that the disk should be classified as actively accreting rather than a debris disk. We discuss the importance of FUV radiation, including the hydrogen Ly line, on the photoevaporation of exoplanet atmospheres. We find that the Ca II/C IV flux ratios for more evolved stars are lower than those for less evolved accretors, indicating preferential depletion of refactory metals into dust grains.
Keywords:
atlases — accretion, accretion disks — stars: pre–main sequence — ultraviolet: starsI INTRODUCTION
Classical T Tauri stars (CTTSs) are young, pre-main sequence stars characterized by excess line and continuum emission produced by a circumstellar disk and accretion from the disk onto the central star. Their non-accreting counterparts, weak-lined (or naked) T Tauri stars (WTTSs or NTTSs), generally do not display excess infrared (IR) emission, indicating the absence of a dusty disk. The spectra of WTTSs also lack strong line and excess hydrogen continuum emission, indicating that no accretion is present. In recent years, large photometric and spectroscopic surveys of T Tauri stars (TTSs) at wavelengths spanning from X-rays through the millimeter range, utilizing many line and continuum diagnostics, have demonstrated that (i) most young stars lose their disks within a few million years [48, 5, 57, e.g.], (ii) stars that do not show excess mid-IR emission, which indicates the presence of warm dust, also lack accretion signatures [117, 86, 32], (iii) accretion processes are similar for central objects with masses ranging from a solar mass down to brown-dwarf masses [87, 82], (iv) the Initial Mass Function peaks at [78, 77], and (v) all CTTSs and WTTSs are coronally active [33, 44, e.g., ]. These surveys, often focusing on stars within the nearby Taurus Molecular Cloud, have provided the foundation for understanding the early evolution of our own and other planetary systems.
Although TTSs have been surveyed at most accessible wavelengths, the characterization of far-ultraviolet (FUV) emission remains sparse. FUV spectra of young stars offer intriguing diagnostics of accretion, magnetic activity, outflows, and disks [63, 53, 69, 62, e.g.,]. The emission produced by these processes plays a particularly important role in the evolution of circumstellar disks where planetary systems originate. FUV emission produced by stellar chromospheric11 1 For convenience, in the paper we refer both chromospheric emission lines (e.g., Ca II and Balmer lines) and lines emitted from the transition region (e.g., C IV and Si IV lines) as chromospheric. activity and accretion shocks causes the disk to photoevaporate at large distances during the accretion phase, removing gas in the outer disks and perhaps constricting the time a disk survives [43, e.g.,] and thus the time available for planet formation. FUV emission also modulates the chemistry at the disk surface by dissociating H2O, CO, and HCN molecules and ionizing some species (C, Si, S) with low-ionization potentials [1, 12, 13, 15]. Some important gas tracers, such as the prominent [O I] m line, have fluxes that depend directly on the FUV luminosity of the central star [118, 64, e.g.,]. The ionization at the disk surface may play a role in allowing the disk to accrete via the magneto-rotationally instability [95]. Once accretion has ceased, FUV emission is produced only by stellar magnetic activity. Measuring FUV emission also provides important constraints on the amount of EUV emission produced by young stars, which controls the survival timescale for any small amount of gas in a remnant disk [3, 4]. After a disk has dissipated and planets have formed, the EUV and FUV emission causes some evaporation of the atmospheres of “hot Jupiters” [71, 72] and remains an important input for atmospheric chemistry in planetary atmospheres [122, e.g.,].
The International Ultraviolet Explorer (IUE) pioneered UV spectroscopy of pre-main sequence (PMS) stars, revealing bright emission in many lines, including He II , C IV , C II , O I , and the rich fluorescent spectrum of molecular hydrogen (H2) [19]. Valenti et al. [111], Johns-Krull et al. [63], and Valenti et al. [109] published the PMS archive of IUE far- and near-UV spectra of 137 TTSs and 97 Herbig Ae/Be (HAeBe) stars, although only 50 of the TTSs were observed in the FUV. Together, this trilogy has laid out the foundation for our understanding of UV radiation fields from young stars, including the strength and the physical processes responsible for such emission.
However, the IUE survey of FUV emission from young stars was limited to the FUV-brightest CTTSs and included only three WTTSs, of which the latest spectral type is K0. The survey is also limited by S/N, evident in the low detection rate of H2 line emission [111, 13/32 CTTSs, ] despite subsequent observations showing that such emission is common to all CTTSs [54, 60]. Analysis of the location and kinematics of the gas that produces the FUV emission lines was also limited by the large aperture () and low spectral resolution (6 Å) of the IUE SWP camera.
Since the launch of the Hubble Space Telescope (HST) 20 years ago, the Goddard High Resolution Spectrograph (GHRS), Space Telescope Imaging Spectrograph (STIS) and the Advanded Camera for Surveys (ACS) prisms have observed over 80 PMS stars. Analyses of small subsets of these observations ( objects, and often only one) have been used to address specific issues, including (i) the details of Ly-pumped H2 emission [7, 53, 56, 54, e.g.], (ii) the H2 emission resulting from collisions with energetic electrons [13, 56, 60, 36], (iii) the influence of Ly emission and X-ray emission on disk chemistry [12, 13, 15], (iv) the ionization state of outflows [62], (v) the possibility of metal depletion in the accretion flow [53, 34], and (vi) the origin of emission from ionized gas [7, 53, 69, e.g.]. In a more complete analysis of CTTSs and WTTSs observed with the ACS PR130L prism, Ingleby et al. [60] placed very low limits on the amount of remnant H2 gas around WTTSs by finding that H2 continuum emission is always detected from CTTSs but never from WTTSs, including those that retain debris disks but are no longer accreting. Recently, Ingleby et al. [61] analyzed ten new ACS/SBC spectra of Chamaeleon I and II regions along with archival HST data of 45 TTSs and showed that the FUV emission decreases with age, correlating with the decline of accretion in CTTSs as they become nonaccretors. Of the many FUV observations of CTTSs and WTTSs obtained by HST, only a small subsample, those obtained with the E140M grating of STIS (), have also been published in a spectral atlas, the CoolCat catalog ** * http://casa.colorado.edu/~ayres/CoolCAT [8].
In this paper, we present an atlas of FUV spectra and emission line fluxes of all PMS stars observed by STIS, GHRS and ACS. This atlas surveys the strength of FUV emission from WTTSs and includes CTTSs with a wide range of accretion rates and masses. Since HST will not be able to obtain large amounts of FUV observations to correlate with extensive ground-based observations, we search for correlations between the currently available FUV observations and optical observations of the same sample to serve as a good guide for future studies. With these correlations, large volumes of optical data sets [9, e.g.,] can be used to infer the FUV emission of more distant or heavily extincted TTSs. In § 2, we describe sample selection and the details of FUV observations with various instruments. In § 3, we present flux measurements of strong atomic features, the correlation between the atomic line luminosities and stellar properties, and identification of molecular hydrogen features. In § 4, we discuss estimating FUV emission from optical observations, evolution of FUV emission from PMS stars, importance of FUV emission on the photoevaporation of exoplanet atmospheres, and the interesting special case of HD 98800 N. A summary of our findings is provided in § 5.
II SAMPLE SELECTION AND OBSERVATIONS
Table 1 lists the 91 PMS stars in our sample and information concerning their observations. The majority of the observations were obtained with the STIS G140L grating (24 stars) and ACS/SBC PR130L prism (54 stars). The observations also include eight stars observed with the STIS E140M grating and two stars observed only with the GHRS G160M grating. Three stars, CY Tau (ID: 9), DR Tau (ID: 38), and GM Aur (ID: 40) were observed with both the ACS/SBC PR130L prism and the STIS E140M grating. T Tau (ID: 14) was observed with both the STIS G140L and E140M gratings. For completeness, six stars that were observed with IUE but not with HST are included in our sample. Among the six stars, MML 34 (ID:73) was not published in the Valenti et al. [111] IUE atlas of PMS stars.
II.1 Sample Description
Table 2 summarizes the basic properties of stars in our sample. The sample consists of a collection of CTTSs11 1 For the purposes of this paper, the terms CTTSs and WTTSs are used to apply to objects with both stellar and brown dwarf masses. and WTTSs that have been observed with HST in the FUV. The high-resolution STIS spectra and the IUE spectra are biased toward stars that are brightest in the UV. Most of the stars are members of the Taurus Molecular Cloud. A small number are members of other regions, such as the TW Hya association (TWA), or are isolated. (A few tight binaries in the sample are further discussed in Appendix A.) The spectral types in the sample range from F2 to M8, which corresponds to masses of 2 down to 0.1 . Accretion rates of the objects range from to yr-1.
All members of a molecular cloud are assumed to have the same distance: pc for Taurus [14, 74], pc for Ophiuchus [75, 73], pc for Upper Sco [26], pc for Corona Australus [88], pc for Lupus I [25], pc for Cha I [76, see discussion in], pc for Perseus [31], pc for Ori OB1c, and pc for Ori [27]. TW Hya (ID: 57) has a Hipparcos distance of pc from Perryman et al. [96], and the brown dwarf 2M1207A (ID: 69) has a parallax distance of pc from Ducourant et al. [29]. The remaining TW Hya association (TWA) members have kinematic distances calculated by Mamajek [79].
In most cases, the spectral types and photospheric and accretion luminosities were adopted from the references listed in Table 2, with some changes to account for updated distance measurements. For cases where the accretion rate is obtained from White & Ghez [117], we convert the accretion rate into the accretion luminosity using the listed accretion rate, stellar radius, and stellar mass and the formula from Gullbring et al. [46]. In several cases, e.g., DR Tau (ID: 38), DP Tau (ID: 36) and DL Tau (ID: 26), the photospheric luminosity is not listed because the detected optical/IR emission is dominated by emission from the accretion shocks and the disk. These objects are frequently listed as “continuum” objects in the literature, though some have spectral types that have been obtained by measuring heavily veiled photospheric absorption lines in high-resolution optical spectra.
Extinctions are obtained from the listed references in Table 2. The uncertainty in extinction estimates is often not listed. For the purposes of this paper, we assume that most extinctions are uncertain by mag, which introduces a factor of , , and error in luminosities of the O I , C IV , and Ca II K lines, respectively. In some cases, such as members of the TWA, the extinction is negligible and does not contribute any uncertainty to the line luminosities.
For a few stars in the sample, two or four exposures were taken consecutively by STIS, as indicated by the third-to-last column (N number of exposures) in Table 1. We examined the individual spectra and did not find substantial short-term variability between successive exposures. We therefore coadded the spectra, weighted by exposure time, and then measured the line fluxes. For AU Mic, there are 180 spectra available in the archive, and we picked 32 spectra from two consecutive days and coadded them.
For the four stars observed with both STIS G140L and ACS or both STIS G140L and E140M gratings, we used the FUV luminosities from the STIS G140L spectra for correlations, because of its better balance between spectral resolution and signal-to-noise. The total FUV luminosities measured from IUE are typically unreliable for CTTSs and WTTSs because the noise is high relative to the continuum and the detector often saturates at longer wavelengths.
II.2 Observations with Different Instruments
Table 3 summarizes the properties of the different instruments that were used to obtain the data for this survey, including aperture size, wavelength coverage, spectral resolution ) and typical C IV flux levels below which the measurement uncertainty becomes greater than 10% (see discussion in §4.1 and Appendix B). Below, we describe briefly the characteristics of each instrument as well as its data access and reduction procedures.
II.2.1 HST GHRS
GHRS was a first-generation HST FUV spectrograph. The GHRS observations of CTTSs were obtained at moderate resolution through the large () aperture and covered only Å regions, which were centered on the bright C IV doublet at 1550 Å and the bright Si IV doublet at 1400 Å. The GHRS spectra of eight CTTSs were published by Ardila et al. [7]. We obtained these spectra from the Multimission Archive at the Space Telescope Science Institute (MAST; http://archive.stsci.edu). The spectra were reduced using the standard On The Fly Reprocessing (OTFR) pipeline at MAST [106] before being downloaded from the archive.
II.2.2 HST STIS E140M
The second-generation HST instrument, STIS, is an echelle spectrograph that offers high spectral resolution () across the 1170–1700 Å wavelength region in the E140M mode. When observing the young stars, the echelle mode of STIS used very small apertures (, , and ), which minimizes any contribution from spatially extended emission. STIS E140M spectra of six CTTSs were published by Herczeg et al. [54]. The eight young stars observed with STIS E140M grating in our sample were obtained from the CoolCAT spectral atlas of cool stars [8].
II.2.3 HST STIS G140L
The G140L grating on STIS is a low-resolution () spectrograph that covers the 1150–1700 Å wavelength region. A total of 24 CTTSs were observed with STIS/G140L, typically with the aperture. The spectra were reduced using the standard OTFR pipeline before being downloaded from the MAST archive. Most STIS G140L spectra in our sample were published by Calvet et al. [22] and Bergin et al. [13].
II.2.4 HST ACS/SBC PR130L
The Solar Blind Channel (SBC) on ACS observed 54 TTSs with the PR130L prism, which yields a spectral resolution of near 1350 Å but decreasing to at 1650 Å. Each visit consists of an image with one of several long-pass filters and a prism spectrum. The 2D images were obtained from the MAST archive, as calibrated by the OTFR pipeline. We extracted the spectra using custom IDL routines, with a wavelength solution and extraction window based on the positional offsets between the location of the object in the image and the slitless spectrum [70]. The counts spectrum was obtained using a 9-pixel extraction window centered on the spectral trace and was then converted to a flux spectrum based on the sensitivity function calculated by Larsen [70]. Of the 54 ACS/SBC PR130L spectra, 30 spectra were published by Ingleby et al. [60].
II.2.5 FUSE and IUE Spectra of TW Hya and AU Mic
The Far Ultraviolet Spectroscopic Explorer (FUSE) covers the 912–1184 Å region with and a aperture [83]. We present fluxes from FUSE spectra of TW Hya (ID: 57), a CTTS, and AU Mic (ID: 90), a WTTS, to provide readers with an estimate of the total FUV flux down to 912 Å for both sources. FUSE observed AU Mic on 26 August 2000 and 10 October 2001 for a total of 43.8 ks [99, 35]. FUSE observed TW Hya on 3 June 2000 and again, with a much deeper spectrum, on 20-21 February 2003 [62].
We present the IUE LWR-LO spectra of TW Hya and AU Mic to show typical near-UV fluxes of TTSs from 1700 to 3000 Å. IUE observed TW Hya on 29 October 1979 for 3600 s. IUE observed AU Mic at multiple epochs. We averaged the spectra from exposures on 4–6 August 1980 for a total of 32.4 ks.
II.2.6 Optical Spectra
We supplemented the HST/FUV observations with ground-based optical spectra of many of the same targets, obtained with the Double Spectrograph [91] on the Hale 5m Telescope on Mount Palomar in January and December 2008. The optical spectra span most of the 3200–8700 Å range with . Fluxes in H, H, and Ca II H lines were extracted for this paper, with an uncertainty in flux calibration of 10%. The full dataset will be described in a future paper.
II.2.7 X-Ray Luminosity
In Table 2, we include the available measurements of X-ray luminosity for the UV sample obtained from both the literature and new dedicated observations. Many of the measurements for stars in the Taurus-Auriga star formation region are taken from the XMM-Newton XEST survey [44].
New Chandra ACIS observations of LkCa 4 (ID: 8), DE Tau (ID: 12), GM Aur (ID: 40), TWA 13 N and S (ID: 61 and 62), TWA 8 S and N (ID: 65 and 66 ), and TWA 9 N and S (ID: 67 and 68) and Swift observations of TWA 7 (ID: 55) and TWA 3 S and N (ID: 58 and 59 ) were analyzed for this paper and the derived X-ray luminosities are included in Table 2. The Chandra and Swift data were modeled using XSPEC (Version 12.5) and fluxes and luminosities over the energy range 0.3-10.0 keV were measured.
III Results
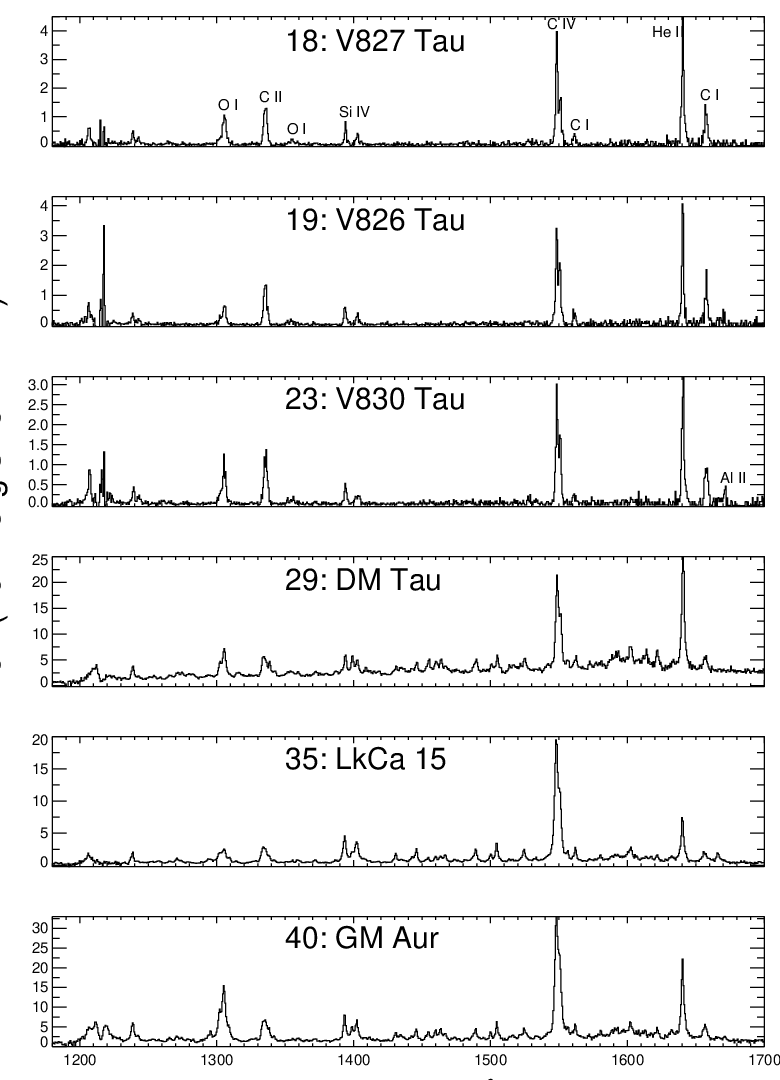
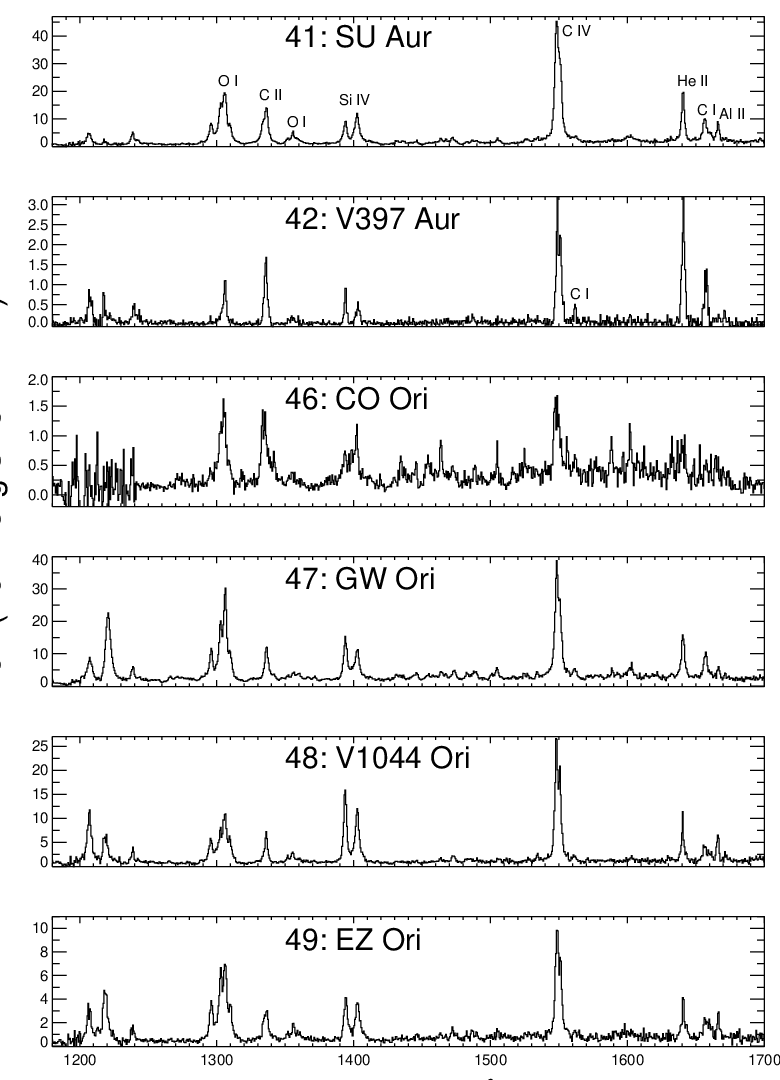
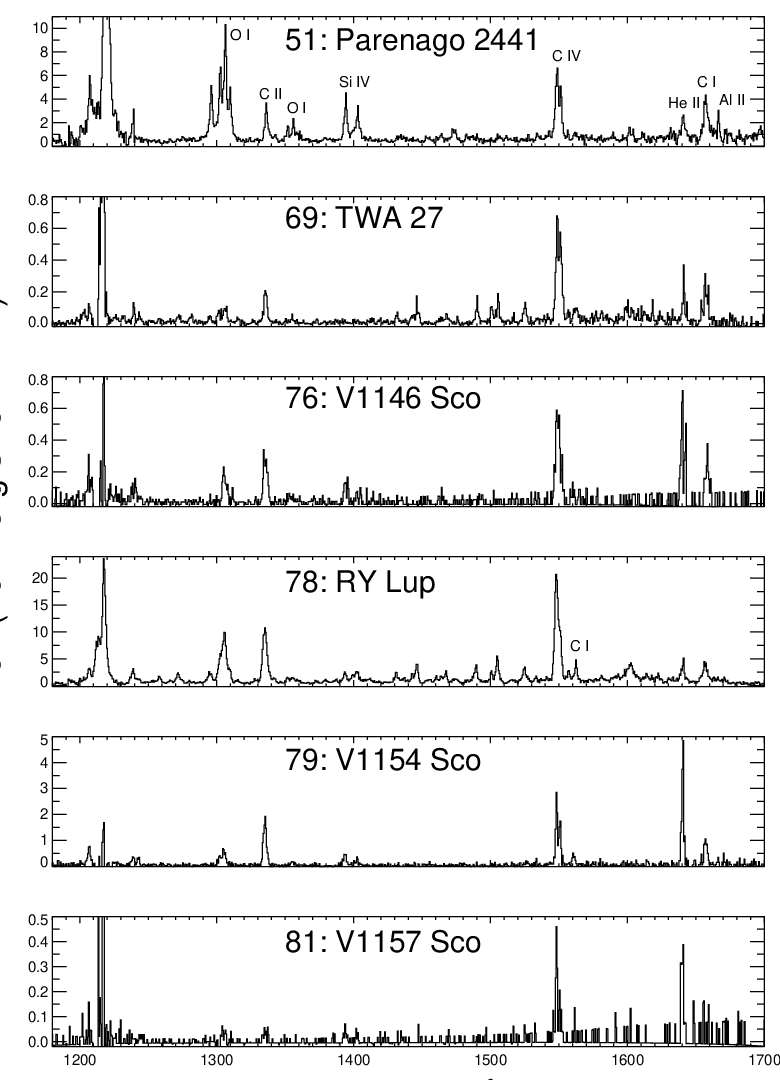
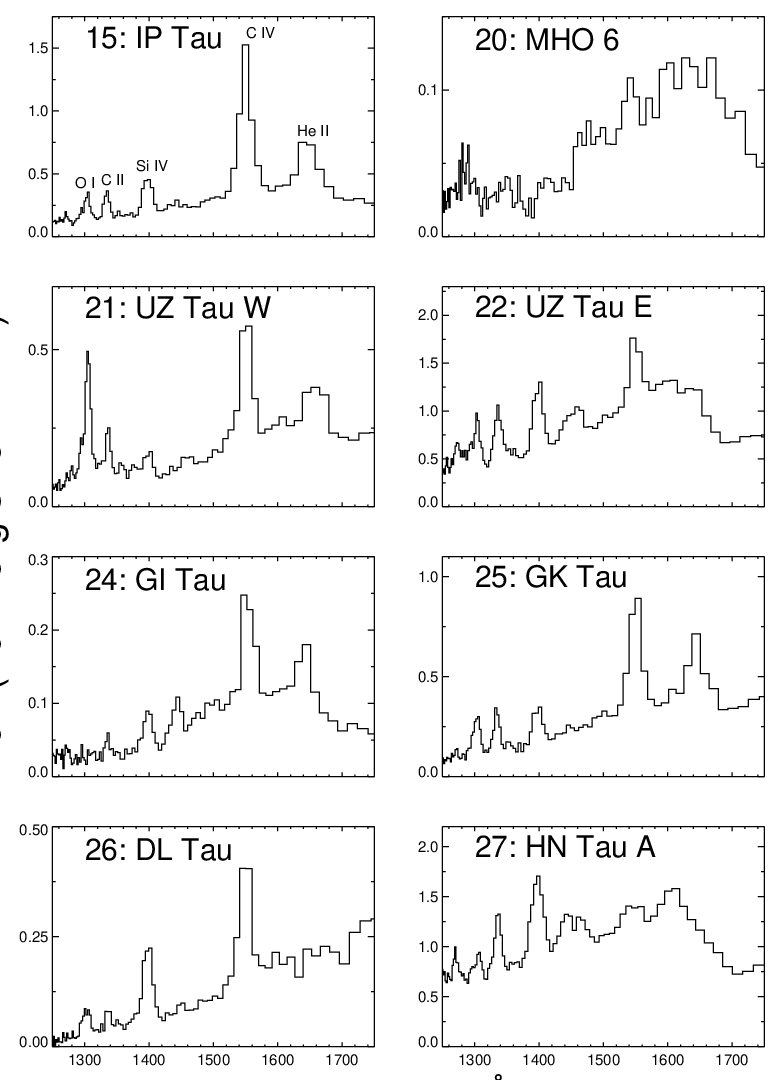
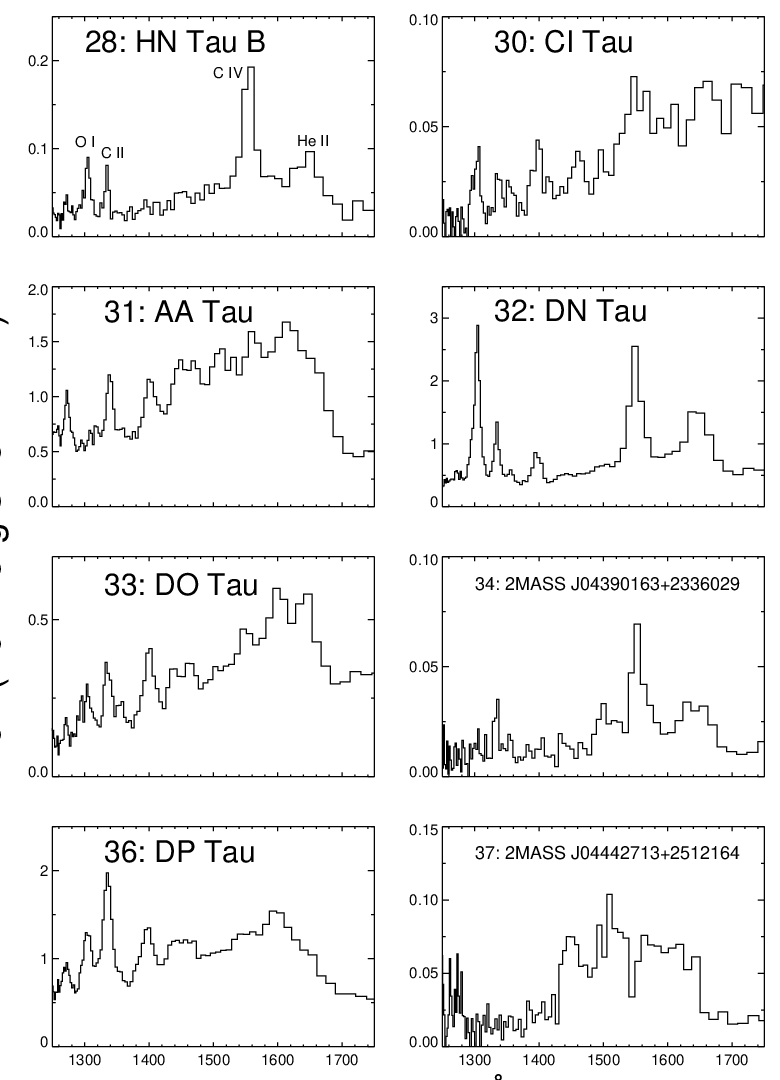
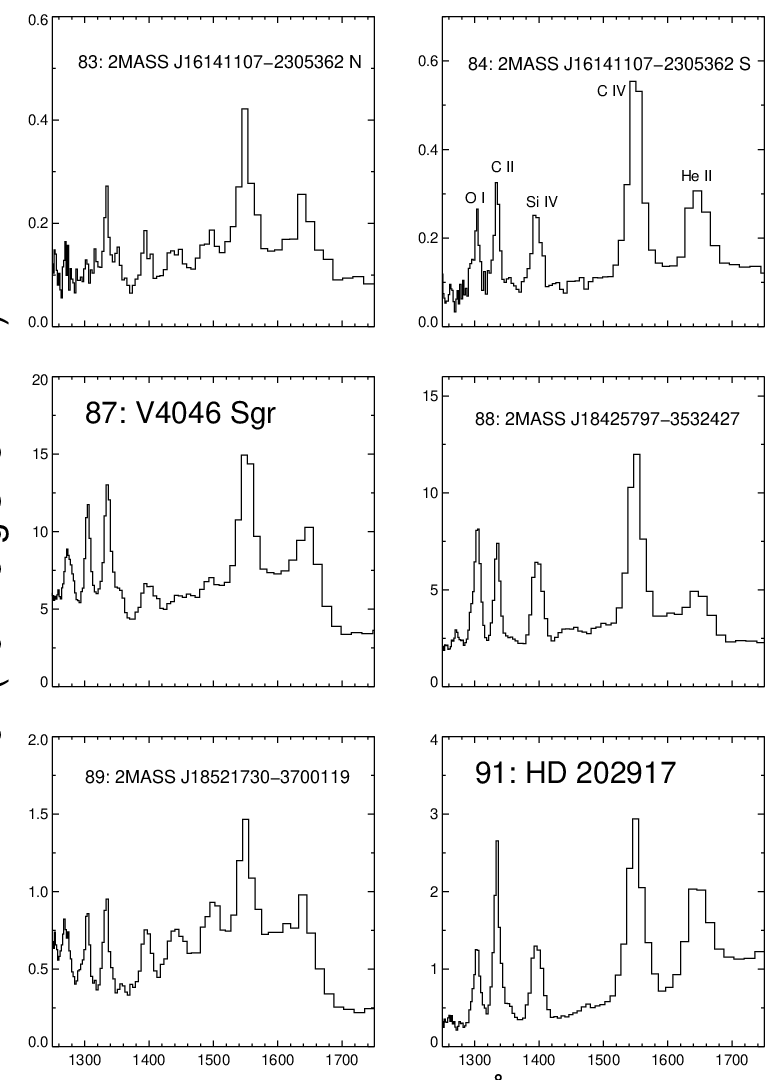
Figure 1 shows the STIS G140L spectra for a few stars in our sample, and plots of the full sample are available in the online version of this paper. Figure 2 compares typical FUV spectra of CTTSs and WTTSs. The pattern of FUV emission from the WTTSs is similar to that of magnetically active dwarf stars, including bright emission in O I , C II , Si IV , C IV , and He II lines and no detectable continuum emission. (The ACS spectra of WTTSs appear to show continuum, but that is due to a combination of low spectral resolution and strong line emission and is not real .) The CTTSs show strong emission in these same lines, though the origin is likely an accretion-heated photosphere or funnel flow [21] rather than chromospheric emission. The CTTSs also show bright H2 emission lines and, in many cases, continuum emission [37].
In the following subsections, we measure flux in emission lines and discuss several exceptional cases where at least some of the FUV emission is spatially extended in outflows rather than on or very near the star.
III.1 Line Flux Measurements
We measured line fluxes by subtracting the continuum estimated with a linear fit with wavelength, and subsequently integrating the emission remaining in the line. The uncertainties in our measurements are dominated by uncertainty in the placement of the continuum, with the error determined by measuring new fluxes after increasing and decreasing the estimated continuum by 20%. This arbitrary change in continuum estimate is an conservative estimate and makes only a minor contribution to the uncertainty in line luminosities, which are usually dominated by uncertainties in the FUV extinction. Statistical errors propagated through the data reduction pipelines are also included. For previously published flux measurements, we adopt the values from Valenti et al. [111], Pagano et al. [92], Ardila et al. [7], and Calvet et al. [22]. Table 4 lists the line flux measurements and associated uncertainties for the stars in our sample.
Accurately measuring line fluxes in the very low-resolution ACS/SBC PR130L spectra is complicated by line-blending and uncertain continuum subtraction. We created artificial ACS spectra by degrading 21 different STIS G140L spectra to the resolution of PR130L. Line fluxes were then measured in both the real and the degraded G140L spectra, and we show the differences between the two sets of measurements in Table 5. The line fluxes have differences of % in most cases but can reach as high as %, especially for the C IV doublet where the ACS/SBC PR130L spectral resolution is lowest.
The FUV emission is typically consistent with a point source centered on the star, with some notable exceptions. Figure 3 compares the spectra of T Tau (ID: 14) obtained with a narrow, on-source extraction from the STIS G140L grating (degraded to the IUE spectral resolution) and with the IUE spectrum, obtained with a large aperture. The IUE spectrum shows much brighter H2 emission than the on-source G140L spectrum. Bright H2 emission is spatially extended in the G140L slit, consistent with emission produced in the outflow (see detailed analysis in Walter et al. [112] and Saucedo et al. [103]). DP Tau (ID: 36) was faintly detected in the F165LP acquisition image. Strong H2 emission is located approximately at the stellar position and is spatially extended by in the cross-dispersion direction (-30∘) and in the dispersion direction. Some faint emission may also be more extended in the spectral image. The ACS SBC acquisition image for 2MASS J04141188+2811535 (ID: 3), an accreting M6.5 brown dwarf, was obtained with the F140LP long-pass filter, which covers a spectral region that includes C IV and H2 lines and the continuum. A second source is located 034 from the primary at a PA of with a brightness three times fainter than the primary.
III.2 Correlation of the Line Luminosities with Stellar Properties
Correlations of line luminosities with stellar properties can be used to infer the physical origin of the emission. Johns-Krull et al. [63] found for a small sample of 12 CTTSs a correlation between mass accretion rate and C IV emission and ascribed the emission to accretion-related processes. In addition, Johns-Krull et al. [63] and Ardila et al. [7] suggested also from small samples that FUV emission from WTTSs is weaker than that from CTTSs. With a sample of 56 stars, Ingleby et al. [61] found that both the C IV and the He II line luminosities correlate well with accretion luminosity, supporting the connection between the line formation and accretion. In this subsection, we look for correlations between FUV line emission and available optical chromospheric activity indicators: Ca II K, H, and H lines.
We convert the FUV line fluxes to line luminosities using the distances listed in Table 2, after correcting the line fluxes for interstellar extinction following the Cardelli et al. [23] extinction law with a total-to-selective extinction coefficient of of . The uncertainty in and the extinction law contribute significant uncertainties to the line luminosities. The extinction law for dense molecular clouds typically has , indicating significant grain growth [115, 59, e.g.]. However, these large values of typically correspond to (also see discussion in Calvet et al. [22]), while most stars in our sample have . Some lines-of-sight may also pass through a disk atmosphere, which would likely have different grains and a different extinction curve than the ISM. Although we choose , selecting other values would be reasonable. A full assessment of different extinction laws would require recalculating and is beyond the scope of this work. The extinction-corrected FUV luminosity between 1250–1700 Å is listed in the last column of Table 4.
Figures 4, 5, and 6 show the C IV 1549 line luminosity against H, H, and Ca II K line luminosities, respectively. For WTTSs, the C IV 1549 luminosities are well correlated with the optical line luminosities. For CTTSs, the C IV 1549 and the optical line luminosities are loosely correlated, which is expected from non-simultaneous observations because the accretion rate varies significantly with time. The best linear-fit parameters and median scatters from the fits are listed in Table 6 where we also list the parameters for linear fits with a fixed slope of one. We find that the X-ray emission is loosely correlated with the C IV emission, as shown in Figure 7. Variability in both the FUV and X-ray emission from CTTSs should introduce a large scatter in any correlation. While the CTTSs show much stronger C IV emission than the WTTSs, mainly due to accretion, the CTTSs and the WTTSs display a similar range of X-ray emission.
Figures 8 and 9 show correlations of C IV 1549 line luminosity and total FUV luminosity with the accretion luminosity for 37 CTTSs, respectively. The C IV emission of CTTSs includes contributions from chromospheric activity and accretion, both of which can be variable. The large scatter in the fits likely results from variability between the C IV and accretion rate measurements obtained at different times, uncertainty in extinction, and perhaps different physical processes contributing to the C IV line flux. Nonetheless, the correlations between C IV and both the accretion and FUV luminosities are definitely real.
Figure 10 shows correlations among various FUV emission line luminosities for both CTTSs and WTTSs. The same linear fit applies to both CTTSs and WTTSs, which demonstrates that FUV line flux ratios do not depend on whether the emission is produced by chromospheric activity or by accretion. The line fluxes depend on the emission measure versus temperature. The same linear fit to the CTTSs and WTTSs in each panel indicate that the shape of the emission measure distribution must be similar for both chromospheric activity and accretion.
III.3 Molecular Hydrogen Emission from CTTSs
Warm H2 gas ( K) can be excited to the B and C electronic states by strong Ly and other UV emission lines and subsequently decays to the ground (X) electronic state. This H2 fluorescence is commonly detected from CTTSs, likely originating at the surfaces of the circumstellar disks and from outflows shocking the surrounding molecular environment [112, 103, 54, e.g.,]. The spectral window between 1430 Å and 1510 Å is particularly useful because it includes many strong H2 lines but few stellar emission lines. Limited by the low spectral resolution in ACS data, we could only identify the H2 features in the – Å wavelength region for the stars in our sample, and noted “Yes” or “No” in the second-to-last column of Table 4 to indicate whether or not the spectrum shows H2 emission. A more quantitative assessment and analysis of H2 emission from ACS/SBC spectra was provided by Ingleby et al. [60].
Our results agree with Ingleby et al. [60] who find that CTTSs generally display H2 emission in the the – Å region while WTTSs do not. Of the 31 stars in our sample previously classified as WTTS, only one (HD 98800 N, ID: 63) shows the H2 emission feature (see §4.2). For the near-equal mass binary system 2MASS J16141107-2305362 [81], the S component (ID: 83) produces stronger FUV emission lines but lacks detectable H2 emission, characteristic of WTTSs. The N component (ID: 84), produces strong Ly-pumped H2 lines and excess FUV continuum emission, as expected for a CTTS. The system may therefore be a CTTS/WTTS binary.
IV DISCUSSION
IV.1 Prescriptions for Calculating FUV luminosities
FUV emission affects the disk by photoevaporation and by driving a complex chemistry at the disk surface, including photodissocation of some molecules and ionization of atomic species with low first ionization potential energies. The FUV radiation field is needed as an input for disk modeling to help interpret emission line tracers of gas in the disk.
In this subsection, we offer prescriptions for estimating accretion and chromospheric emission produced in the FUV from optical emission lines. Figures 10 and 11 show that the luminosities of C IV 1549, O I 1304, C II 1335, Si IV 1394/1403 lines, and He II 1640 lines and of the FUV (1250–1700 Å bandpass) are all strongly correlated with each other. As a consequence, a measurement of only one of these parameters is needed to estimate the total FUV flux. Figures 4, 5, and 6 show that the C IV and, by implication, the FUV luminosities correlate with H, H, and Ca II K line emission for both CTTSs and WTTSs. Emission in H, H, and Ca II K lines can therefore be used to obtain rough estimates for the FUV emission using equations and parameters listed in Table 6.
Two exemplary cases, TW Hya (CTTS) and AU Mic, are selected for this analysis, because they have complete, high S/N spectra from the Lyman limit to 1700 Å (see Table 7) and the photospheric emission is negligible in this bandpass for both stars. The spectra from 912–1200 Å were observed by FUSE for these two stars but not for most of the stars presented in this atlas. However, because the correlation between FUV lines is very tight (Figure 10), we infer that these two template spectra can be scaled to the strength of C IV (or optical line) flux for each object.
For example, when a measurement of accretion luminosity is available, the equation can be used to obtain an estimate of the total FUV luminosity. Similarly, the equations and provide estimates of total FUV luminosity from Hα and Hβ measurements of CTTSs, respectively. In Table 6, we give the relationships of optical diagnositics, , and other FUV lines, with respect to C IV emission or .
This prescription outlined above provides estimates of the FUV luminosity, with an accuracy of dex. The luminosities refer only to chromospheric and accretion-related processes and do not include photospheric emission. For stars with spectral types G and earlier, the photospheric emission provides a significant fraction of the total FUV luminosity and needs to be included in such calculations. Since the FUV spectra of late-type stars are dominated by line emission, calculating excitation rates in discrete electronic transitions of various molecules, including H2 and CO, may require use of real spectral templates rather than assumptions about a smooth distribution of flux with wavelength.
This discussion of FUV radiation fields neglects the Ly 1216 line. The Ly line is presumed to be strong, as much as 75-90% of the total FUV luminosity from CTTSs (see Table 7), based on direct detections from a few objects [56, 121, 37] and indirect detections from strong H2 lines [54, 60, e.g.]. The total stellar Ly flux is not directly observable because neutral hydrogen in the ISM and circumstellar environment scatters Ly photons out of our line of sight to the star. The Ly line is also not covered by the ACS/SBC PR130L prism. For WTTSs, correlations with provided by Wood et al. [120] could be used to infer Ly luminosities. For both CTTSs and WTTSs, reconstruction of the stellar Ly line is needed to properly estimate the Ly flux seen by the circumstellar gas.
IV.2 Evolution of FUV Emission for PMS Stars
Figures 12 and 13 show the FUV luminosity, , and its ratio to the bolometric luminosity, , versus spectral type, respectively. For stars with spectral type later than K0, where the extinction estimates are more accurate, the FUV luminosity, , of CTTSs is , with a scatter of dex, and the FUV luminosity of WTTSs is with a scatter of dex. The higher FUV luminosities of CTTSs are due to accretion and related processes. Many of the WTTSs in our sample are thought to be older than their CTTS counterparts and have smaller bolometric luminosities and, consequently, even lower absolute FUV luminosities. The WTTSs in Taurus generally show stronger FUV emission than the WTTSs of similar spectral types in TWA and other regions. Our sample is biased in age and mass. Many of the K stars are from the Myr old [93] Taurus Molecular Cloud, and all M dwarfs are located in the 10 Myr [10] TWA, while G stars are typically older field dwarfs.
Ingleby et al. [61] showed for their sample that the FUV luminosity between 1230 and 1800 Å correlates well with and both quantities decrease with age from 1 Myr to 1 Gyr. As shown in Figure 9, despite the scatter, we also find that the FUV emission of CTTSs clearly scales with the accretion rate. The highest accretion rates likely occur in outbursts during the Class 0 and I stages [30], when the accretion and any FUV emission are mostly or entirely obscured from our view by dense envelopes. During these stages, the mean accretion rate is likely higher than measured for CTTSs, with a correspondingly higher FUV luminosity. The CTTS stage includes stars with accretion rates of that range over 2 orders of magnitude at a given mass, with some suggestion that older CTTSs have lower accretion rates. As the accretion rate decreases, so does the FUV luminosity. The chromospheric emission provides the lower limit on the strength of FUV emission from young stars.
IV.3 Importance of Far-UV Spectra for Photoevaporation and Photochemistry of Close-in Exoplanet Atmospheres
The discovery and characterization of Jupiter mass exoplanets close to their host stars by ground-based telescopes and the CoRoT and Kepler missions raises many questions concerning the photochemistry of their atmospheres and mass loss due to hydrodynamic and magnetohydrodynamic processes. For example, the well studied exoplanet HD 209458b, which has a semimajor axis of 0.045 AU and a 3.52 day orbital period about its G0 V host star [67], receives a radiative flux 13,400 times that of Jupiter. Like many other hot Jupiters, HD 209458b is inflated with a radius 1.25 times that of Jupiter, which could be due in part to external heating. While the visual and near-UV (NUV) stellar flux dominates the external heating of the lower atmospheres of hot Jupiters, the stellar FUV, EUV, and X-ray fluxes will control ionization and dissociation processes in the outer atmosphere and drive mass loss through heating of the exosphere.
Models of hydromagnetic mass loss from hot Jupiters [122, 107, 41, 85] assume that the mass loss is driven by absorption by H2 and H I in the upper atmopshere. The inclusion of photoabsorption of UV photons by C, N, and O can greatly increase the mass loss rate [41]. The FUV emission can also affect atmospheric chemistry by photodissociation of many molecules, including H2, H2O, and CH4. Biologically-important O2 is dissociated by Å radiation leading to the formation of O3.
Realistic assessments of the FUV flux must be included in theoretical models to explain the large mass flux for HD 209458b [72] and to accurately describe the photochemistry in the atmospheres of young or forming planets. During the active accretion phase, a Jovian-mass planet will migrate inward to where the disk is truncated. In this phase, the optically thick disk may shield the planet from direct irradiation from the central star. Once the disk dissipates, the planets see bright emission from the central star. Ribas et al. [100] have collected the available UV and X-ray fluxes (between 1 and 1200 Å) as a function of age for solar-mass stars older than 50 Myr and provided scaling laws for the age dependence of the flux in different bands. They found that the emission in all wavelength intervals decreases by a few orders of magnitude following power laws from 0.1 to 7 Gyr, and higher energy emissions display steeper decreases. Ingleby et al. [61] extended this study to younger stars and found that the Ribas et al. [100] power laws are valid for stars between 15 and 100 Myr for X-ray and FUV (1230–1800 Å bandpass) luminosities. The FUV emission of WTTSs in our sample have similar strengths as that reported in Ingleby et al. [61] and thus a few orders of magnitude stronger than the much older solar analogs in Ribas et al. [100].
The above analysis excludes Ly emission, which dominates the total FUV emission from both WTTSs and CTTSs [119, 56]. For CTTSs, this emission can be scattered deeper into the disk than other FUV photons [15, Herczeg 2006]. However, most planets are located beyond the dust sublimation radius and will be shielded from any optically-thick radiation from the disk. Once the disk dissipates, any hot Jupiter will see the total FUV emission from the star, including Ly. The incident radiation field for WTTSs should include both the 1250–1700 Å emission discussed here and the Ly radiation, which can be estimated from the stellar X-ray luminosity [120].
IV.4 HD 98800 N: a debris disk or an accretion disk?
HD 98800 (K5) is a quadruple system that consists of two spectroscopic binaries separated by [16]. An IR excess from the N component indicates the presence of a dust disk [42, 68, 97]. Both the IR spectral energy distribution and high-resolution sub-mm images indicate a hole in the dust distribution in the disk, with an inner truncation radius of 3.5–6 AU from the central binary [38, 2, 6]. A low-resolution 3300–5500 Å spectrum (Figure 14) that includes both components shows no evidence for accretion, with (or ), following Herczeg & Hillenbrand [52]. Salyk et al. [101] did not detect any CO rovibrational emission in a high-resolution M-band ( 5 m) spectrum of HD 98800 N (ID: 63). Prior to this work, the absence of any gas or accretion signatures suggested that the disk should have been classified as a debris disk rather than a transition (or cold) disk with ongoing accretion.
The emission at 1420 and 1500 Å from HD 98800 N is Ly-pumped H2 emission (Figure 15). The general rise shortward of 1700 Å is likely explained, at least in part, by a combination of Ly-pumped H2 emission and H2 emission following a collision with energetic electrons [53, 13, 36]. Ingleby et al. [60] detected this H2 emission in the FUV spectrum of every classical T Tauri star but not for any star with a debris disk. FUV H2 line emission has been previously detected around one debris disk, AU Mic [35]. However, that emission produced in cold H2 gas is faint, and could not explain the H2 emission seen in the PR130L spectrum.
Our detection of bright FUV H2 emission from HD 98800 N demonstrates that warm gas persists in its disk. This detection suggests that HD98800 N has ongoing accretion with a rate below previous detection limits. Ingleby et al. (2011) describes a similar case, RECX 11, which lacks any detectable excess U-band emission but has accretion detectable in several diagnostics, including the FUV.
IV.5 Evidence for Depletion of Refractory Elements in Accretion Flows
Figure 16 compares the Ca II K and C IV line luminosities for WTTSs, CTTSs, and more evolved CTTSs. As defined here, these more evolved CTTSs include members of the TW Hya and Upper Sco Associations, the cold (or transitional) disks GM Aur, DM Tau, and LkCa 15, the settled disk V836 Tau, and SCH J0518, which is located off of the main Taurus fields in a region with a low disk fraction.
For WTTSs, the Ca II and C IV lines are both produced by chromospheric emission, while for CTTSs, these lines are produced by a combination of chromospheric emission and accretion-related processes. The correlation between Ca II and C IV line luminosities observed at different times is very tight for WTTSs, indicating that variability is moderate. Generally, extinctions for WTTSs are lower and less uncertain than for CTTSs, and that may contribute to the tighter relationship between Ca II and C IV line emission. Larger scatter is expected and observed for CTTSs because accretion can be highly variable and the extinctions are more uncertain.
The more evolved CTTSs almost all have low Ca II/C IV luminosity ratios relative to most other CTTSs in our sample. The exception is TWA 3N (ID: 59), which is only weakly accreting [51] at a low enough rate that emission in both lines could be dominated by the chromosphere. The low Ca II/C IV line ratios could be explained by the preferential depletion of refractive metals into grains that have settled into a dead zone below the surface layers in the disk and do not take part in accretion [39]. For the 10 Myr old CTTSs, TW Hya and 2M1207 (TWA 27), the weakness in FUV Si lines and, for 2M1207, Mg II h & k lines, relative to C lines has been interpreted as possible evidence for Si depletion into dust grains in the disk [53, 34]. This interpretation has some support from high-resolution X-ray spectroscopy of more evolved CTTSs that show anomalously high Ne/Fe and Ne/O abundance ratios, with line ratios suggesting an origin in the accretion flow [65, 104, 47]. Similarly, certain metals can be depleted in outflows [90, 40, e.g.], which may indicate that the gas in the wind launch region is similarly depleted in refractory elements.
The low Ca II/C IV ratios for the cold disks in Taurus support the idea that refractive metals are also depleted in the accretion flow in these disks. The disks have undergone some evolution relative to the typical disks seen in Taurus. The depletion of Ca may suggest that refractive metals have settled into large grains or planetessimals. This analysis is restricted to Ca because the Si lines are difficult to separate from H2 emission in the low-resolution ACS PR130L spectra.
IV.6 Spatially Extended Jets in the FUV
H2 emission from young stars can be spatially extended and related to outflows, as is seen prominently around T Tau [112, 103, see discussion in § 3.1; ]. The stellar emission strengths of the Si IV and C IV lines are similar in both observations, but the larger IUE aperture detects much stronger H2 emission, as expected for spatially extended emission (see Figure 3).
In most spectra presented here, the H2 emission is centered on-source, with no significant contribution from spatially extended outflows. The lack of spatially extended emission does not necessarily indicate that the H2 emission traces the disk. High angular-resolution spectra of RU Lup, T Tau, DG Tau, and DF Tau show that the on-source emission includes at least some emission from an outflow [54]. Off-source H2 emission is detected from two other sources, DP Tau and 2MASS J04141188+2811535. An asymmetric bipolar jet (HH 231) is associated with DP Tau [84], so results from the DP Tau spectrum are not included in any of the correlations presented in §3.2. Near-IR AO images of 2MASS J04141188+2811535 indicate that the object lacks a near-IR companion of similar brightness (Adam Kraus, private communication). The secondary component is likely an H2 jet, which is also consistent with the presence of a weak emission between the primary and secondary positions and with the presence of bright optical forbidden lines [52].
V SUMMARY
In this paper, we present a FUV spectral atlas of 91 CTTSs and WTTSs, as observed by the GHRS, STIS, and ACS instruments on HST, including some observations by IUE and FUSE. We find that FUV line luminosities are well correlated with each other over a large range of luminosity. The same correlation applies to both CTTSs and WTTSs, which indicates that the emission measure has a similar distribution versus temperature for chromospheric activity and for accretion. Accretion significantly increases the strength of these lines and the total FUV luminosity, with for CTTSs and for WTTSs. For stars with evolved but accreting disks, including transition disks, the Ca II H & K lines are weaker than expected, which supports the suggestion that refractory elements may be depleted in accretion flows onto these stars. We provide easy-to-use prescriptions to obtain FUV luminosities from either optical line luminosities or from a known accretion rate. We also discuss several individual spectra, including the detection of warm H2 emission from HD 98800 N, which suggests ongoing accretion for a disk that had been previously classified as a debris disk.
Appendix A Tight Binaries in the UV
A.1 EZ Ori
The STIS acquisition image of EZ Ori reveals two components. The image was obtained with the STIS CCD pixels) and the F28x500 [O III] filter, which is centered at 5007 Å and covers Å. The secondary is separated by from the primary with a PA and a flux in the bandpass equal to % of the primary. The FUV and NUV spectra were obtained with a large slit that includes both stars. The extracted FUV and NUV spectra are consistent with the presence of a binary at that position, with the wavelength solution of the secondary shifted by four pixels because it was not centered in the wide () slit. About 20% of the flux in FUV emission lines is from EZ Ori B, although C II emission is relatively weak. Also, 15% of NUV emission and 10% of the Mg II 2800 Å doublet is from EZ Ori B. Both components are likely accreting based on the strength of these lines and the NUV continuum. For purposes of this paper the two sources are treated as a single star.
A.2 TWA 16
The acquisition image of TWA 16 was obtained with the F150LP long-pass filter. TWA 16 is resolved into two stars separated by at a PA=316∘ and with a brightness difference of 0.095 mag.
A.3 UZ Tau E
UZ Tau was acquired with the F165LP long-pass filter, which covers spectral regions dominated by the continuum emission. In this image, the northern component is stronger. The two components of UZ Tau E have a flux ratio of and are separated by 032 mas at a PA=7.9. The two components of UZ Tau E are aligned close to the dispersion direction and are not resolved in the prism spectrum. H measurements from Hartigan & Kenyon [49] indicate that both components of UZ Tau E are accreting.
A.4 2M1614
Metchev & Hillenbrand [81] found 2MASS J16141107-2305362 (2M1614, or PZ 161411-230536) to be a nearly equal-mass binary separated by with a PA=304.8∘. We confirm the presence of two components, but find a separation of with a PA=296.7∘. The difference could be due to orbital motion. Accretion has been detected in unresolved optical spectra that includes both objects [94]. The presence of strong H2 emission from the N component and the lack of detectable H2 emission from the S component suggests that the system is a CTTS+WTTS binary.
Appendix B Uncertainties In Data From Different Instruments
We have presented PMS star spectra obtained from four instruments on HST with different spectral resolutions, sensitivities, and measurements uncertainties. Figure 17 compares the C IV 1549 Å doublet fluxes and percent errors of PMS stars measured by the four HST instruments and the IUE SWP-LO mode. The errors include both statistical errors in the spectra and flux measurement errors. The faintest PMS stars were observed by the instruments with the lowest spectral resolution (ACS and STIS G140L). For ACS the percent errors increased from typically 10% at high flux levels to % at its flux limit of ergs cm-2 s-1. Note, however, the large scatter in the errors relative to the least squares linear trend line. For STIS G140L observations the errors are roughly 5% at high flux levels increasing to % at the lowest flux levels, and the scatter about the linear trend line is relatively small. The moderate-resolution STIS E140M grating has provided fluxes with 5% or smaller errors for high flux level sources increasing to 20% for the lowest flux source at ergs cm-2 s-1. As the curved trend line shows, C IV spectra obtained with the IUE’s SWP-LO camera typically show 5% flux errors for sources with high flux levels ( ergs cm-2 s-1) but provide no useful data at flux levels a factor of 3 lower. Table 3 includes a rough estimate of the C IV flux levels for each instrument, below which measurement errors are generally greater than 10%.
References
- [1] Aikawa, Y., van Zadelhoff, G. J., van Dishoeck, E. F., & Herbst, E. 2002, A&A, 386, 622
- [2] Akeson, R. L., Rice, W. K. M., Boden, A. F., Sargent, A. I., Carpenter, J. M., & Bryden, G. 2007, ApJ, 670, 1240
- [3] Alexander, R. D., Clarke, C. J., & Pringle, J. E. 2005, MNRAS, 358, 283
- [4] —. 2006, MNRAS, 369, 216
- [5] Andrews, S. M., & Williams, J. P. 2005, ApJ, 631, 1134
- [6] Andrews, S. M., Wilner, D. J., Hughes, A. M., Qi, C., & Dullemond, C. P. 2009, ApJ, 700, 1502
- [7] Ardila, D. R., Basri, G., Walter, F. M., Valenti, J. A., & Johns-Krull, C. M. 2002, ApJ, 566, 1100
- [8] Ayres, T. R. 2005, in ESA Special Publication, Vol. 560, 13th Cambridge Workshop on Cool Stars, Stellar Systems and the Sun, ed. F. Favata, G. A. J. Hussain, & B. Battrick, 419
- [9] Barentsen, G., Vink, J. S., Drew, J. E., Greimel, R., Wright, N. J., Drake, J. J., Martin, E. L., Valdivielso, L., & Corradi, R. L. M. 2011, MNRAS, 415, 103
- [10] Barrado Y Navascués, D. 2006, A&A, 459, 511
- [11] Basri, G., & Batalha, C. 1990, ApJ, 363, 654
- [12] Bergin, E., Calvet, N., D’Alessio, P., & Herczeg, G. J. 2003, ApJ, 591, L159
- [13] Bergin, E., Calvet, N., Sitko, M. L., Abgrall, H., D’Alessio, P., Herczeg, G. J., Roueff, E., Qi, C., Lynch, D. K., et al. 2004, ApJ, 614, L133
- [14] Bertout, C., Robichon, N., & Arenou, F. 1999, A&A, 352, 574
- [15] Bethell, T., & Bergin, E. 2009, Science, 326, 1675
- [16] Boden, A. F., Sargent, A. I., Akeson, R. L., Carpenter, J. M., Torres, G., Latham, D. W., Soderblom, D. R., Nelan, E., Franz, O. G., & Wasserman, L. H. 2005, ApJ, 635, 442
- [17] Bouvier, J. 1990, AJ, 99, 946
- [18] Brown, A., Herczeg, G. J., Brown, J. M., Walter, F. M., Valenti, J., Ardila, D., Hillenbrand, L. A., Edwards, S., Johns-Krull, C. M., Alexander, R., Bergin, E. A., Calvet, N., Bethell, T. J., Ingleby, L., Bary, J. S., Audard, M., Baldovin, C., Roueff, E., Abgrall, H., Gregory, S. G., Ayres, T. R., & Linsky, J. L. 2010, in Bulletin of the American Astronomical Society, Vol. 42, AAS/High Energy Astrophysics Division #11, 684–+
- [19] Brown, A., Jordan, C., Millar, T. J., Gondhalekar, P., & Wilson, R. 1981, Nature, 290, 34
- [20] Browning, M. K., Basri, G., Marcy, G. W., West, A. A., & Zhang, J. 2010, AJ, 139, 504
- [21] Calvet, N., & Gullbring, E. 1998, ApJ, 509, 802
- [22] Calvet, N., Muzerolle, J., Briceño, C., Hernández, J., Hartmann, L., Saucedo, J. L., & Gordon, K. D. 2004, AJ, 128, 1294
- [23] Cardelli, J. A., Clayton, G. C., & Mathis, J. S. 1989, ApJ, 345, 245
- [24] Cohen, M., & Kuhi, L. V. 1979, ApJS, 41, 743
- [25] Comerón, F., Spezzi, L., & López Martí, B. 2009, A&A, 500, 1045
- [26] de Zeeuw, P. T., Hoogerwerf, R., de Bruijne, J. H. J., Brown, A. G. A., & Blaauw, A. 1999, AJ, 117, 354
- [27] Dolan, C. J., & Mathieu, R. D. 2001, AJ, 121, 2124
- [28] Donati, J.-F., Jardine, M. M., Gregory, S. G., Petit, P., Bouvier, J., Dougados, C., Ménard, F., Collier Cameron, A., Harries, T. J., et al. 2007, MNRAS, 380, 1297
- [29] Ducourant, C., Teixeira, R., Hambly, N. C., Oppenheimer, B. R., Hawkins, M. R. S., Rapaport, M., Modolo, J., & Lecampion, J. F. 2007, A&A, 470, 387
- [30] Dunham, M. M., Evans, N. J., Terebey, S., Dullemond, C. P., & Young, C. H. 2010, ApJ, 710, 470
- [31] Enoch, M. L., Young, K. E., Glenn, J., Evans, II, N. J., Golwala, S., Sargent, A. I., Harvey, P., Aguirre, J., Goldin, A., et al. 2006, ApJ, 638, 293
- [32] Fedele, D., van den Ancker, M. E., Henning, T., Jayawardhana, R., & Oliveira, J. M. 2010, A&A, 510, 72
- [33] Feigelson, E. D., Getman, K., Townsley, L., Garmire, G., Preibisch, T., Grosso, N., Montmerle, T., Muench, A., & McCaughrean, M. 2005, ApJS, 160, 379
- [34] France, K., Linsky, J. L., Brown, A., Froning, C. S., & Béland, S. 2010a, ApJ, 715, 596
- [35] France, K., Roberge, A., Lupu, R. E., Redfield, S., & Feldman, P. D. 2007, ApJ, 668, 1174
- [36] France, K., Stocke, J. T., Yang, H., Linsky, J. L., Wolven, B. C., Froning, C. S., Green, J. C., & Osterman, S. N. 2010b, ApJ, 712, 1277
- [37] France, K., Yang, H., & Linsky, J. L. 2011, ApJ, 729, 7
- [38] Furlan, E., Sargent, B., Calvet, N., Forrest, W. J., D’Alessio, P., Hartmann, L., Watson, D. M., Green, J. D., Najita, J., & Chen, C. H. 2007, ApJ, 664, 1176
- [39] Gammie, C. F. 1996, ApJ, 457, 355
- [40] Garcia Lopez, R., Nisini, B., Eislöffel, J., Giannini, T., Bacciotti, F., & Podio, L. 2010, A&A, 511, A5+
- [41] García Muñoz, A. 2007, Planet. Space Sci., 55, 1426
- [42] Gehrz, R. D., Smith, N., Low, F. J., Krautter, J., Nollenberg, J. G., & Jones, T. J. 1999, ApJ, 512, L55
- [43] Gorti, U., & Hollenbach, D. 2009, ApJ, 690, 1539
- [44] Güdel, M., Briggs, K. R., Arzner, K., Audard, M., Bouvier, J., Feigelson, E. D., Franciosini, E., Glauser, A., Grosso, N., et al. 2007, A&A, 468, 353
- [45] Gullbring, E., Calvet, N., Muzerolle, J., & Hartmann, L. 2000, ApJ, 544, 927
- [46] Gullbring, E., Hartmann, L., Briceno, C., & Calvet, N. 1998, ApJ, 492, 323
- [47] Günther, H. M., Schmitt, J. H. M. M., Robrade, J., & Liefke, C. 2007, A&A, 466, 1111
- [48] Haisch, Jr., K. E., Lada, E. A., & Lada, C. J. 2001, ApJ, 553, L153
- [49] Hartigan, P., & Kenyon, S. J. 2003, ApJ, 583, 334
- [50] Herbig, G. H., & Bell, K. R. 1988, Third Catalog of Emission-Line Stars of the Orion Population : 3 : 1988 (Santa Cruz, CA: Lick Observatory)
- [51] Herczeg, G. J., Cruz, K. L., & Hillenbrand, L. A. 2009, ApJ, 696, 1589
- [52] Herczeg, G. J., & Hillenbrand, L. A. 2008, ApJ, 681, 594
- [53] Herczeg, G. J., Linsky, J. L., Valenti, J. A., Johns-Krull, C. M., & Wood, B. E. 2002, ApJ, 572, 310
- [54] Herczeg, G. J., Linsky, J. L., Walter, F. M., Gahm, G. F., & Johns-Krull, C. M. 2006, ApJS, 165, 256
- [55] Herczeg, G. J., Walter, F. M., Linsky, J. L., Gahm, G. F., Ardila, D. R., Brown, A., Johns-Krull, C. M., Simon, M., & Valenti, J. A. 2005, AJ, 129, 2777
- [56] Herczeg, G. J., Wood, B. E., Linsky, J. L., Valenti, J. A., & Johns-Krull, C. M. 2004, ApJ, 607, 369
- [57] Hernández, J., Hartmann, L., Calvet, N., Jeffries, R. D., Gutermuth, R., Muzerolle, J., & Stauffer, J. 2008, ApJ, 686, 1195
- [58] Hughes, J., Hartigan, P., Krautter, J., & Kelemen, J. 1994, AJ, 108, 1071
- [59] Indebetouw, R., Mathis, J. S., Babler, B. L., Meade, M. R., Watson, C., Whitney, B. A., Wolff, M. J., Wolfire, M. G., Cohen, M., et al. 2005, ApJ, 619, 931
- [60] Ingleby, L., Calvet, N., Bergin, E., Yerasi, A., Espaillat, C., Herczeg, G., Roueff, E., Abgrall, H., Hernández, J., et al. 2009, ApJ, 703, L137
- [61] Ingleby, L., Calvet, N., Hernández, J., Briceño, C., Espaillat, C., Miller, J., Bergin, E., & Hartmann, L. 2011, AJ, 141, 127
- [62] Johns-Krull, C. M., & Herczeg, G. J. 2007, ApJ, 655, 345
- [63] Johns-Krull, C. M., Valenti, J. A., & Linsky, J. L. 2000, ApJ, 539, 815
- [64] Kamp, I. 2011, ArXiv e-prints
- [65] Kastner, J. H., Huenemoerder, D. P., Schulz, N. S., Canizares, C. R., & Weintraub, D. A. 2002, ApJ, 567, 434
- [66] Kenyon, S. J., & Hartmann, L. 1995, ApJS, 101, 117
- [67] Knutson, H. A., Charbonneau, D., Noyes, R. W., Brown, T. M., & Gilliland, R. L. 2007, ApJ, 655, 564
- [68] Koerner, D. W., Jensen, E. L. N., Cruz, K. L., Guild, T. B., & Gultekin, K. 2000, ApJ, 533, L37
- [69] Lamzin, S. A., Kravtsova, A. S., Romanova, M. M., & Batalha, C. 2004, Astronomy Letters, 30, 413
- [70] Larsen, S. S. 2006, Instrument Science Report ACS-2006-02 (Baltimore, MD: Space Telescope Science Institute), 9
- [71] Lecavelier des Etangs, A., Deleuil, M., Vidal-Madjar, A., Roberge, A., Le Petit, F., Hébrard, G., Ferlet, R., Feldman, P. D., Désert, J., & Bouret, J. 2003, A&A, 407, 935
- [72] Linsky, J. L., Yang, H., France, K., Froning, C. S., Green, J. C., Stocke, J. T., & Osterman, S. N. 2010, ApJ, 717, 1291
- [73] Loinard, L., Torres, R. M., Mioduszewski, A. J., & Rodríguez, L. F. 2008, ApJ, 675, L29
- [74] Loinard, L., Torres, R. M., Mioduszewski, A. J., Rodríguez, L. F., González-Lópezlira, R. A., Lachaume, R., Vázquez, V., & González, E. 2007, ApJ, 671, 546
- [75] Lombardi, M., Lada, C. J., & Alves, J. 2008, A&A, 480, 785
- [76] Luhman, K. L., Allen, L. E., Allen, P. R., Gutermuth, R. A., Hartmann, L., Mamajek, E. E., Megeath, S. T., Myers, P. C., & Fazio, G. G. 2008, ApJ, 675, 1375
- [77] Luhman, K. L., Allen, P. R., Espaillat, C., Hartmann, L., & Calvet, N. 2010, ApJS, 186, 111
- [78] Luhman, K. L., Stauffer, J. R., Muench, A. A., Rieke, G. H., Lada, E. A., Bouvier, J., & Lada, C. J. 2003, ApJ, 593, 1093
- [79] Mamajek, E. E. 2005, ApJ, 634, 1385
- [80] Mamajek, E. E., Meyer, M. R., & Liebert, J. 2002, AJ, 124, 1670
- [81] Metchev, S. A., & Hillenbrand, L. A. 2009, ApJS, 181, 62
- [82] Mohanty, S., Jayawardhana, R., & Basri, G. 2005, ApJ, 626, 498
- [83] Moos, H. W., Cash, W. C., Cowie, L. L., Davidsen, A. F., Dupree, A. K., Feldman, P. D., Friedman, S. D., Green, J. C., Green, R. F., et al. 2000, ApJ, 538, L1
- [84] Mundt, R., & Eislöffel, J. 1998, AJ, 116, 860
- [85] Murray-Clay, R. A., Chiang, E. I., & Murray, N. 2009, ApJ, 693, 23
- [86] Muzerolle, J., Hillenbrand, L., Calvet, N., Briceño, C., & Hartmann, L. 2003, ApJ, 592, 266
- [87] Muzerolle, J., Luhman, K. L., Briceño, C., Hartmann, L., & Calvet, N. 2005, ApJ, 625, 906
- [88] Neuhäuser, R., & Forbrich, J. 2008, The Corona Australis Star Forming Region, ed. Reipurth, B., 735–+
- [89] Nguyen, D. C., Jayawardhana, R., van Kerkwijk, M. H., Brandeker, A., Scholz, A., & Damjanov, I. 2009, ApJ, 695, 1648
- [90] Nisini, B., Bacciotti, F., Giannini, T., Massi, F., Eislöffel, J., Podio, L., & Ray, T. P. 2005, A&A, 441, 159
- [91] Oke, J. B., & Gunn, J. E. 1982, PASP, 94, 586
- [92] Pagano, I., Linsky, J. L., Carkner, L., Robinson, R. D., Woodgate, B., & Timothy, G. 2000, ApJ, 532, 497
- [93] Palla, F., & Stahler, S. W. 2000, ApJ, 540, 255
- [94] Pascucci, I., Hollenbach, D., Najita, J., Muzerolle, J., Gorti, U., Herczeg, G. J., Hillenbrand, L. A., Kim, J. S., Carpenter, J. M., et al. 2007, ApJ, 663, 383
- [95] Perez-Becker, D., & Chiang, E. 2011, ApJ, 727, 2
- [96] Perryman, M. A. C., Lindegren, L., Kovalevsky, J., Hoeg, E., Bastian, U., Bernacca, P. L., Crézé, M., Donati, F., Grenon, M., et al. 1997, A&A, 323, L49
- [97] Prato, L., Ghez, A. M., Piña, R. K., Telesco, C. M., Fisher, R. S., Wizinowich, P., Lai, O., Acton, D. S., & Stomski, P. 2001, ApJ, 549, 590
- [98] Preibisch, T., & Zinnecker, H. 1999, AJ, 117, 2381
- [99] Redfield, S., Ayres, T. R., Linsky, J. L., Ake, T. B., Dupree, A. K., Robinson, R. D., & Young, P. R. 2003, ApJ, 585, 993
- [100] Ribas, I., Guinan, E. F., Güdel, M., & Audard, M. 2005, ApJ, 622, 680
- [101] Salyk, C., Blake, G. A., Boogert, A. C. A., & Brown, J. M. 2009, ApJ, 699, 330
- [102] Santos, N. C., Israelian, G., Mayor, M., Bento, J. P., Almeida, P. C., Sousa, S. G., & Ecuvillon, A. 2005, A&A, 437, 1127
- [103] Saucedo, J., Calvet, N., Hartmann, L., & Raymond, J. 2003, ApJ, 591, 275
- [104] Stelzer, B., & Schmitt, J. H. M. M. 2004, A&A, 418, 687
- [105] Sterzik, M. F., Alcalá, J. M., Covino, E., & Petr, M. G. 1999, A&A, 346, L41
- [106] Swade, D. A., Hopkins, E., & Swam, M. S. 2001, in Astronomical Society of the Pacific Conference Series, Vol. 238, Astronomical Data Analysis Software and Systems X, ed. F. R. Harnden, Jr., F. A. Primini, & H. E. Payne, 295
- [107] Tian, F., Toon, O. B., Pavlov, A. A., & De Sterck, H. 2005, ApJ, 621, 1049
- [108] Valenti, J. A., Basri, G., & Johns, C. M. 1993, AJ, 106, 2024
- [109] Valenti, J. A., Fallon, A. A., & Johns-Krull, C. M. 2003, ApJS, 147, 305
- [110] Valenti, J. A., & Fischer, D. A. 2005, ApJS, 159, 141
- [111] Valenti, J. A., Johns-Krull, C. M., & Linsky, J. L. 2000, ApJS, 129, 399
- [112] Walter, F. M., Herczeg, G., Brown, A., Ardila, D. R., Gahm, G. F., Johns-Krull, C. M., Lissauer, J. J., Simon, M., & Valenti, J. A. 2003, AJ, 126, 3076
- [113] Walter, F. M., Vrba, F. J., Mathieu, R. D., Brown, A., & Myers, P. C. 1994, AJ, 107, 692
- [114] Webb, R. A., Zuckerman, B., Platais, I., Patience, J., White, R. J., Schwartz, M. J., & McCarthy, C. 1999, ApJ, 512, L63
- [115] Weingartner, J. C., & Draine, B. T. 2001, ApJ, 548, 296
- [116] White, R. J., Gabor, J. M., & Hillenbrand, L. A. 2007, AJ, 133, 2524
- [117] White, R. J., & Ghez, A. M. 2001, ApJ, 556, 265
- [118] Woitke, P., Kamp, I., & Thi, W. 2009, A&A, 501, 383
- [119] Wood, B. E., & Karovska, M. 2004, ApJ, 601, 502
- [120] Wood, B. E., Redfield, S., Linsky, J. L., Müller, H., & Zank, G. P. 2005, ApJS, 159, 118
- [121] Yang, H., Linsky, J. L., & France, K. 2011, ApJ, 730, L10+
- [122] Yelle, R. V. 2004, Icarus, 170, 167
- [123] Zuckerman, B., Song, I., Bessell, M. S., & Webb, R. A. 2001, ApJ, 562, L87
| IDaaInternal identification number for cross-referencing. | HBCbbCatalog number from Herbig & Bell [50]. | Name | Alternate Name | (2000) | (2000) | Instrument | UT Date | NccNumber of exposures. | (s)ddExposure time. | Program IDeeHST and IUE program ID’s. |
|---|---|---|---|---|---|---|---|---|---|---|
| 1 | … | DK Cet | HD 12039 | 01 57 48.98 | 54 05.3 | ACS PR130L | 2007 JUL 13 | 1 | 2440.0 | 10810 |
| 2 | 20 | LkH 330 | … | 03 45 48.28 | +32 24 11.9 | ACS PR130L | 2007 SEP 25 | 1 | 1786.0 | 11151 |
| 3 | … | 2M0414ffName Abbreviations: 2M0414 for 2MASS J04141188+2811535; 2MJ0439 for 2MASS J04390163+2336029; 2MASS J04442713+2512164; 2M0518 for 2MASS J05180285+2327127; 2M1111 for 2MASS J11114632-7620092; 2M1207A for 2MASS J12073347-3932540; 2M1614N for 2MASS J16141107-2305362 N; 2M1614S for 2MASS J16141107-2305362 S; 2M1842 for 2MASS J18425797-3532427; 2M1852 for 2MASS J18521730-3700119. | XEST 20-OM-002 | 04 14 11.98 | +28 12 00.2 | ACS PR130L | 2008 NOV 08 | 1 | 1769.0 | 11151 |
| 4 | 23 | FM Tau | Haro 6-1 | 04 14 13.44 | +28 12 51.1 | ACS PR130L | 2007 OCT 31 | 1 | 2482.0 | 10840 |
| 5 | 26 | FP Tau | MH 259-23 | 04 14 47.00 | +26 46 26.5 | ACS PR130L | 2007 AUG 15 | 1 | 2482.0 | 10840 |
| 6 | 27 | CX Tau | MH 259-22 | 04 14 47.86 | +26 48 11.0 | ACS PR130L | 2007 AUG 08 | 1 | 2482.0 | 10840 |
| 7 | 368 | LkCa 3 | V1098 Tau | 04 14 47.94 | +27 52 35.8 | STIS G140L | 2003 SEP 20 | 1 | 1859.2 | 9790 |
| 8 | 370 | LkCa 4 | V1068 Tau | 04 16 28.04 | +28 07 35.9 | STIS G140L | 2004 MAR 01 | 1 | 1859.2 | 9790 |
| 9 | 28 | CY Tau | MH 259-5 | 04 17 33.72 | +28 20 46.8 | STIS E140M | 2000 DEC 06 | 1 | 5178.0 | 8206 |
| ACS PR130L | 2007 NOV 04 | 1 | 890.0 | 10864 | ||||||
| 10 | 32 | BP Tau | HD 281934 | 04 19 15.86 | +29 06 27.2 | STIS G140L | 2002 JAN 12 | 1 | 1841.0 | 9081 |
| 11 | 379 | LkCa 7 | V1070 Tau | 04 19 41.35 | +27 49 49.0 | STIS G140L | 2004 FEB 04 | 1 | 1859.2 | 9790 |
| 12 | 33 | DE Tau | MH 259-8 | 04 21 55.57 | +27 55 07.0 | ACS PR130L | 2007 AUG 14 | 1 | 2482.0 | 10840 |
| 13 | 34 | RY Tau | HD 283571 | 04 21 57.44 | +28 26 36.0 | STIS G140L | 2000 SEP 20 | 1 | 1440.0 | 8317 |
| 14 | 35 | T Tau | HD 284419 | 04 21 59.42 | +19 32 06.4 | STIS G140L | 2000 FEB 07 | 1 | 1622.0 | 8317 |
| STIS E140M | 2000 SEP 08 | 1 | 12080.8 | 8157 | ||||||
| 15 | 385 | IP Tau | LkCa 8 | 04 24 57.08 | +27 11 56.6 | ACS PR130L | 2007 AUG 14 | 1 | 2482.0 | 10840 |
| 16 | 36 | DF Tau | HD 283654 | 04 27 02.79 | +25 42 22.6 | STIS E140M | 1999 SEP 18 | 2 | 9390.1 | 8157 |
| 17 | 388 | V1072 Tau | Tap 35 | 04 27 10.57 | +17 50 42.6 | GHRS G160M | 1995 SEP 09 | 1 | 5984.0 | 5875 |
| 18 | 399 | V827 Tau | Tap 42 | 04 32 14.55 | +18 20 15.0 | STIS G140L | 2004 JAN 26 | 1 | 1859.2 | 9790 |
| 19 | 400 | V826 Tau | Tap 43 | 04 32 15.82 | +18 01 39.1 | STIS G140L | 2003 SEP 08 | 1 | 1859.2 | 9790 |
| 20 | … | MHO 6 | … | 04 32 22.10 | +18 27 42.6 | ACS PR130L | 2007 OCT 01 | 1 | 1773.0 | 11151 |
| 21 | 53 | UZ Tau W | Elia 3-11 | 04 32 42.83 | +25 52 31.4 | ACS PR130L | 2007 AUG 15 | 1 | 2182.0 | 10840 |
| 22 | 52 | UZ Tau E | Elia 3-11 | 04 32 43.04 | +25 52 31.1 | ACS PR130L | 2007 AUG 15 | 1 | 2182.0 | 10840 |
| 23 | 405 | V830 Tau | Tap 46 | 04 33 10.02 | +24 33 43.3 | STIS G140L | 2003 OCT 26 | 1 | 1859.2 | 9790 |
| 24 | 56 | GI Tau | Haro 6-21 | 04 33 34.06 | +24 21 17.0 | ACS PR130L | 2007 SEP 10 | 1 | 2300.0 | 10840 |
| 25 | 57 | GK Tau | Haro 6-22 | 04 33 34.56 | +24 21 05.9 | ACS PR130L | 2007 SEP 10 | 1 | 2300.0 | 10840 |
| 26 | 58 | DL Tau | MH 259-13 | 04 33 39.02 | +25 20 38.9 | ACS PR130L | 2007 AUG 15 | 1 | 2480.0 | 10840 |
| 27 | 60 | HN Tau A | Haro 6-24 | 04 33 39.36 | +17 51 52.3 | ACS PR130L | 2007 AUG 31 | 1 | 2476.0 | 10840 |
| 28 | 406 | HN Tau B | Haro 6-24 | 04 33 39.36 | +17 51 52.3 | ACS PR130L | 2007 AUG 31 | 1 | 2476.0 | 10840 |
| 29 | 62 | DM Tau | MH 257-6 | 04 33 48.72 | +18 10 10.1 | STIS G140L | 2003 FEB 05 | 2 | 3882.0 | 9374 |
| 30 | 61 | CI Tau | Haro 6-25 | 04 33 52.00 | +22 50 30.2 | ACS PR130L | 2007 AUG 15 | 1 | 2300.0 | 10840 |
| 31 | 63 | AA Tau | MH 259-17 | 04 34 55.42 | +24 28 53.2 | ACS PR130L | 2007 AUG 15 | 1 | 2480.0 | 10840 |
| 32 | 65 | DN Tau | MH 259-18 | 04 35 27.37 | +24 14 59.5 | ACS PR130L | 2007 AUG 15 | 1 | 2300.0 | 10840 |
| 33 | 67 | DO Tau | MH 259-15 | 04 38 28.58 | +26 10 49.4 | ACS PR130L | 2007 SEP 20 | 1 | 2568.0 | 10840 |
| 34 | … | 2M0439ffName Abbreviations: 2M0414 for 2MASS J04141188+2811535; 2MJ0439 for 2MASS J04390163+2336029; 2MASS J04442713+2512164; 2M0518 for 2MASS J05180285+2327127; 2M1111 for 2MASS J11114632-7620092; 2M1207A for 2MASS J12073347-3932540; 2M1614N for 2MASS J16141107-2305362 N; 2M1614S for 2MASS J16141107-2305362 S; 2M1842 for 2MASS J18425797-3532427; 2M1852 for 2MASS J18521730-3700119. | … | 04 39 01.63 | +23 36 03.0 | ACS PR130L | 2008 SEP 11 | 1 | 1767.0 | 11151 |
| 35 | 419 | LkCa 15 | V1079 Tau | 04 39 17.73 | +22 21 03.8 | STIS G140L | 2003 FEB 13 | 4 | 11357.0 | 9374 |
| 36 | 70 | DP Tau | MH 259-19 | 04 42 37.70 | +25 15 37.5 | ACS PR130L | 2006 DEC 06 | 1 | 2400.0 | 10840 |
| 37 | … | 2M0444ffName Abbreviations: 2M0414 for 2MASS J04141188+2811535; 2MJ0439 for 2MASS J04390163+2336029; 2MASS J04442713+2512164; 2M0518 for 2MASS J05180285+2327127; 2M1111 for 2MASS J11114632-7620092; 2M1207A for 2MASS J12073347-3932540; 2M1614N for 2MASS J16141107-2305362 N; 2M1614S for 2MASS J16141107-2305362 S; 2M1842 for 2MASS J18425797-3532427; 2M1852 for 2MASS J18521730-3700119. | … | 04 44 27.13 | +25 12 16.4 | ACS PR130L | 2008 SEP 11 | 1 | 1418.0 | 11151 |
| 38 | 74 | DR Tau | MH 257-8 | 04 47 06.22 | +16 58 42.1 | STIS E140M | 2000 AUG 29 | 1 | 5794.0 | 8206 |
| ACS PR130L | 2007 NOV 26 | 1 | 2298.0 | 10840 | ||||||
| 39 | 75 | DS Tau | MH 259-2 | 04 47 48.59 | +29 25 11.5 | STIS E140M | 2000 AUG 24 | 1 | 5846.0 | 8206 |
| 40 | 77 | GM Aur | MH 259-1 | 04 55 10.97 | +30 21 59.7 | STIS G140L | 2003 APR 01 | 2 | 4173.0 | 9374 |
| ACS PR130L | 2007 SEP 15 | 1 | 1036.0 | 10864 | ||||||
| 41 | 79 | SU Aur | HD 282624 | 04 55 59.38 | +30 34 01.7 | STIS G140L | 2000 FEB 13 | 2 | 4400.0 | 8317 |
| 42 | 427 | V397 Aur | Tap 57 | 04 56 02.03 | +30 21 04.1 | STIS G140L | 2004 JAN 20 | 1 | 1859.0 | 9790 |
| 43 | 429 | V836 Tau | Tap 59 | 05 03 06.59 | +25 23 20.0 | STIS E140M | 2001 FEB 14 | 1 | 9390.3 | 8157 |
| 44 | 80 | RW Aur AB | HD 240764 | 05 07 49.56 | +30 24 05.2 | GHRS G160M | 1993 AUG 10 | 1 | 897.6 | 3845 |
| 45 | … | 2M0518ffName Abbreviations: 2M0414 for 2MASS J04141188+2811535; 2MJ0439 for 2MASS J04390163+2336029; 2MASS J04442713+2512164; 2M0518 for 2MASS J05180285+2327127; 2M1111 for 2MASS J11114632-7620092; 2M1207A for 2MASS J12073347-3932540; 2M1614N for 2MASS J16141107-2305362 N; 2M1614S for 2MASS J16141107-2305362 S; 2M1842 for 2MASS J18425797-3532427; 2M1852 for 2MASS J18521730-3700119. | … | 05 18 02.85 | +23 27 12.7 | ACS PR130L | 2007 OCT 06 | 1 | 1767.0 | 11151 |
| 46 | 84 | CO Ori | Haro 6-44 | 05 27 38.20 | +11 25 39.1 | STIS G140L | 2000 FEB 25 | 2 | 4212.0 | 8317 |
| 47 | 85 | GW Ori | HD 244138 | 05 29 08.38 | +11 52 12.7 | STIS G140L | 2000 FEB 22 | 1 | 4308.0 | 8317 |
| 48 | 113 | V1044 Ori | Parenago 1404 | 05 34 16.38 | 36 45.3 | STIS G140L | 2000 FEB 15 | 1 | 1555.0 | 8317 |
| 49 | 114 | EZ Ori | Parenago 1409 | 05 34 18.48 | 04 47.6 | STIS G140L | 2000 FEB 25 | 1 | 1515.0 | 8317 |
| 50 | 464 | CQ Tau | HD 36910 | 05 35 58.47 | +24 44 54.1 | ACS PR130L | 2007 OCT 06 | 1 | 890.0 | 10846 |
| 51 | 167 | Parenago 2441 | BD -04 1191 | 05 36 51.27 | 25 40.0 | STIS G140L | 2000 SEP 20 | 1 | 1608.0 | 8317 |
| 52 | … | HD 53143 | SAO 249700 | 06 59 59.65 | 20 10.3 | ACS PR130L | 2007 MAR 20 | 1 | 2480.0 | 10810 |
| 53 | … | HD 61005 | SAO 198166 | 07 35 47.46 | 12 14.0 | ACS PR130L | 2007 SEP 11 | 1 | 2460.0 | 10810 |
| 54 | … | TWA 6 | TYC 7183-1477-1 | 10 18 28.70 | 50 02.9 | ACS PR130L | 2008 NOV 03 | 1 | 1936.0 | 11151 |
| 55 | … | TWA 7 | TYC 7190-2111-1 | 10 42 30.11 | 40 16.2 | ACS PR130L | 2007 MAR 31 | 1 | 2456.0 | 10810 |
| 56 | … | V419 Hya | HD 92945 | 10 43 28.27 | 03 51.4 | ACS PR130L | 2007 MAR 29 | 1 | 2454.0 | 10810 |
| 57 | 568 | TW Hya | CD -7151 | 11 01 51.86 | 42 17.1 | STIS E140M | 2000 MAY 07 | 1 | 2300.2 | 8041 |
| IUE SWP-LO | 1984 JUL 16 | 1 | 6000.0 | TTGJL | ||||||
| IUE LWR-LO | 1979 OCT 29 | 1 | 3600.0 | TTGBH | ||||||
| 58 | … | TWA 3 S | HEN 3-600 | 11 10 27.81 | 31 53.2 | ACS PR130L | 2008 JUL 17 | 1 | 2012.0 | 11151 |
| 59 | … | TWA 3 N | HEN 3-600 | 11 10 27.88 | 31 52.0 | ACS PR130L | 2008 JUL 17 | 1 | 2012.0 | 11151 |
| 60 | … | 2M1111ffName Abbreviations: 2M0414 for 2MASS J04141188+2811535; 2MJ0439 for 2MASS J04390163+2336029; 2MASS J04442713+2512164; 2M0518 for 2MASS J05180285+2327127; 2M1111 for 2MASS J11114632-7620092; 2M1207A for 2MASS J12073347-3932540; 2M1614N for 2MASS J16141107-2305362 N; 2M1614S for 2MASS J16141107-2305362 S; 2M1842 for 2MASS J18425797-3532427; 2M1852 for 2MASS J18521730-3700119. | CHXX 37 | 11 11 44.00 | 20 10.0 | ACS PR130L | 2008 NOV 19 | 1 | 2148.0 | 11151 |
| 61 | … | TWA 13 N | … | 11 21 17.24 | 46 45.5 | ACS PR130L | 2007 JUN 23 | 1 | 2456.0 | 10810 |
| 62 | … | TWA 13 S | … | 11 21 17.45 | 46 49.8 | ACS PR130L | 2007 JUN 23 | 1 | 2456.0 | 10810 |
| 63 | … | HD 98800 N | … | 11 22 05.29 | 46 39.8 | ACS PR130L | 2007 JUN 21 | 1 | 2420.0 | 10810 |
| 64 | … | HD 98800 S | … | 11 22 05.29 | 46 39.8 | ACS PR130L | 2007 JUN 21 | 1 | 2420.0 | 10810 |
| 65 | … | TWA 8 S | … | 11 32 41.16 | 52 09.0 | ACS PR130L | 2007 JUL 13 | 1 | 1934.0 | 11151 |
| 66 | … | TWA 8 N | … | 11 32 41.25 | 51 55.9 | ACS PR130L | 2007 JUL 13 | 1 | 1934.0 | 11151 |
| 67 | … | TWA 9 N | … | 11 48 23.73 | 28 48.5 | ACS PR130L | 2008 NOV 29 | 1 | 1944.0 | 11151 |
| 68 | … | TWA 9 S | … | 11 48 24.23 | 28 49.2 | ACS PR130L | 2008 NOV 29 | 1 | 1944.0 | 11151 |
| 69 | … | TWA 27 | 2M1207AffName Abbreviations: 2M0414 for 2MASS J04141188+2811535; 2MJ0439 for 2MASS J04390163+2336029; 2MASS J04442713+2512164; 2M0518 for 2MASS J05180285+2327127; 2M1111 for 2MASS J11114632-7620092; 2M1207A for 2MASS J12073347-3932540; 2M1614N for 2MASS J16141107-2305362 N; 2M1614S for 2MASS J16141107-2305362 S; 2M1842 for 2MASS J18425797-3532427; 2M1852 for 2MASS J18521730-3700119. | 12 07 33.46 | 32 54.0 | STIS G140L | 2004 JUL 25 | 1 | 5050.0 | 9841 |
| 70 | … | TWA 16 N | … | 12 34 56.29 | 38 07.5 | ACS PR130L | 2008 JUL 10 | 1 | 2008.0 | 11151 |
| 71 | … | TWA 16 S | … | 12 34 56.29 | 38 07.5 | ACS PR130L | 2008 JUL 10 | 1 | 2008.0 | 11151 |
| 72 | … | MML 28 | … | 13 01 50.69 | 04 58.2 | ACS PR130L | 2007 JAN 24 | 1 | 2466.0 | 10810 |
| 73 | … | MML 34 | MP Mus | 13 22 07.55 | 38 12.2 | IUE SWP-LO | 1995 JUL 06 | 1 | 1260.0 | USSBS |
| 74 | … | MML 36 | … | 13 37 57.30 | 34 41.8 | ACS PR130L | 2007 FEB 23 | 1 | 2418.0 | 10810 |
| 75 | 251 | RU Lup | HD 142560 | 15 56 42.26 | 49 15.7 | STIS E140M | 2000 JUL 12 | 1 | 2970.1 | 8157 |
| 76 | … | V1146 Sco | SCO PMS 15 | 15 57 20.18 | 38 48.5 | STIS G140L | 2004 APR 15 | 1 | 1859.0 | 9790 |
| 77 | 608 | V1149 Sco | HD 143006 | 15 58 36.93 | 57 14.9 | IUE SWP-LO | 1993 JUL 19 | 1 | 6000.0 | QC071 |
| 78 | 252 | RY Lup | … | 15 59 28.39 | 21 51.3 | STIS G140L | 2000 AUG 25 | 1 | 4724.0 | 8205 |
| 79 | … | V1154 Sco | SCO PMS 23 | 16 02 10.44 | 41 28.3 | STIS G140L | 2003 SEP 17 | 1 | 1859.2 | 9790 |
| 80 | 612 | HO Lup | Hen 3-1140 | 16 07 00.61 | 02 19.4 | IUE SWP-LO | 1986 APR 24 | 1 | 12600.0 | PMHTS |
| 81 | … | V1157 Sco | SCO PMS 45 | 16 11 20.55 | 20 54.1 | STIS G140L | 2003 SEP 15 | 1 | 1859.2 | 9790 |
| 82 | 254 | V866 Sco | MH 365-14 | 16 11 31.40 | 38 24.5 | IUE SWP-LO | 1979 JUN 06 | 1 | 15060.0 | CC110 |
| 83 | … | 2M1614NffName Abbreviations: 2M0414 for 2MASS J04141188+2811535; 2MJ0439 for 2MASS J04390163+2336029; 2MASS J04442713+2512164; 2M0518 for 2MASS J05180285+2327127; 2M1111 for 2MASS J11114632-7620092; 2M1207A for 2MASS J12073347-3932540; 2M1614N for 2MASS J16141107-2305362 N; 2M1614S for 2MASS J16141107-2305362 S; 2M1842 for 2MASS J18425797-3532427; 2M1852 for 2MASS J18521730-3700119. | … | 16 14 11.07 | 05 36.2 | ACS PR130L | 2008 MAR 13 | 1 | 1861.0 | 11151 |
| 84 | … | 2M1614SffName Abbreviations: 2M0414 for 2MASS J04141188+2811535; 2MJ0439 for 2MASS J04390163+2336029; 2MASS J04442713+2512164; 2M0518 for 2MASS J05180285+2327127; 2M1111 for 2MASS J11114632-7620092; 2M1207A for 2MASS J12073347-3932540; 2M1614N for 2MASS J16141107-2305362 N; 2M1614S for 2MASS J16141107-2305362 S; 2M1842 for 2MASS J18425797-3532427; 2M1852 for 2MASS J18521730-3700119. | … | 16 14 11.07 | 05 36.2 | ACS PR130L | 2008 MAR 13 | 1 | 1861.0 | 11151 |
| 85 | 264 | V2129 Oph | SR 9 | 16 27 40.32 | 22 02.7 | IUE SWP-LO | 1987 APR 13 | 1 | 18900.0 | IC129 |
| 86 | 270 | V1121 Oph | MH 362-3 | 16 49 15.31 | 22 08.6 | IUE SWP-LO | 1981 SEP 11 | 1 | 5100.0 | UK417 |
| 87 | … | V4046 Sgr | HD 319139 | 18 14 10.47 | 47 34.5 | ACS PR130L | 2005 AUG 03 | 1 | 630.0 | 10348 |
| 88 | … | 2M1842ffName Abbreviations: 2M0414 for 2MASS J04141188+2811535; 2MJ0439 for 2MASS J04390163+2336029; 2MASS J04442713+2512164; 2M0518 for 2MASS J05180285+2327127; 2M1111 for 2MASS J11114632-7620092; 2M1207A for 2MASS J12073347-3932540; 2M1614N for 2MASS J16141107-2305362 N; 2M1614S for 2MASS J16141107-2305362 S; 2M1842 for 2MASS J18425797-3532427; 2M1852 for 2MASS J18521730-3700119. | Hen 3-1722 | 18 42 57.97 | 32 42.7 | ACS PR130L | 2008 APR 21 | 1 | 2012.0 | 11151 |
| 89 | … | 2M1852ffName Abbreviations: 2M0414 for 2MASS J04141188+2811535; 2MJ0439 for 2MASS J04390163+2336029; 2MASS J04442713+2512164; 2M0518 for 2MASS J05180285+2327127; 2M1111 for 2MASS J11114632-7620092; 2M1207A for 2MASS J12073347-3932540; 2M1614N for 2MASS J16141107-2305362 N; 2M1614S for 2MASS J16141107-2305362 S; 2M1842 for 2MASS J18425797-3532427; 2M1852 for 2MASS J18521730-3700119. | … | 18 52 17.30 | 00 11.9 | ACS PR130L | 2008 APR 22 | 1 | 2032.0 | 11151 |
| 90 | … | AU Mic | HD 197481 | 20 45 09.53 | 20 27.3 | IUE LWR-LO | 1980 AUG 05 | 18 | 32400.0 | multipleggMultiple program IDs: MR381, FSCJL and UK353. |
| IUE SWP-LO | 1980 AUG 04 | 14 | 151200.0 | multipleggMultiple program IDs: MR381, FSCJL and UK353. | ||||||
| 91 | … | HD 202917 | SAO 246975 | 21 20 49.96 | 02 03.1 | ACS PR130L | 2007 MAR 24 | 1 | 2504.0 | 10810 |
| ID | Name | Region | Distance (pc) | Typeaa“SB” stands for spectroscopic binary and “B” stands for binary. | Category | logbbPhotospheric luminosity in units of solar luminosity. | logccAccretion luminosity in units of solar luminosity. | logddX-ray (0.3 - 10.0 keV) luminosity in units of erg . | HeeFluxes of the H and Ca II K lines in units of erg . | Ca II KeeFluxes of the H and Ca II K lines in units of erg . | Reference ffReferences: 1: White et al. [116]; 2: Perryman et al. [96]; 3: Cohen & Kuhi [24]; | |
|---|---|---|---|---|---|---|---|---|---|---|---|---|
| 1 | DK Cet | field | 42 | G4 | WTTS | 0.0 | -0.05 | … | … | … | … | 1,2 |
| 2 | LkH330 | Per | 250 | G3 | CTTS | 1.8 | 1.2 | … | … | … | … | 3 |
| 3 | 2M0414 | Taurus | 140 | M6.25 | CTTS | 0.7 | -1.90 | -2.50 | … | 2.50 | 1.90 | 4 |
| 4 | FM Tau | Taurus | 140 | M1 | CTTS | 0.3 | -0.77 | -1.7 | 29.69 | 17.8 | 3.32 | 5,33 |
| 5 | FP Tau | Taurus | 140 | M4 | CTTS | 0.0 | -0.57 | -2.8 | … | 10.7 | 1.54 | 5 |
| 6 | CX Tau | Taurus | 140 | M2.5 | CTTS | 0.2 | -0.48 | -2.6 | … | 14.9 | 2.12 | 5 |
| 7 | LkCa 3 | Taurus | 140 | M1 | WTTS | 0.4 | 0.04 | … | … | 2.42 | 4.35 | 6 |
| 8 | LkCa 4 | Taurus | 140 | K7 | WTTS | 1.2 | -0.02 | … | 30.30 | 5.86 | 4.30 | 5,34 |
| 9 | CY Tau | Taurus | 140 | M2 | CTTS | 0.3 | -0.34 | -1.39 | 29.18 | 54.8 | 8.89 | 7,33 |
| 10 | BP Tau | Taurus | 140 | K7 | CTTS | 0.5 | -0.03 | -0.75 | 30.17 | 85.5 | 20.5 | 7,33 |
| 11 | LkCa 7 | Taurus | 140 | M0+M3.5 | WTTS | 0.6 | -0.14 | … | … | 5.40 | 3.65 | 6 |
| 12 | DE Tau | Taurus | 140 | M2 | CTTS | 0.6 | -0.06 | -1.15 | 28.4 | 6.58 | 5.68 | 7,36 |
| 13 | RY Tau | Taurus | 140 | F8 | CTTS | 1.8 | 0.89 | … | 30.72 | … | … | 8,33 |
| 14 | T Tau | Taurus | 140 | K0 | CTTS | 1.5 | 0.86 | -0.29 | 30.97 | 517 | 261 | 5,33 |
| 15 | IP Tau | Taurus | 140 | M0 | CTTS | 0.3 | -0.39 | -2.15 | … | 14.7 | 4.26 | 7 |
| 16 | DF Tau | Taurus | 140 | M2 | CTTS | 0.6 | 0.16 | -0.75 | … | 1567 | 31.7 | 4 |
| 17 | HBC 388 | Taurus | 140 | K1 | WTTS? | 0.0 | 0.13 | … | … | … | … | 5 |
| 18 | V827 Tau | Taurus | 140 | K7 | WTTS | 1.1 | 0.04 | … | 30.57 | 6.22 | 5.02 | 5,33 |
| 19 | V826 Tau | Taurus | 140 | K7 | WTTS | 0.3 | -0.10 | … | 30.62 | 6.09 | 4.31 | 6,33 |
| 20 | MHO 6 | Taurus | 140 | M5 | CTTS | 1.0 | -0.85 | -2.80 | … | 1.60 | 0.45 | 4 |
| 21 | UZ Tau W | Taurus | 140 | M1+M4 | CTTS | 1.0 | -0.20 | -1.5 | 29.87 | 16.5 | 2.86 | 5,33 |
| 22 | UZ Tau E | Taurus | 140 | M2+M3 | CTTS | 0.3 | -0.51 | -1.6 | [W+E] | 34.8 | 33.6 | 5,33 |
| 23 | V830 Tau | Taurus | 140 | K7 | WTTS | 0.7 | -1.01 | … | 30.68 | 4.08 | 4.63 | 5,33 |
| 24 | GI Tau | Taurus | 140 | K7 | CTTS | 1.3 | -0.07 | -1.03 | 29.94 | 3.11 | 0.74 | 7,33 |
| 25 | GK Tau AB | Taurus | 140 | K7 | CTTS | 0.9 | 0.03 | -1.46 | 30.09 | 11.1 | 4.14 | 7,33 |
| 26 | DL Tau | Taurus | 140 | K7 | CTTS | 1.3 | … | -0.65 | … | 60.9 | 38.1 | 9 |
| 27 | HN Tau A | Taurus | 140 | K5 | CTTS | 0.6 | -0.72 | -1.45 | 29.26 | 28.8 | 38.9 | 7,33 |
| 28 | HN Tau B | Taurus | 140 | M4.5 | CTTS | 0.9 | -1.60 | … | [A+B] | 2.47 | 1.84 | 5,33 |
| 29 | DM Tau | Taurus | 140 | M1 | CTTS | 0.6 | -0.61 | -1.5 | 29.26 | 24.1 | 2.98 | 5,33 |
| 30 | CI Tau | Taurus | 140 | K7 | CTTS | 1.8 | -0.08 | -0.57 | … | 44.4 | 29.4 | 5 |
| 31 | AA Tau | Taurus | 140 | K7 | CTTS | 0.74 | -0.13 | -1.60 | 30.02 | 10.4 | 3.67 | 7,33 |
| 32 | DN Tau | Taurus | 140 | M0 | CTTS | 1.9 | -0.06 | -1.79 | 30.03 | 10.5 | 5.01 | 7,33 |
| 33 | DO Tau | Taurus | 140 | M0 | CTTS | 2.3 | 0.00 | -0.20 | … | 48.2 | 42.1 | 7 |
| 34 | 2M0439 | Taurus | 140 | M5 | CTTS | 0.0 | -1.05 | -3.20 | … | 1.54 | 0.59 | 4 |
| 35 | LkCa 15 | Taurus | 140 | K5 | CTTS | 1.0 | -0.13 | -1.6 | … | … | 6.64 | 5 |
| 36 | DP Tau | Taurus | 140 | M0.5 | CTTS | 1.2 | … | -1.4 | … | … | … | 9 |
| 37 | 2M0444 | Taurus | 140 | M7.25 | CTTS | 0.0 | -1.92 | -4.60 | … | 0.34 | 0.053 | 7 |
| 38 | DR Tau | Taurus | 140 | K7 | CTTS | 1.2 | … | -0.13 | … | 71.4 | 119 | 10 |
| 39 | DS Tau | Taurus | 140 | K5 | CTTS | 0.3 | -0.24 | -0.70 | … | 47.1 | 13.7 | 7 |
| 40 | GM Aur | Taurus | 140 | K5 | CTTS | 0.3 | -0.13 | -1.15 | 29.84 | 66.4 | 10.2 | 7,34 |
| 41 | SU Aur | Taurus | 140 | G2 | CTTS | 0.9 | 0.89 | -1.00 | 31.07 | … | … | 11,33 |
| 42 | V397 Aur | Taurus | 140 | K5 | WTTS | 0.0 | -0.10 | … | 30.51 | … | 3.89 | 6,33 |
| 43 | V836 Tau | Taurus | 140 | K7 | CTTS | 1.1 | -0.49 | -2.50 | … | 9.44 | 1.46 | 4 |
| 44 | RW Aur AB | Taurus | 140 | K4 | CTTS | 1.2 | … | 0.64 | … | 126 | 521 | 9 |
| 45 | 2M0518 | Taurus | 140 | M5 | CTTS | 1.0 | 0.016 | -2.55 | … | 1.51 | 0.43 | 4 |
| 46 | CO Ori | Ori | 450 | G0 | CTTS | 2.0 | 1.35 | 0.22 | … | … | … | 11 |
| 47 | GW Ori | Ori | 450 | G0 | CTTS | 1.3 | 1.79 | 0.67 | … | … | … | 11 |
| 48 | V1044 Ori | Ori OB 1c | 440 | G2 | CTTS | 2.0 | 0.83 | -0.22 | … | … | … | 11 |
| 49 | EZ Ori | Ori OB 1c | 440 | G3 | CTTS | 0.6 | 0.77 | -1.00 | … | … | … | 11 |
| 50 | CQ Tau | 130 | F2 | CTTS | 1.9 | 0.82 | … | … | … | … | 12 | |
| 51 | Parenago 2441 | Ori OB 1c | 440 | F9 | CTTS | 0.4 | 1.06 | -0.40 | … | … | … | 11 |
| 52 | HD 53143 | field | 18.4 | G8 | WTTS | 0.0 | -0.30 | … | … | … | … | 2,13 |
| 53 | HD 61005 | field | 35 | G4 | WTTS | 0.0 | -0.25 | … | … | … | … | 2,1 |
| 54 | TWA 6 | TWA | 51 | K7 | WTTS | 0.0 | -0.93 | … | … | 19.9 | 9.71 | 14,15 |
| 55 | TWA 7 | TWA | 27 | M1 | WTTS | 0.0 | -1.09 | … | 29.46 | 29.8 | 22.9 | 14,15,35 |
| 56 | V419 Hya | field | 22 | K0 | WTTS | 0.0 | -0.43 | … | … | … | … | 2,16 |
| 57 | TW Hya | TWA | 56 | K7 | CTTS | 0.0 | -0.77 | -1.50 | … | 462 | 65.0 | 2,4 |
| 58 | TWA 3 S | TWA | 34 | M3.5 | WTTS | 0.0 | -1.27 | … | 29.17 | 6.92 | 6.46 | 14,17,35 |
| 59 | TWA 3 N | TWA | 34 | M3 | CTTS | 0.0 | -1.10 | -2.50 | [S+N] | 47.9 | 12.3 | 14,17,35 |
| 60 | 2M1111 | Cha I | 175 | K1 | CTTS | 1.3 | 0.33 | … | 30.6 | … | … | p07 |
| 61 | TWA 13 N | TWA | 53 | M1 | WTTS | 0.0 | -0.77 | … | 29.87 | 20.2 | 14.7 | 14,18,36 |
| 62 | TWA 13 S | TWA | 53 | M2 | WTTS | 0.0 | -0.79 | … | 29.97 | 39.2 | 2.54 | 14,18,36 |
| 63 | HD 98800 N | TWA | 40 | K5(SB) | WTTS | 0.0 | -0.38 | … | … | … | … | 14,15 |
| 64 | HD 98800 S | TWA | 40 | K5(SB) | WTTS | 0.0 | -0.35 | … | … | … | … | 14,15 |
| 65 | TWA 8 S | TWA | 39 | M5 | WTTS | 0.0 | -1.66 | … | 28.56 | 2.65 | 1.47 | 14,15,36 |
| 66 | TWA 8 N | TWA | 38 | M2 | WTTS | 0.0 | -1.04 | … | 29.76 | 22.5 | 14.8 | 14,15,36 |
| 67 | TWA 9 N | TWA | 56 | M1 | WTTS | 0.0 | -0.82 | … | 28.85 | 3.09 | 2.10 | 14,15,36 |
| 68 | TWA 9 S | TWA | 69 | K5 | WTTS | 0.0 | -0.52 | … | 30.08 | 18.8 | 8.74 | 14,15,36 |
| 69 | TWA 27 | TWA | 52.4 | M8.25 | BD | 0.0 | -2.72 | -5.30 | … | 0.341 | 0.0128 | 19,17 |
| 70 | TWA 16 N | TWA | 72 | M1.5 | WTTS | 0.0 | -0.74 | … | … | … | … | 14,20 |
| 71 | TWA 16 S | TWA | Included in primary component | |||||||||
| 72 | MML 28 | field | 108 | K2 | WTTS | 0.6 | -0.37 | … | 30.0 | … | … | 21 |
| 73 | MML 34 | isolated? | 86 | K1 | CTTS | 1.2 | 0.10 | … | 30.2 | … | … | 2 |
| 74 | MML 36 | field | 81 | K0 | WTTS | 0.0 | 0.0 | … | 30.4 | … | … | 21 |
| 75 | RU Lup | Lup | 140 | K7 | CTTS | 0.1 | -0.22 | -0.50 | … | 361 | 492 | 22 |
| 76 | V1146 Sco | USco | 145 | M0(B) | WTTS | 0.0 | -0.41 | … | … | … | 1.27 | 23,24,25 |
| 77 | HD 143006 | USco | 145 | G6 | CTTS | 1.6 | 0.39 | … | 30.1 | … | … | 23,26 |
| 78 | RY Lup | Lup | 140 | K4 | CTTS | 0.65 | 0.42 | … | … | … | … | 27 |
| 79 | V1154 Sco | USco | 145 | K5(B) | WTTS | 0.4 | 0.08 | … | … | … | … | 23,24,25 |
| 80 | HO Lup | Lup | 140 | M1 | CTTS | 1.3 | 0.30 | … | … | … | … | 28 |
| 81 | V1157 Sco | USco | 145 | K5 | WTTS | 1.0 | -0.14 | … | … | … | 0.756 | 23,24,25 |
| 82 | V866 Sco | Oph | 125 | K0 | CTTS | 2.2 | … | 0.16 | … | 171 | 132 | 29,9 |
| 83 | 2M1614N | USco | 145 | K0 | CTTS | 1.5 | 0.50 | … | 30.5 | … | … | 23,26 |
| 84 | 2M1614S | USco | Included in primary component | |||||||||
| 85 | V2129 Oph | Oph | 125 | K6 | CTTS | 0.6 | 0.23 | … | … | 56.0 | 22.3 | 29,30, |
| 86 | V1121 Oph | Oph | 125 | K5 | CTTS | 1.2 | redo | -0.6 | … | … | … | 29,31,9 |
| 87 | V4046 Sgr | isolated | 83 | K5(SB) | CTTS | 0.0 | -0.09 | … | … | … | … | |
| 88 | 2M1842 | CrA | 130 | K2 | CTTS | 1.0 | 0.12 | … | 30.3 | 33.0 | 17.0 | 1,26,32 |
| 89 | 2M1852 | CrA | 130 | K3 | CTTS | 0.9 | -0.24 | … | 30.5 | 22.9 | 9.49 | 1,26,32 |
| 90 | AU Mic | Pic | 9.9 | M1 | WTTS | -0.9 | … | … | 29.5 | 20 | ||
| 91 | HD 202917 | TucHor | 46 | G7 | WTTS | 0.0 | -0.18 | … | … | … | … | 16 |
| Observatory | Instrument | Setting | Wavelength Range | Aperture | Resolution | log aaC IV flux levels below which the measurement errors are typically 10%. |
|---|---|---|---|---|---|---|
| HST | STIS | E140M | 1150–1700 | 45,800 | -13.2 | |
| HST | STIS | G140L | 1150–1700 | 935–1440 | -14.0 | |
| HST | ACS/SBC | PR130L | 1250–2000 | 60–150 | -12.7 | |
| HST | GHRS | G160M | 1382–1420 | 18,000 | N/A | |
| 1532–1568 | 19,000 | N/A | ||||
| IUE | SWP-LO | 1150-1975 | -13.0 |
| ID | Name | Instrument | O I 1304 | C II 1335 | O I 1355 | Si IV 1394 | Si IV 1403 | C IV 1549 | He II 1640 | emission | |
|---|---|---|---|---|---|---|---|---|---|---|---|
| 1 | DK Cet | ACS | 10.3(1.5) | 13.4(1.7) | … | 16.9(2.9) | — | 40.7(8.1) | 28.0(8.5) | No | |
| 2 | LkH330 | ACS | … | … | … | … | … | 0.83(0.11) | … | No | |
| 3 | 2M0414 | ACS | 0.94(0.20) | 2.50(0.38) | … | 4.16(0.76) | — | 17.8(3.9) | 4.16(0.76) | No | |
| 4 | FM Tau | ACS | … | … | … | … | … | 16.2(3.8) | 21.4(7.0) | No | |
| 5 | FP Tau | ACS | 0.48(0.08) | 1.22(0.13) | … | 1.91(0.20) | — | 1.72(0.35) | … | Yes | |
| 6 | CX Tau | ACS | 0.41(0.08) | 0.83(0.13) | … | … | … | 1.71(0.23) | … | Yes | |
| 7 | LkCa 3 | STIS G140L | 3.85(0.42) | 3.41(0.32) | 0.46(0.16) | 1.03(0.19) | 0.63(0.17) | 5.95(0.67) | 3.89(0.75) | No | |
| 8 | LkCa 4 | STIS G140L | 7.31(0.54) | 10.3(0.6) | 1.10(0.26) | 4.39(0.41) | 2.79(0.36) | 28.8(1.5) | 12.6(1.4) | No | |
| 9 | CY Tau | STIS E140M | 40.0(1.7) | 14.3(0.7) | … | 9.0(0.5) | 6.7(0.6) | 79.1(4.5) | 33.6(2.2) | Yes | |
| CY Tau | ACS | 9.35(0.89) | 7.02(0.71) | … | 12.4(1.9) | — | 19.5(2.2) | 22.7(2.2) | Yes | ||
| 10 | BP Tau | STIS G140L | 104(07) | 35.6(3.6) | … | 31.6(2.9) | 27.5(4.3) | 246(08) | 135(08) | Yes | |
| 11 | LkCa 7 | STIS G140L | 4.40(0.39) | 5.55(0.42) | 0.84(0.21) | 1.24(0.23) | 0.96(0.23) | 12.0(1.0) | 10.0(1.3) | No | |
| 12 | DE Tau | ACS | 55.3(3.6) | 13.5(1.3) | … | 18.2(1.8) | — | 70.8(9.9) | 25.0(4.5) | Yes | |
| 13 | RY Tau | STIS G140L | 79(3) | 49.7(5.0) | 11.8(5.0) | 38.6(3.0) | 50.5(2.0) | 59.3(3.0) | 28.6(3.0) | Yes | |
| 14 | T Tau | STIS G140L | 176(2) | 33.7(6.0) | 15.0(2.0) | 51.9(3.0) | 60.7(6.0) | 215(10) | 56.4(2.0) | Yes | |
| T Tau | STIS E140M | 170(2) | 19.3(0.8) | 12.9(0.4) | 31.0(1.0) | 16.2(1.4) | 165(3) | 48.1(2.3) | Yes | ||
| 15 | IP Tau | ACS | 2.36(0.41) | 2.24(0.31) | … | 4.97(0.64) | — | 27.8(2.2) | 16.6(3.2) | No | |
| 16 | DF Tau | STIS E140M | 15.0(0.7) | 9.0(0.9) | … | 9.0(1.2) | 7.6(0.4) | 28.9(3.0) | 4.5(0.9) | Yes | |
| 17 | V1072 Tau | GHRS G160M | … | … | … | 7(1) | 4(1) | 14(2) | … | … | … |
| 18 | V827 Tau | STIS G140L | 4.25(0.38) | 4.37(0.36) | 1.06(0.21) | 1.51(0.24) | 1.22(0.24) | 10.8(0.9) | 8.8(1.1) | No | |
| 19 | V826 Tau | STIS G140L | 2.63(0.33) | 4.21(0.35) | 0.86(0.18) | 1.42(0.23) | 0.94(0.21) | 10.9(0.9) | 7.6(1.0) | No | |
| 20 | MHO 6 | ACS | … | … | … | … | … | … | … | Yes | |
| 21 | UZ Tau W | ACS | 4.04(0.56) | 1.38(0.28) | … | 1.12(0.27) | — | 8.0(1.1) | 6.4(1.2) | Yes | |
| 22 | UZ Tau E | ACS | 5.1(1.3) | 6.5(1.4) | … | 12.7(2.3) | — | 13.7(2.7) | … | Yes | |
| 23 | V830 Tau | STIS G140L | 3.56(0.35) | 4.13(0.35) | 0.67(0.17) | 1.10(0.20) | 0.91(0.20) | 8.76(0.81) | 7.1(1.0) | No | |
| 24 | GI Tau | ACS | … | … | … | 0.91(0.19) | — | 2.97(0.66) | 1.77(0.54) | Yes | |
| 25 | GK Tau | ACS | 2.42(0.33) | 2.31(0.33) | … | 3.00(0.61) | — | 14.3(2.1) | 12.1(2.8) | No | |
| 26 | DL Tau | ACS | 0.76(0.08) | 0.34(0.07) | … | 3.35(0.30) | — | 6.12(0.91) | … | No | |
| 27 | HN Tau A | ACS | 2.66(0.35) | 7.1(1.2) | … | 16.7(3.7) | — | 6.9(1.7) | … | Yes | |
| 28 | HN Tau B | ACS | 0.69(0.15) | 0.39(0.09) | … | … | … | 2.79(0.66) | 1.10(0.27) | No | |
| 29 | DM Tau | STIS G140L | 25.0(4.6) | 24.3(5.3) | 10.7(5.0) | 25.5(6.9) | — | 62.2(7.1) | 64.9(8.4) | Yes | |
| 30 | CI Tau | ACS | 0.40(0.06) | 0.13(0.05) | … | 0.36(0.10) | — | 0.62(0.24) | … | Yes | |
| 31 | AA Tau | ACS | … | 5.4(1.4) | … | 6.7(1.3) | — | … | … | Yes | |
| 32 | DN Tau | ACS | 27.5(1.6) | 7.7(1.2) | … | 7.6(1.3) | — | 41.9(4.7) | 37.6(6.4) | No | |
| 33 | DO Tau | ACS | … | 1.56(0.59) | … | 3.66(0.77) | — | … | … | Yes | |
| 34 | 2M0439 | ACS | … | … | … | … | … | 1.15(0.24) | 0.91(0.26) | Yes | |
| 35 | V1079 Tau | STIS G140L | 8.7(1.1) | 8.3(1.2) | … | 24.1(2.2) | — | 80.3(4.7) | 15.5(1.9) | Yes | |
| 36 | DP Tau | ACS | 5.16(0.87) | 15.5(1.5) | … | 8.7(1.4) | — | … | … | Yes | |
| 37 | 2M0444 | ACS | … | … | … | … | … | … | … | Yes | |
| 38 | DR Tau | STIS E140M | 29.0(1.5) | … | 4.70(0.60) | 4.19(0.45) | 4.34(0.44) | 11.3(2.3) | 7.5(1.5) | Yes | |
| DR Tau | ACS | 27.8(2.9) | … | … | 18.5(2.7) | — | 28.7(6.0) | … | Yes | ||
| 39 | DS Tau | STIS E140M | 32.5(2.1) | 23.5(2.6) | … | 23.5(1.5) | 18.2(1.0) | 287(10) | 85.7(5.6) | Yes | |
| 40 | GM Aur | STIS G140L | 91.9(7.6) | 35.9(5.8) | … | 53.8(8.6) | — | 168(12) | 50.8(6.7) | Yes | |
| GM Aur | ACS | 56.8(6.0) | 21.8(2.6) | … | 28.9(3.6) | — | 118(13) | 48.0(5.7) | Yes | ||
| 41 | SU Aur | STIS G140L | 137(5) | 74.7(3.0) | 36.8(3.0) | 41.1(3.0) | 53(5) | 242(10) | 55.9(6.0) | Yes | |
| 42 | V397 Aur | STIS G140L | 3.95(0.35) | 4.84(0.38) | 0.85(0.20) | 1.94(0.27) | 1.53(0.28) | 10.9(0.9) | 8.3(1.1) | No | |
| 43 | V836 Tau | STIS E140M | … | … | … | 2.0(0.8) | 1.0(1.0) | 16.4(1.3) | 4.0(1.5) | Yes | … |
| 44 | RW Aur AB | GHRS G160M | … | … | … | 190(20) | 250(20) | 230(64) | … | N/A | … |
| 45 | 2M0518 | ACS | 1.19(0.08) | 1.28(0.10) | … | 0.72(0.10) | — | 7.10(0.67) | … | No | |
| 46 | CO Ori | STIS G140L | 8.6(0.5) | 7.8(0.8) | 1.8(0.5) | 3.1(0.5) | 2.8(2.0) | 7.1(0.8) | 2.3(0.8) | Yes | |
| 47 | GW Ori | STIS G140L | 175(10) | 43.7(3.0) | 15.2(7.0) | 50.1(10.0) | 49.1(3.0) | 166(5) | 45.7(5.0) | Yes | |
| 48 | V1044 Ori | STIS G140L | 66(20) | 20.1(0.2) | 9.3(2.0) | 44.4(1.0) | 44.6(1.0) | 113(10) | 22.0(3.0) | No | |
| 49 | EZ Ori | STIS G140L | 56.0(7.0) | 14.3(1.9) | 11.7(1.7) | 14.9(1.0) | 17.0(0.5) | 47.7(3.0) | 11.4(1.0) | No | |
| 50 | CQ Tau | ACS | 107(12) | 82(11) | … | 27.4(2.5) | — | 153(13) | … | No | |
| 51 | Parenago 2441 | STIS G140L | 17.5(2.0) | 10.8(2.0) | 5.6(0.1) | 11.5(0.1) | 10.3(1.0) | 26.2(2.0) | 10.9(2.0) | No | |
| 52 | HD 53143 | ACS | 13.0(0.9) | 18.6(1.1) | … | 14.2(1.5) | — | 38.8(4.4) | 26.5(3.5) | Yes | |
| 53 | HD 61005 | ACS | 5.71(0.49) | 10.3(0.7) | … | 9.55(0.78) | — | 25.5(3.2) | 18.7(2.2) | No | |
| 54 | TWA 6 | ACS | 7.84(0.71) | 15.5(0.9) | … | 12.0(0.9) | — | 59.8(4.0) | 30.5(3.2) | No | |
| 55 | TWA 7 | ACS | 10.7(0.8) | 13.2(1.0) | … | 8.42(0.86) | — | 42.2(3.6) | 47.4(3.6) | No | |
| 56 | V419 Hya | ACS | 11.6(0.8) | 19.1(1.2) | … | 10.0(1.0) | — | 37.0(4.7) | 36.2(4.5) | No | |
| 57 | TW Hya | STIS E140M | 706(15) | 469(5) | 23.3(4.5) | 164(9) | 86.5(5.9) | 4472(166) | 1195(41) | Yes | |
| 58 | TWA 3S | ACS | 5.7(1.0) | 10.5(0.9) | … | 7.92(0.75) | — | 36.6(3.8) | 22.4(2.2) | No | |
| 59 | TWA 3N | ACS | 9.8(1.3) | 14.6(1.9) | … | 9.14(1.4) | — | 55.8(10.5) | … | Yes | |
| 60 | 2M1111 | ACS | 0.64(0.17) | 1.61(0.27) | … | 2.11(0.46) | — | 9.4(1.3) | 7.8(1.7) | Yes | |
| 61 | TWA 13 N | ACS | 5.62(0.40) | 7.83(0.62) | … | 3.24(0.39) | — | 18.1(1.6) | 21.2(2.3) | No | |
| 62 | TWA 13 S | ACS | 5.52(0.57) | 6.61(0.57) | … | 4.11(0.42) | — | 21.5(1.8) | 22.4(2.4) | No | |
| 63 | HD 98800 N | ACS | 4.15(0.73) | 5.17(0.71) | … | 2.97(0.64) | — | 24.2(2.6) | 12.8(2.3) | Yes | |
| 64 | HD 98800 S | ACS | 10.6(0.9) | 13.5(0.8) | … | 6.79(0.76) | — | 34.5(2.9) | 40.5(2.7) | No | |
| 65 | TWA 8 S | ACS | 1.67(0.13) | 1.80(0.21) | … | 1.27(0.17) | — | 4.49(0.48) | 4.92(0.59) | No | |
| 66 | TWA 8 N | ACS | 7.73(0.66) | 9.97(0.93) | … | 4.11(0.50) | — | 23.6(1.8) | 25.5(1.7) | No | |
| 67 | TWA 9 N | ACS | 0.99(0.08) | 0.86(0.11) | … | 0.64(0.10) | — | 2.68(0.29) | 3.53(0.35) | Yes | |
| 68 | TWA 9 S | ACS | 5.81(0.49) | 7.06(0.72) | … | 4.97(0.46) | — | 25.3(2.0) | 28.0(2.6) | No | |
| 69 | TWA 27 | STIS G140L | 0.47(0.20) | 0.62(0.12) | … | … | … | 3.12(0.39) | 0.67(0.25) | Yes | |
| 70 | TWA 16 N | ACS | 1.47(0.12) | 1.47(0.13) | … | 0.89(0.10) | — | 3.55(0.37) | 5.52(0.51) | No | |
| 71 | TWA 16 S | ACS | 1.42(0.12) | 2.03(0.19) | … | 1.29(0.15) | — | 4.79(0.54) | 5.19(0.73) | No | |
| 72 | MML 28 | ACS | 1.66(0.13) | 1.41(0.13) | … | 1.41(0.14) | — | 6.24(0.84) | 7.5(1.3) | Yes | |
| 73 | MML 34 | IUE | 365(39) | 256(31) | … | … | … | 1172(67) | … | Yes | |
| 74 | MML 36 | ACS | … | … | … | … | … | 1.07(0.22) | … | No | |
| 75 | RU Lup | STIS E140M | 261(2) | 118(2) | 35.5(1.2) | 390(4) | 303(4) | 705(7) | 75.7(2.1) | Yes | |
| 76 | V1146 Sco | STIS G140L | 0.87(0.18) | 1.16(0.18) | … | 0.44(0.12) | — | 2.46(0.44) | 1.99(0.54) | No | |
| 77 | V1149 Sco | IUE | … | … | … | … | … | 130(10) | … | No | |
| 78 | RY Lup | STIS G140L | 50.6(2.4) | 50.0(2.3) | 11.0(1.7) | 20.3(2.8) | — | 82.8(3.7) | 11.0(2.5) | 266 | |
| 79 | V1154 Sco | STIS G140L | 3.20(0.35) | 5.42(0.41) | 0.74(0.18) | 2.64(0.37) | — | 7.25(0.79) | 8.46(1.1) | No | |
| 80 | HO Lup | IUE | 75(10) | … | … | … | 26(8) | 121(15) | 38(12) | Yes | |
| 81 | V1157 Sco | STIS G140L | 0.17(0.09) | 0.17(0.07) | … | 0.14(0.06) | 0.07(0.06) | 1.09(0.28) | 0.83(0.37) | No | |
| 82 | V866 Sco | IUE | 34.0(6.3) | … | … | 30.9(4.5) | 21.4(4.5) | 50(13) | … | No | |
| 83 | 2M1614N | ACS | … | 1.13(0.19) | … | 1.33(0.26) | — | 6.37(0.90) | 3.39(0.54) | Yes | |
| 84 | 2M1614S | ACS | 1.46(0.27) | 2.16(0.27) | … | 2.95(0.40) | — | 12.6(1.4) | 6.4(1.5) | No | |
| 85 | V2129 Oph | IUE | … | … | … | 18.1(4.0) | 19.4(4.0) | 195(17) | 89(17) | No | |
| 86 | V1121 Oph | IUE | … | … | … | 18.1(4.0) | 19.6(4.0) | 77(13) | … | No | |
| 87 | V4046 Sgr | ACS | 56.7(7.0) | 84.7(9.1) | … | 49.0(7.7) | — | 227(19) | 130(11) | Yes | |
| 88 | 2M1842 | ACS | 77.9(0.72) | 54.9(6.8) | … | 84.3(9.3) | — | 221(23) | 55.7(9.6) | Yes | |
| 89 | 2M1852 | ACS | 4.54(0.53) | 6.68(0.96) | … | 5.96(0.80) | — | 16.0(2.3) | … | Yes | |
| 90 | AU Mic | STIS E140M | 98.8 | 21.28 | 5.2 | 49.3 | 29.2 | 327.0 | 263.5 | No | |
| 91 | HD 202917 | ACS | 11.0(1.2) | 23.9(2.3) | … | 19.8(2.4) | — | 68.6(8.2) | 51(13) | No |
Note. — The flux values are in units of erg . “…” indicates that the line is not apparent in the spectrum. “—” indicates that the Si IV 1403 line is not resolved and the flux in the Si IV 1394 column represents the total flux of the doublet. The total FUV luminosity between 1250 and 1700Å, , are in solar units.
| ID | Object | O I 1304 | % | C II 1335 | % | Si IV 1394 + Si IV 1403 | % | C IV 1549 | % |
|---|---|---|---|---|---|---|---|---|---|
| 7 | LkCa 3 | 3.91 | 1.6 | 3.56 | 4.3 | 1.69 | 1.8 | 6.90 | 16.0 |
| 8 | LkCa 4 | 7.21 | -1.4 | 10.0 | -2.9 | 7.46 | 3.9 | 32.1 | 11.5 |
| 10 | BP Tau | 109 | 5.3 | 45.0 | 26.7 | 64.7 | 9.6 | 247 | 0.5 |
| 11 | LkCa 7 | 4.51 | 2.5 | 5.21 | -6.1 | 2.28 | 3.6 | 12.5 | 4.2 |
| 13 | RY Tau | 71.7 | -5.0 | 45.4 | -0.8 | 76.8 | -10.3 | 698 | 3.9 |
| 14 | T Tau | 253 | -1.6 | 31.2 | -17.7 | 108 | 0.0 | 225 | 4.7 |
| 18 | V827 Tau | 4.43 | 4.2 | 4.55 | 4.1 | 2.25 | -17.6 | 12.7 | 17.2 |
| 19 | V826 Tau | 2.62 | -0.4 | 4.24 | 0.7 | 2.16 | -8.5 | 11.3 | 3.7 |
| 23 | V830 Tau | 3.88 | 9.0 | 4.10 | -0.7 | 1.97 | -2.0 | 9.25 | 5.6 |
| 29 | DM Tau | 20.3 | -15.4 | 20.9 | -16.7 | 28.3 | 28.6 | 61.6 | -1.0 |
| 35 | LkCa 15 | 11.9 | 36.2 | 11.6 | 39.3 | 23.0 | -4.5 | 75.1 | -6.5 |
| 40 | GM Aur | 88.9 | -3.3 | 35.5 | -1.2 | 46.6 | -14.2 | 145 | -13.7 |
| 41 | SU Aur | 166 | -2.9 | 66.5 | -10.4 | 89.4 | -1.4 | 267 | 3.7 |
| 42 | V397 Aur | 4.06 | 2.8 | 4.75 | -1.9 | 3.59 | 3.4 | 12.4 | 13.6 |
| 46 | CO Ori | 8.23 | -5.3 | 6.85 | -4.2 | 9.23 | 9.2 | 9.55 | 8.9 |
| 47 | GW Ori | 206 | 4.4 | 40.5 | -3.7 | 94.7 | -1.6 | 188 | -9.4 |
| 48 | V1044 Ori | 97.1 | -2.9 | 19.6 | -3.1 | 97.2 | 0.4 | 128 | 7.2 |
| 40 | EZ Ori | 63.4 | -3.5 | 12.2 | -14.9 | 29.6 | -1.8 | 50.9 | 10.5 |
| 51 | Parenago 2441 | 65.8 | -3.2 | 8.81 | -16.9 | 22.9 | 14.5 | 3.10 | 6.5 |
| 69 | TWA 27 | 0.62 | 9.0 | 0.67 | 9.1 | … | … | 2.79 | -10.6 |
| 76 | V1146 Sco | 0.84 | -4.1 | 1.09 | -5.6 | 0.52 | 20.5 | 2.93 | 18.9 |
| 78 | RY Lup | 61.8 | 22.1 | 47.9 | -4.1 | 21.5 | 5.9 | 86.2 | 4.1 |
| 79 | V1154 Sco | 2.76 | -13.9 | 5.42 | 0.0 | 2.28 | -13.8 | 10.4 | 43.2 |
| 81 | V1157 Sco | 0.15 | -13.0 | 0.19 | 12.8 | 0.27 | 28.5 | 0.96 | -11.8 |
Note. — The flux values are in units of erg .
| Equation | Best Fit | 1:1 FitwwThe 1:1 fits have the slope of the lines, , fixed at 1. | xx is the Pearson linear correlation coefficient. The associated false-alarm probability is zero, except that it is 0.38 for and . | ||||
|---|---|---|---|---|---|---|---|
| yyMedian scatter in dex in the data from the linear fit. | a | ||||||
| zzAll the luminosities are in units of solar luminosity. | -2.766 | 0.877 | 0.60 | -2.609 | 0.56 | 0.84 | |
| 1.059 | 1.023 | 0.19 | 0.960 | 0.20 | 0.97 | ||
| -1.670 | 0.836 | 0.38 | -1.433 | 0.47 | 0.85 | ||
| CTTS: | -1.508 | 0.673 | 0.22 | -0.223 | 0.57 | 0.78 | |
| WTTS: | 0.609 | 1.232 | 0.19 | -0.509 | 0.26 | 0.93 | |
| CTTS: | -0.677 | 0.877 | 0.45 | -0.197 | 0.41 | 0.77 | |
| -1.632 | 0.760 | 0.46 | -0.888 | 0.46 | 0.80 | ||
| WTTS: | -0.308 | 0.968 | 0.39 | -0.141 | 0.37 | 0.76 | |
| -2.312 | 0.623 | 0.25 | -0.608 | 0.28 | 0.78 | ||
| CTTS: | -0.406 | 0.826 | 0.50 | 0.389 | 0.49 | 0.77 | |
| -2.323 | 0.766 | 0.48 | -1.678 | 0.49 | 0.80 | ||
| WTTS: | 2.436 | 1.354 | 0.19 | 0.407 | 0.32 | 0.91 | |
| -3.190 | 0.564 | 0.13 | -1.197 | 0.35 | 0.89 | ||
| 0.349 | 1.161 | 0.15 | -0.363 | 0.23 | 0.98 | ||
| -0.409 | 1.010 | 0.14 | -0.450 | 0.14 | 0.98 | ||
| -0.321 | 1.051 | 0.17 | -0.542 | 0.18 | 0.98 | ||
| -0.932 | 0.853 | 0.14 | -0.278 | 0.22 | 0.97 | ||
| … | … | … | … | … | 0.21 | ||
| Bandpass | TW Hya | AU Mic |
|---|---|---|
| -0.77 | -0.89 | |
| (912–2000) | -2.52 | -4.77 |
| (1250–1700) | -2.73 | -5.18 |
| -4.18 | -5.39x | |
| -3.33 | – | |
| -2.34 | -4.56x | |
| 912–1000 | -4.08 | -5.91 |
| C III | -4.61 | -6.39 |
| 1000–1100 | -3.95 | -5.68 |
| O VI | -4.62 | -6.15 |
| 1100–1200 | -3.89 | -5.89 |
| C III | -4.49 | -6.23 |
| 1200–1300b | -3.47 | -5.80 |
| Ly | -1.95z | -4.49y |
| 1300–1400 | -3.43 | -5.75 |
| C II | -4.45 | -6.15 |
| 1400–1500 | -3.57 | -6.19 |
| 1500–1600 | -3.21 | -5.71 |
| C IV | -3.54 | -5.92 |
| 1600–1700 | -3.31 | -5.72 |
| He II | -3.85 | -6.04 |
| 1700–1800 | -3.31 | -5.86 |
| 1800–1900 | -3.29 | -5.67 |
| 1900–2000 | -3.37 | -5.89 |
| 2000–3000 | -2.23 | -4.22 |
| Mg II | -3.41 | -4.98 |
| aLuminosities in ; bExcluding Ly; | ||
| xBrowning et al. [20]; yWood et al. [120]; | ||
| zHerczeg et al. [56]. | ||