Measurements of the strong-interaction widths of the kaonic 3He and 4He levels
Abstract
The kaonic 3He and 4He X-rays emitted in the transitions were measured in the SIDDHARTA experiment. The widths of the kaonic 3He and 4He states were determined to be and respectively. Both results are consistent with the theoretical predictions. The width of kaonic 4He is much smaller than the value of eV determined by the experiments performed in the 70’s and 80’s, while the width of kaonic 3He was determined for the first time.
Keywords:
kaonic atoms , low-energy QCD , antikaon-nucleon physics , X-ray spectroscopyPACS
36.10.k , 13.75.Jz , 32.30.Rj , 29.40.Wk1 Introduction
The X-ray measurements of the kaonic helium isotopes (3He and 4He) play an important role for understanding low-energy QCD in the strangeness sector. The measurements of kaonic 4He X-rays performed in the 70’s and 80’s introduced a serious problem; i.e., inconsistency between theory and experiment both in the shift and width of the kaonic 4He state.
The shift measured in the 70’s and 80’s [1, 2] was eV on average, whereas theoretical calculations gave a shift below 1 eV based on kaonic atom data with atomic numbers [2, 3, 4]. This discrepancy between theory and experiment was known as the “kaonic helium puzzle”.
New results of the kaonic 4He shift were recently obtained by the E570 [5] and SIDDHARTA [6] experiments with a precision of a few eV. In addition, the shift of the kaonic 3He state was determined by the SIDDHARTA experiment for the first time [7]. The level shifts both of kaonic 3He and 4He were found to be at most a few eV. Thus, the “kaonic helium puzzle” of the shift was resolved.
Theoretically, a value of the widths of the states of eV was estimated both for kaonic 3He [4] and 4He [1, 2, 4].
Experimentally, however, the width of the kaonic 4He state was not well determined, leaving the situation unclear. The results for the widths of eV [8], and eV [1], with an average of eV were reported by two groups, along with the following comment on their results [1]. “The shift measurements are seen to be in good agreement. The situation for the width values is much less satisfactory and the error bars of the two measured values do not overlap. The error on the quoted average has been taken from the external variance of the measured values.”
This discrepancy between measured width values and theory for the kaonic 4He is clarified by our measurement. We performed as well the first measurement of kaonic 3He with a similar precision.
2 The SIDDHARTA experiment
The kaonic helium X-rays were measured in the framework of the SIDDHARTA experiment performed at the DANE electron-positron () collider [9]. The (1020) resonance was produced at rest by the collisions at the interaction point. The back-to-back correlated charged kaon pairs () from the decay were detected by the two scintillators mounted above and below the interaction region of the beam pipe (“kaon detector”). The coincidence signals of the pairs were used for the timing selection of X-ray events. Cryogenic gas was used as a target. A cylindrical target cell made of Kapton foils was filled with He gas. In the top of the cell, thin Ti and Cu foils were installed for the energy calibration.
X-rays were detected by large-area (1 cm2) silicon drift detectors (SDDs). The SDDs, with a total area of 144 cm2, were installed around the target cell. The main background source at DANE was charged particles scattered from the beams which were uncorrelated with the coincidence. Thus, event selections using timing both of the coincidence in the kaon detector and the X-ray hits on the SDDs suppressed background by about four orders of magnitude.
For details on the setup and experimental method we refer to [10], where the result of the kaonic hydrogen measurement was reported.
The data of kaonic 4He measured in two periods (for one day each), and the data of kaonic 3He measured for four consecutive days in the 2009 data taking were used to extract the widths. Note that the data used for the shift determination in [7] were reanalyzed to determine the strong-interaction width.
3 Data analysis
Calibration data were taken every several hours, by inserting Ti and Cu foils and an X-ray tube below the setup to increase X-ray production rates. The energy scale of the X-ray data was calibrated for each SDD using the peak positions of the Ti K (4.5 keV) and the Cu K (8.0 keV) lines. The data were selected for further analysis in terms of the quality of stability, energy resolution and X-ray peak shapes.
In-beam data were categorized on the basis of timing with respect to the kaon trigger. The events with the kaon trigger are used for the analysis of kaonic atom X-ray signals, while those without the kaon trigger are used for the analysis of the energy scale and resolution of the SDDs.
An energy spectrum of the data taken with beam collisions is shown in Fig. 1, where the events without the kaon trigger were selected. The background events originating from the beams are seen as a continuum. In addition, small peaks of the Ti K, Cu K, and Au L lines are seen at 4.5, 8.0, and 9.6 keV. The Ti and Cu lines originated from the foils installed inside the target cell, while the Au lines were from materials in the support structures of the SDDs.

The accuracy of the energy scale was examined using the X-ray energies of the Ti K, Cu K and Au L lines. The intensities of these X-ray lines in the kaonic helium data were not high enough to observe systematic effects on the energy calibration and energy resolution of the SDDs, so the data measured with the deuterium target, which were taken for about 20 days, were also analyzed using the same method.
The X-ray peaks were fitted with a Voigt function: , which is a convolution of Gaussian and Lorentzian functions. The values of and represent the width of Gaussian and Lorentzian , respectively. The detector response function was assumed to be Gaussian, and the natural linewidth was represented by the Lorentzian function. In the fit, the Voigt function was calculated using the algorithm given in [11].
The intensity ratio, energy difference, and natural linewidths of the fine structure between the and lines were fixed in the fit, where the values given in [12, 13, 14] were used.

Figure 2 shows the peak positions of the Ti K (4.5 keV), Cu K (8.0 keV), and Au L (9.6 keV) lines, where they are plotted separately for different target materials: open circle (deuterium), filled circle (3He), and cross (4He). The vertical axis gives the difference between the fit values and the reference data. The variation of eV seen in the figure corresponds to the uncertainty of about channels in the analogue-to-digital converters (ADCs) used in the measurements. The variation could be related to the non-linearity of ADCs. Thus, the uncertainty of eV is taken as a systematic error in the energy determination.
The energy dependency of the energy resolution of the SDDs was evaluated from the peak widths. Figure 3(a) shows the fit values of the Gaussian width in the Voigt function against the X-ray energy , where the data of all the target materials were used. The peak positions of the Ti K (4.5 keV), Cu K (8.0 keV), and Au L (9.6 keV) lines are plotted. The value of at the X-ray energy can be expressed as:
| (1) |
using free parameters and . In Fig. 3(a), the fit curve using the function (1) is shown as a solid line and, as well, the root-mean-square error of the fit as dotted lines.

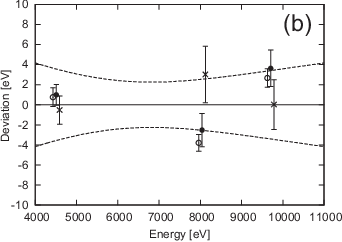
The deviations from the fit line are plotted for each target material separately in Fig. 3(b): open circle (deuterium), filled circle (3He), and cross (4He). The curves show the error of the determination of the values. Since all the positions are located within the error curves, the error is taken as the accuracy of the determination of the detector resolution for the fit of the kaonic helium X-rays. The energy resolutions () at the X-ray energy of the kaonic helium transitions were determined to be : for kaonic 3He, and for kaonic 4He.
In addition to the X-ray energy data, the time difference between the kaon coincidence and X-rays was measured, as well as the kaon time-of-flight of the kaon detector. The X-ray events were selected using this timing information, to obtain a good signal-to-background ratio in the energy spectra of kaonic atom X-rays without reducing their statistics [7, 10].

The energy spectra of the kaonic 3He and 4He X-rays are shown in Figs. 4(a) and (b), where the thin lines show the peak fit functions after the background subtraction. The peaks at 6.2 keV and 6.4 keV are the kaonic 3He and 4He transitions, respectively. Figure 4(c) shows the X-ray energy spectrum using the deuterium target, where the signals from the kaonic deuterium X-rays are not visible. The upper limit of the observation of kaonic deuterium will be reported elsewhere [15].
In addition to kaonic helium, several small peaks were observed in all the spectra, which originated from kaonic atom X-rays produced in the target window material made of Kapton Polyimide (), since some kaons are stopped there. The X-ray peaks at 5.5, 6.0, and 7.6 keV are the kaonic carbon (C) , oxygen (O) , and nitrogen (N) transitions, respectively.
In these transitions, the shift and broadening due to the strong-interaction are negligibly small [16]. Thus, their peak positions can be calculated using the QED effect only, as shown in Table 1. The energy shift caused by the vacuum polarization effect was obtained using the formula given in [17], where the first order of the Uehling potential was taken into account. For the transition (C ), the formula given in [18] was used. The contribution from higher order corrections is estimated to be within 0.2 eV.
| Target | Transition | Energy (eV) |
|---|---|---|
| C | 5510 | |
| C | 5545 | |
| O | 6007 | |
| 3He | 6225 | |
| 4He | 6463 | |
| Al | 7151 | |
| N | 7595 |
On the other hand, a small shift and a small width could be expected for the kaonic helium states, due to the strong-interaction between the kaon and helium, whereas they are negligible in the states. The energy shift and broadening of the transition can be obtained from the peak fit using a Voigt function: , where represents the strong-interaction width. Due to a strong parameter correlation between the values of and in the fit, the value of was fixed using the value obtained from equation (1).
The determined width of kaonic 3He state is:
| (2) |
and the width of kaonic 4He state is
| (3) |
Here, the systematic error was evaluated from the uncertainty of the resolution . In addition, since the kaonic 3He X-ray peak partially overlaps the O transition, the systematic error of the width of kaonic 3He includes the uncertainty of its intensity. Other contributions are small compared to the assigned systematic errors.
Note that the shifts are the same as the values reported in [7]: for kaonic 3He, and for kaonic 4He.
4 Conclusion and discussion
In conclusion, the strong-interaction widths both of the kaonic 3He and 4He states were measured by the SIDDHARTA experiment, where kaonic 3He was measured for the first time. The width of kaonic 4He was found to be much smaller than the value of eV determined in the experiments performed in the 70’s and 80’s [1, 2]. The strong-interaction level widths both of kaonic 3He and 4He are in good agreement with the theoretical estimated values of 1-2 eV [1, 2, 4]. No abnormally large widths were found either in kaonic 3He or 4He.
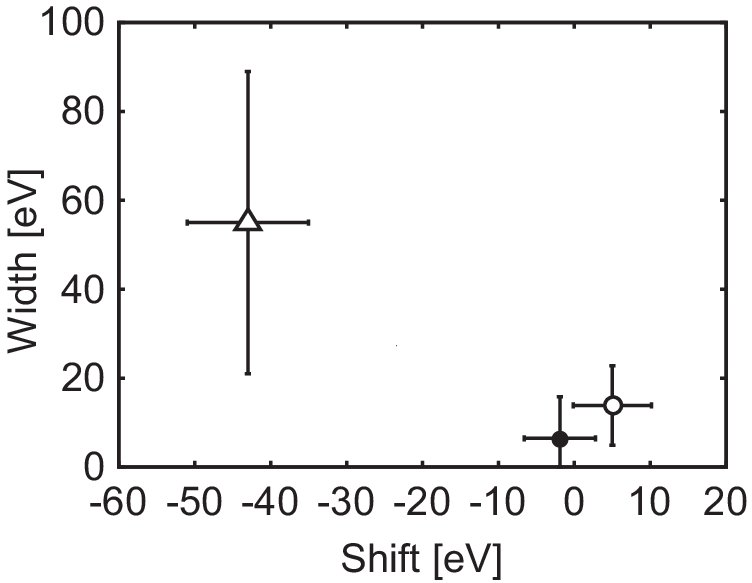
Combined with the results of the shift values determined in [7], the correlations of the shift and width values of the kaonic 3He and 4He states are plotted in Fig. 5, together with the average value reported in [1, 2], where the error bars were calculated by adding the statistical and systematic errors quadratically. Clearly, the new results gave significantly smaller values both for the shift and width.
Presently, an upgrade of SIDDHARTA, SIDDHARTA-2, is under way in order to perform the kaonic deuterium measurement. In the framework of SIDDHARTA-2 we plan as well to challenge the difficult measurements of kaonic 3He and 4He transitions to the level.
Acknowledgments
We thank C. Capoccia, G. Corradi, B. Dulach, and D. Tagnani from LNF-INFN; and H. Schneider, L. Stohwasser, and D. Stückler from Stefan-Meyer-Institut, for their fundamental contribution in designing and building the SIDDHARTA setup. We thank as well the DANE staff for the excellent working conditions and permanent support. Part of this work was supported by HadronPhysics I3 FP6 European Community program, Contract No. RII3-CT-2004-506078; the European Community-Research Infrastructure Integrating Activity “Study of Strongly Interacting Matter” (HadronPhysics 2, Grant Agreement No. 227431), and HadronPhysics 3 (HP3), Contract No. 283286 under the Seventh Framework Programme of EU; Austrian Federal Ministry of Science and Research BMBWK 650962/0001 VI/2/2009; Romanian National Authority for Scientific Research, Contract No. 2-CeX 06-11-11/2006; the Grant-in-Aid for Specially Promoted Research (20002003), MEXT, Japan; the Austrian Science Fund (FWF): [P20651-N20]; and the DFG Excellence Cluster Universe of the Technische Universität München.
References
- [1] S. Baird, et al., Nucl. Phys. A 392 (1983), p. 297
- [2] C. J. Batty, Nucl. Phys. A 508 (1990), p. 89
- [3] The DEAR Collaboration, S. Bianco, et al., La Rivista del Nuovo Cimento 22 (1999), p. 1.
- [4] E. Friedman, Proc. Inter. Conf. on Exotic Atoms (EXA11), Hyp. Intrer. DOI: 10.1007/s10751-011-0515-1, arXiv:1111.7194v1 [nucl-th]
- [5] S. Okada et al., Phys. Lett. B 653 (2007), p. 387
- [6] SIDDHARTA Collaboration (M. Bazzi et al.), Phys. Lett. B 681 (2009), p. 310
- [7] SIDDHARTA Collaboration (M. Bazzi et al.), Phys. Lett. B 697 (2011), p. 199
- [8] C.J. Batty, et al., Nucl. Phys. A 326 (1979), p. 455
- [9] M. Boscolo, et al., Nucl. Inst. Meth. A 621 (2010), p. 121
- [10] SIDDHARTA Collaboration (M. Bazzi et al.), Phys. Lett. B 704 (2011), p. 113
- [11] R.J. Wells, J. Quant. Spectrosc. Radiat. Transfer 62 (1999), p. 29
- [12] C. T. Chantler, et al., Phys. Rev. A 73 (2006) 012508
- [13] G. Hölzer, et al., Phys. Rev. A 56 (1997) 4554
- [14] G. Zschornack, Handbook of X-ray Data, Springer-Verlag, Berlin (2007).
- [15] SIDDHARTA Collaboration (M. Bazzi et al.), in preparation.
- [16] E. Friedman, A. Gal, and C.J. Batty, Nucl. Phys. A 579 (1994) p. 518
- [17] S.G. Karshenboim, et al.. Can. J. Phys., 84 (2006), p. 107.
- [18] S.G. Karshenboim, et al., Eur. Phys. J. D 39 (2006), p. 351.