Cosmic dust in Mg ii absorbers
Abstract
Mg ii absorbers induce reddening on background quasars. We measure this effect and infer the cosmic density of dust residing in these systems to be , in units of the critical density of the universe, which is comparable to the amount of dust found in galactic disks or about half the amount inferred to exist outside galaxies. We also estimate the neutral hydrogen abundance in Mg ii clouds to be , which is approximately 5% of hydrogen in stars in galaxies. This implies a dust-to-gas mass ratio for Mg ii clouds of about , which is similar to the value for normal galaxies. This would support the hypothesis of the outflow origin of Mg ii clouds, which are intrinsically devoid of stars and hence have no sources of dust. Considerations of the dust abundance imply that the presence of Mg ii absorbers around galaxies lasts effectively for a few Gyr. High redshift absorbers allow us to measure the rest-frame extinction curve to , at which the absorption by the Lyman edge dominates over scattering by dust in the extinction opacity.
Subject headings
dust – extinction – galaxies: halos – quasars: absorption lineI. Introduction
A significant amount of gas processed by stars may be ejected into interstellar space via stellar winds and supernova explosions. About 30% of the metals in enriched gas would condense to form dust grains [36]. The total amount of dust in the Universe that is produced in stellar evolution in the entire cosmic time was estimated from integrated star formation rate by Fukugita [9] to be , in units of the present-day critical mass density. This value is a few times higher than the amount of dust observed in galactic disks [8, 7], which motivated us to explore the fate of the remaining amount.
Evidence for the existence of dust beyond galactic disks has observationally been suggested by a few authors. From the study of a low-redshift foreground/background galaxy superposition Holwerda et al. [11] detected dust extinction up to about five times the optical extent of spiral galaxies. Using deep Herschel observations of M82, Roussel et al. [28] showed that emission from cold dust can be traced up to 20 kpc from the centre of the galaxy. Recently, Ménard et al. [17, hereafter MSFR] measured the cross-correlation between the colors of distant quasars and foreground galaxies as a function of the angular separation to galaxies, and concluded an excess reddening signal on scales ranging from 20 kpc to a few Mpc, implying the existence of a appreciable amount of dust in intergalactic space. Using this observational result, Fukugita [9] showed that the summed contributions of dust in and outside galaxies appear to be in agreement with the total amount of dust ought to be produced in the Universe. This implies that dust destruction does not play a major role in the global dust distribution and that most of the intergalactic dust survives over the cosmic time.
In this paper we pursue another line of observations and show that a significant amount of dust resides in galactic halos and possibly beyond: we use Mg ii absorbers to find dust contained therein. Mg ii is the most commonly detected absorption line from cool gas ( K) at in the optical spectra of distant sources. Strong Mg ii absorbers, conventionally defined with a rest equivalent width , are associated with a range of galaxies with [3, 32, 30, 22] and are found at impact parameters ranging up to 100 kpc [30, 31, 39]. While the physical mechanisms for the origin of these gas clouds are yet to be understood, most Mg ii absorbers seem to reside in galactic haloes.
The use of absorbers offers an attractive property: the knowledge of the absorber incidence allows us to infer the cosmic mass density of dust contained in these systems without further assumptions on their spatial distribution. Mg ii absorbers can hence be used to obtain a robust lower limit on the amount of baryons and dust residing outside galactic disks up to the halo radius, over the redshift range . In general, it is widely believed that Mg ii absorbers do not host star forming regions and hence no source of dust grains. The presence of dust in these clouds would serve as an indicator to distinguish whether Mg ii absorbers predominantly are aggregates of pristine gas or are of secondary products from activities of nearby galaxies. Characterizing and understanding its distribution is therefore an important task. The use of absorbers also allows us to infer the neutral hydrogen abundance in Mg ii clouds. These pieces of information concerning the ingredients of the clouds would lead us to infer properties of Mg ii absorbers, and then the nature and the formation of these systems. At the same time this study enables us to explore the feature of the extinction curve to the short wavelength due to the high redshift nature of clouds, even to beyond the Lyman limit, using optical and UV data currently available.
Our basic data are taken from the SDSS (York et al. 2001) but are supplemented with UV photometry of the Galaxy Evolution Explorer (GALEX; Martin et al. 2005). We use km s-1Mpc-1 and in a flat Universe.
II. Expected optical and UV absorption by Mg ii absorbers
Metal-enriched gas causes extinction of light from UV to near infrared passing through intergalactic matter due to absorption and scattering by dust grains. In the far UV region we also anticipate that ionisation and excitation of hydrogen atoms lead to an attenuation of light. This is usually not addressed in the context of dust extinction observed in optical wavelengths. In a similar manner excitation of heavy elements may also contribute to the extinction opacity.
We write the optical depth for extinction as
| (1) |
where is the hydrogen cross section, is the dust extinction cross-section per hydrogen atom for a given population of dust grains denoted by , accounts for variations in the dust-to-gas ratio, is the metal excitation cross section11 1 We neglect the effect of line saturation at this stage. and is the metallicity in the ratio of numbers of atoms.
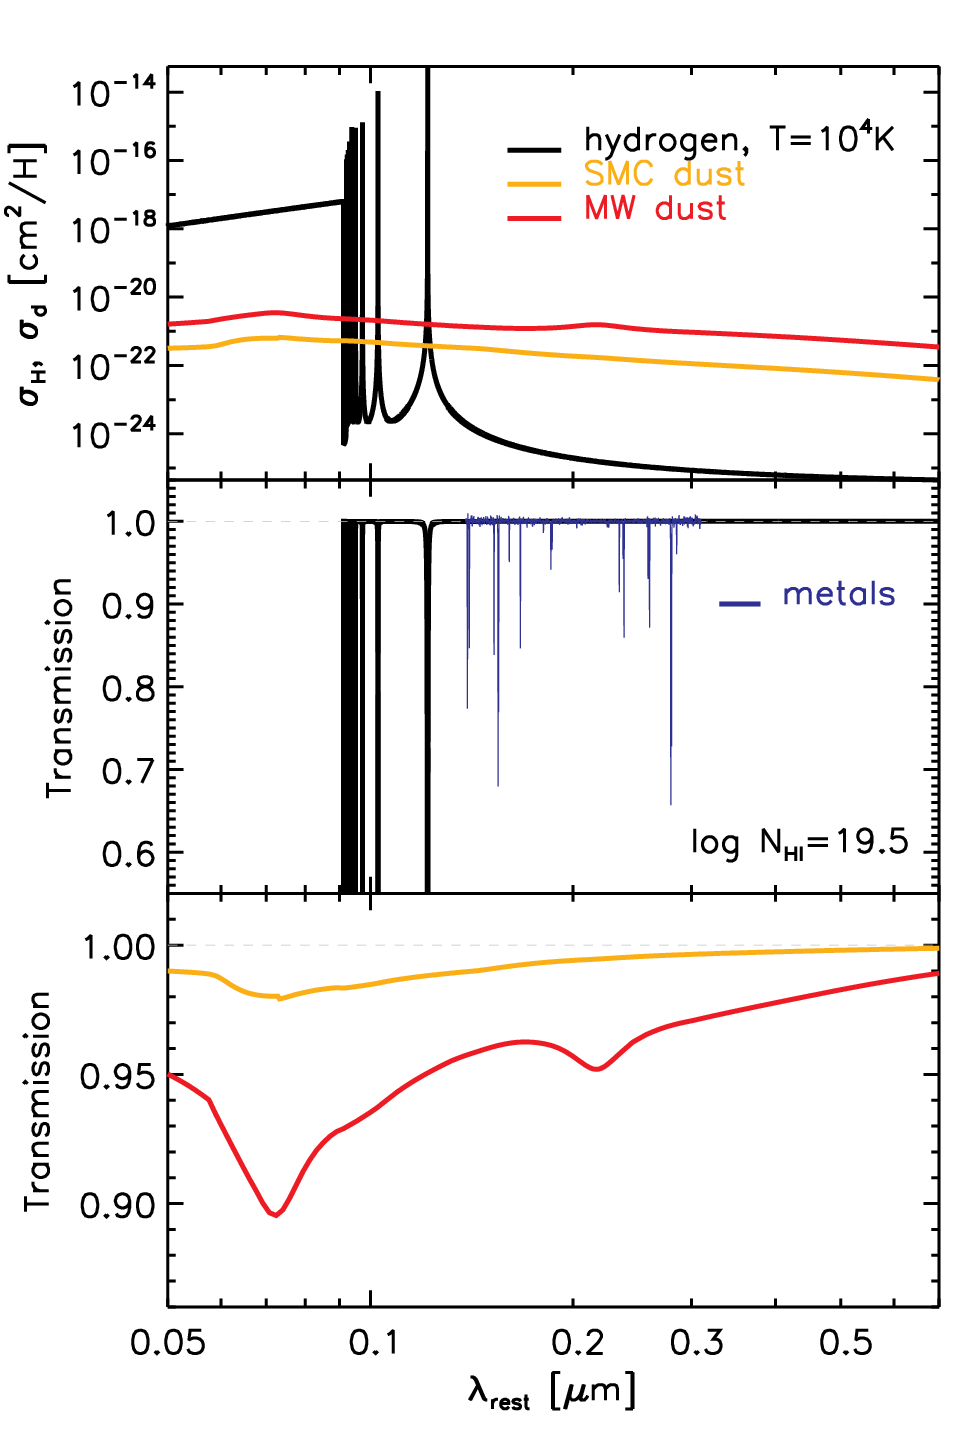
Figure 1 indicates the cross-sections as a function of wavelength from the UV to the optical regime in (a), and the representative transmission for a cloud with hydrogen column density in (b) and (c). Dust models for the Milky Way and the SMC are adopted from Weingartner & Draine [36]22 2 Data for these models are taken from http://www.astro.princeton.edu/draine/dust/dustmix.html . These models, consisting of mixture of carbonaceous grains and astronomical silicate grains, reproduce the observed extinction curves from the ultraviolet to the near infrared in the Milky Way and Magellanic Clouds. They are normalized such that and , respectively, where stands for extinction in the band. The hydrogen cross-section is shown for gas at a temperature K, but other choices do not modify the resonant feature qualitatively33 3 We thank Jens Chluba for providing us with estimates of the hydrogen cross-section.. There are humps at m and m in the dust extinction curve caused by carbonaceous grains, though they are squeezed to a barely recognizable level in the top panel of the figure due to the broad logarithmic scale.
The transmission shown in the lower panels of Figure 1 assumes the neutral hydrogen column density , which corresponds roughly to the median column density of Mg ii absorbers with [19]. Equation 1 shows that we can obtain, in principle, information on and from the brightness of a source located behind such a cloud. The figure shows that atomic excitation not only at the Lyman edge but also in the Lyman region is a source of optical depth. A cloud of this hydrogen column density is completely opaque at wavelengths shorter than the Lyman limit, Å. At longer wavelengths the optical depth is , which is dominated by dust extinction. A drop at 2175Å is seen in the transmission through Milky Way type dust.

We show an example of extinction for observations conducted with broad band filters in Figure 2. The upper panel shows the attenuation of the flux induced by SMC-type dusty gas of hydrogen column density cm-2, as a function of redshift for the SDSS () and GALEX (NUV, FUV) passbands. Individual contributions are shown in the lower panels: (b) hydrogen, (c) metal lines, and (d) dust grains. The seven passbands are denoted by different colours, as specified in the legend of the figure. Lyman-edge absorption dominates in the FUV, NUV and bands above redshifts 0.5, 1 and 2.5, respectively, as seen when one compares (a) and (b).
We include atomic excitations from metal lines using a composite absorption spectrum for Mg ii clouds. 44 4 We thank Guangtun Zhu for his help in creating the metal-line composite spectrum. The total contribution to the absorption opacity, which is dominated by Mg ii, Fe ii and C iv lines, can be comparable to that of Lyman-. The 0.01 mag hump seen in the band at is due to Lyman line absorption and the feature at is due to absorption by metals lines. The Lyman absorption is also seen in the FUV and NUV passbands, although the feature is somewhat weakened in NUV due to its larger width of the bandpass (). At we see that Lyman edge absorption becomes stronger in the NUV than the FUV band. This causes a blueing effect in these bands. Similarly, this is expected for the NUV color at .
Absorption due to metal excitation is also visible in the curves for passbands. We see that metal excitation increases the extinction opacity from dust alone by as much as 5 times in the relevant wavelength range in all optical passbands. With the inclusion of metal excitation opacity the extinction curve is not always monotonic, and the colour indices receive occasionally blueing for some wavelength ranges rather than reddening, with an amplitude of the order 0.01 magnitude.
Choosing Milky Way type dust in our demonstration would increase the contribution from dust opacity by the relative ratio, i.e. by roughly a factor 8. Here, our choice of the SMC type dust is motivated from the fact that it fits the extinction spectrum of Mg ii absorbers better, especially at short wavelengths Å, that is important to our consideration, and for the absence of the 2175 feature [38]. When interpreting observations we leave, however, the dust-to-gas ratio as a free parameter, rather than fix it to the actual SMC value. This ratio is constrained from both shape of the extinction curve, for extinction is caused by both Lyman edge absorption and dust scattering, and amount of dust and HI gas associated with Mg ii absorbers.
Previous analyses based on optical data have constrained the amount of dust in intervening Mg ii absorbers by statistically measuring color changes they induce on background sources [38, 18, 6]. Here we extend to the UV, which enables us to obtain information also on the amount of neutral hydrogen associated with Mg ii absorbers.
III. Analysis for Mg ii absorbers
III.1. Data
The SDSS (York et al. 2001) provides us with the basic data set for the present analysis. Nestor et al. [21] constructed a catalogue of Mg ii absorbers using its EDR data base [33], and Quider et al. [25] extended it to the DR4 dataset [1]. Quider et al. [25] analyzed about 45,000 quasar spectra and identified about 17,000 Mg ii absorbers. Nestor et al. [21] estimated that the redshift path covered by the survey drops to about 50% for absorbers with the rest-system equivalent width Å. While completeness is not an important issue in our analysis, we restrict our study to the sample of absorbers with Å. We do not include absorption lines located close to the edges of the spectra and restrict the Mg ii absorber redshift distribution to . It is known from studies of absorber-galaxy pairs (e.g., Steidel et al. 1994) that MgII absorber is unlikely to be a part of galactic disks, but are placed substantially away from galaxies.
About 70% of the SDSS quasars are observed by GALEX (Martin et al. 2005). Budavari et al. (2009) cross-matched the SDSS-DR7 catalog with the GALEX-GR4/5 taking a matching radius of 4′′. Using this cross-identification, we can find 11,929 Mg ii absorption systems satisfying our rest equivalent width and redshift selections and for which UV observations of the background quasars are available. This constitutes the prime sample of our analysis.
III.2. Dust extinction

To detect dust in Mg ii absorbers we measure reddening in broad band brightness correlated with the presence of absorption systems in quasar spectra. For each quasar with a detected Mg ii absorber we select four nearest neighbour quasars in redshift–-band magnitude space and take them to be reference quasars. The high density of points in this space allows us to find reference quasars within a brightness difference typically smaller than 0.1 mag in the -band. We then compute a median colour excess and estimate its error by bootstrapping the absorber sample.
Figure 3 shows the reddening due to all Mg ii absorbers with Å as a function of redshift. For six colours, FUV, NUV, , , and , the solid curves show the expected reddening including hydrogen absorption for log with SMC-type dust but with a dust abundance lowered by a factor 6, corresponding to a dust-to-gas mass ratio of about 1/108 Our reddening estimation also includes absorption from metal lines. The overall agreement is good: the deviations from the theory curve are of the order of a few percent except for some specific case, which we discuss below. This indicates that the hydrogen column density and dust to gas ratio we used here are roughly correct without further adjustment. We note that attenuation in is a very small quantity, with an amplitude smaller than mag. Interestingly, the broad-band photometric data indicates the presence of absorption lines, as shown by the bumps at and for the and colours. The small offsets (of order 0.005 magnitude) between observations and the modelled colours might be due to variations in the metal lines as a function of redshift.
We note that if we would take the MW type dust, instead of the SMC type dust, we cannot reproduce colour excess shown in Figure 3, notably in the for and for . This is consistent with what has been found in York et al. (2006), and compel us to adopt the SMC type extinction for Mg ii absorbers.
In the FUV quasars behind a hydrogen column density with log are usually not detectable by GALEX. The colour excess can only be measured for lower column density absorbers. We also show in figure 3 expected reddening for both absorbers with a column density somewhat above the Lyman limit: log , as dashed lines. The overall shape of the extinction shows that this selection effect is well reproduced.
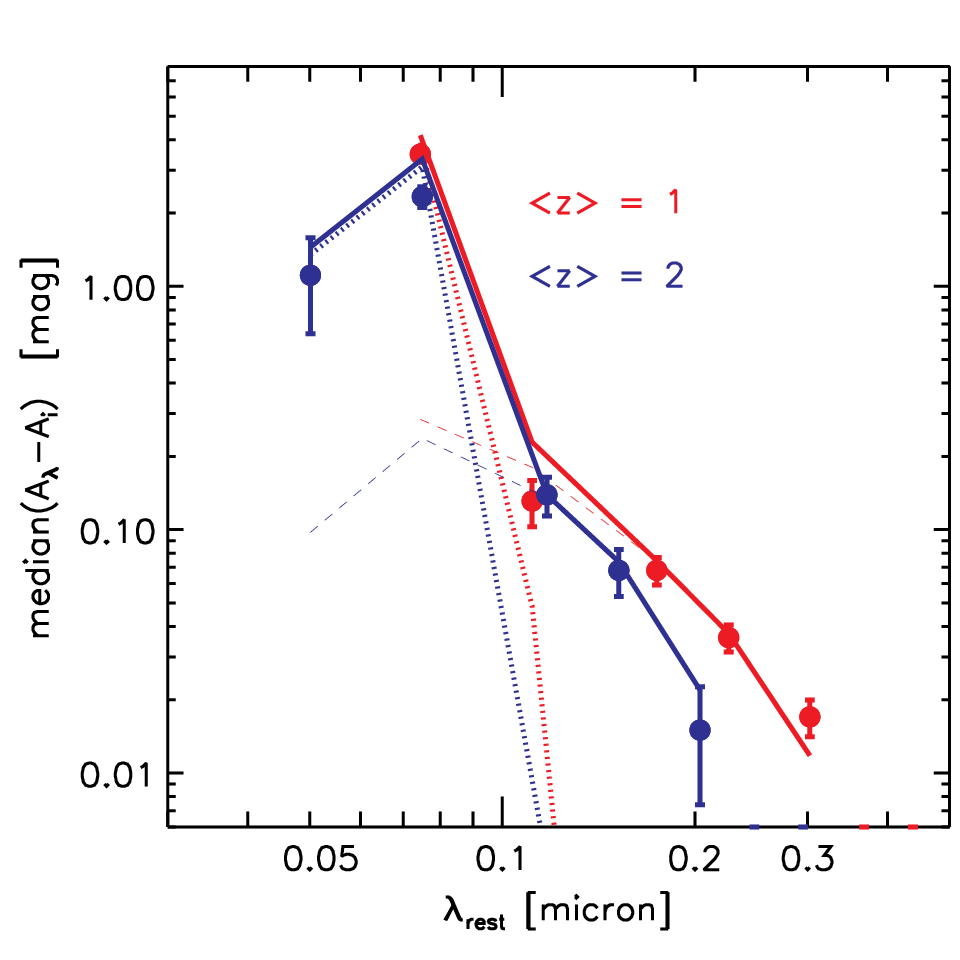
Figure 4 presents the extinction curve derived from our Mg ii sample (data points) at two redshifts, compared with the one (thick solid curve) expected from a sum of the dust extinction curve (dashed curve) taken from Weingartner & Draine [36] and hydrogen Lyman edge excitation (dotted curve). The curve assumes SMC type dust for hydrogen column density cm-2 with the dust-to-gas ratio 1/108. For the hydrogen excitation the hydrogen column density is assumed to be cm-2, consistent with Figure 3, avoiding the transmission being completely opaque. They are close to the case observed for our sample, as seen above. The figure shows that the SMC extinction curve gives observed extinction with Mg ii absorbers correctly for m: extinction at shorter wavelengths is properly given by Lyman edge absorption.
Let us focus on dust extinction. The above figure shows that over the redshift range extinction in the FUV, NUV and band is sensitive to hydrogen absorption. In order to probe the effect of dust reddening we consider the colour. Redder colours are more affected by metal line absorption. We measure the median colour excess as a function of the absorber redshift with the sample divided into rest equivalent width bins, with the results shown in Figure 5. The global variation can be fit with
| (2) |
where , , and the reduced of 0.6. We use this reddening measurement to infer the cosmic density of dust in Mg ii absorbers. Since (see equation (15) below), this result is consistent, if marginally, with , an expected result, when we take the fact that the relation has a large scatter into account.

This may be taken to be a lower limit on reddening induced by Mg ii absorber systems taking into account the possibility that some highly obscured quasars might be dropped out of the sample. Budzynski & Hewett (2011) estimated from SDSS quasar spectra that about 20% of Mg ii absorbers are missed due to large obscuration.
IV. The mass density of dust
borne by Mg ii clouds
The comoving density of a population can be written
| (3) |
where is the cross section of the system, is the number intersected in the interval , and the absorbing distance is given by
| (4) |
with being the Hubble constant at redshift . The comoving number density of the population is then
| (5) |
A similar relation is derived for the cosmic mass density. We can write the mass density of dust in Mg ii absorbers as
| (6) |
where is the surface dust-mass density of Mg ii absorbers. In units of the present-day critical density ,
| (7) |
We note that this estimate of does not require the knowledge of the spatial distribution of Mg ii absorbers around galaxies, so that we obtain a lower limit on without further knowledge on the distribution of clouds.
The amount of extinction is related to the surface density of dust as,
| (8) |
where is the extinction-to-dust-mass coefficient evaluated at the band wavelength,
| (9) |
with being the mass density of each species, the extinction cross section of dust in the band per hydrogen atom, the mean molecular weight of gas, and the hydrogen mass. The value of is given in a tabulated form for the model of Weingartner & Draine [36] at the electronic address quoted above. For SMC type dust we obtain
| (10) |
We note that Milky Way type dust leads to a dust mass larger by a factor of 1.8 at given extinction in the -band.

The cosmic mass density of dust in Mg ii absorbers is
where the incidence of Mg ii absorbers is given by Nestor et al. [21] from SDSS quasar spectra,
| (12) |
with and Å.
The integrand of Eq 6 is shown by the solid line in
Figure 6. It shows that absorber systems with
, if included, would contribute by 20% to
the mass density of dust. The integral above
Å is about 1%.
The contribution from obscured quasars may also increase the dust amount
by 20% if we take literally the effect estimated by
Budzynski & Hewett (2011).
Using Equation 6 and the measured reddening shown in figure 5 we estimate the comic density of dust carried by Mg ii absorbers as a function of redshift. The results are shown in Figure 7. We find and an indication for a slight increase from to 0.5. We also estimate using Equation 6 together with the best fit parameters for Eq. 2. The result is shown with the dashed curve. It indicates that with .
We quote as a representative value at a low redshift (),
| (13) |
As mentioned above, this provides us with a lower limit on as our analysis does not include contributions from lines of sight that (i) produce weak or no Mg ii absorption, and that (ii) intercept high column density clouds with the amount of dust that obscures the background source. We saw that dust missed for the former reason would increase the amount by approximately .
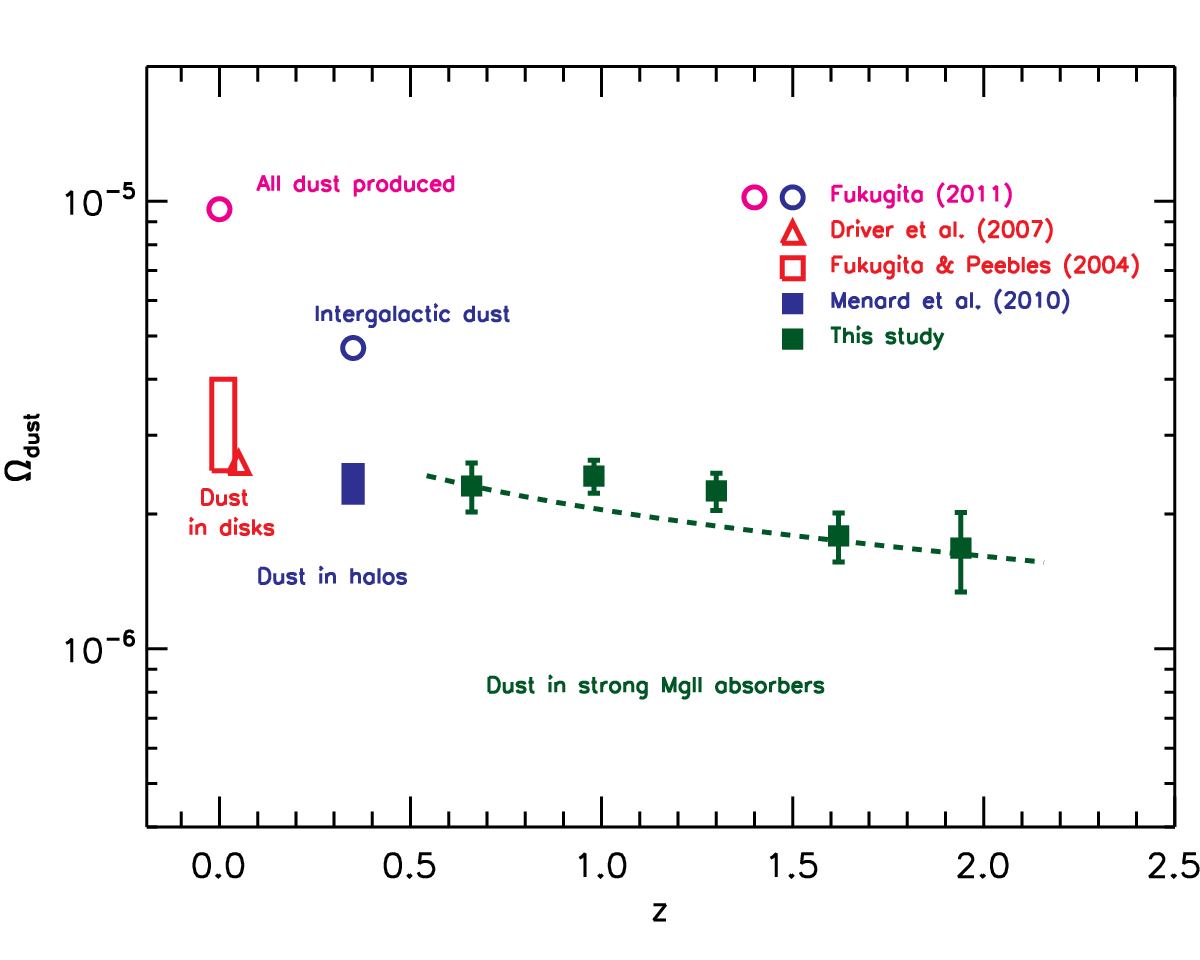
Figure 7 includes estimates of the amount of dust in the literature. MSFR give the abundance of dust within the virial radius of representative galaxies at (). Fukugita [9] estimated the dust mass density within the virial radius integrating over all galaxies assuming a typical luminosity function and that the dust amount produced is proportional to luminosity, at the median redshift of the sample they used, and also extended it to include the component outside the virial radius, which is indicated by MSFR. The latter gives , showing that the total abundance of dust is consistent with the amount ought to be produced in star forming activity in cosmic time, when added to dust in disks . It is noteworthy that the dust amount in Mg ii clouds is close to that within the virial radius of galaxies, suggesting that dust is predominantly held in Mg ii clouds within the virial radius. This is approximately 1/2 the total amount of dust expected to be spread outside galaxies. We note that the calculation of both and adopts SMC type dust and the same reddening-to-dust mass ratio.
The estimate of Fukugita & Peebles (2004) refers to dust residing in disks of local galaxies, and Driver et al. (2007) estimate the dust abundance in disc galaxies at , both indicated in the figure for comparison. This shows that the amount of dust in Mg ii absorbers is similar to that remaining in galactic discs: much is blown out of galaxies.
V. The hydrogen mass density in Mg ii absorbers
The same formalism also applies to estimate the mass density of neutral hydrogen associated with Mg ii absorbers [14]. We have
| (14) |
The neutral hydrogen column density of Mg ii absorbers has been studied by Rao, Turnshek, & Nestor [27], who compiled about 200 Lyman- measurements of Mg ii absorbers. Using this sample, Ménard & Chelouche [19] showed that the median of Mg ii absorbers is described by
| (15) |
Using this relation55 5 We remark that this gives a column density of Å clouds below the empirical threshold of star formation in galaxies derived by Kennicutt [13]. and Equations 12 & 14, we find
| (16) |
for the total sample which has median redshift 66 6 After the completion of this work we became aware that [12] derived a similar (and consistent) estimate of traced by Mg ii absorbers. . The HI abundance in Mg ii clouds may slightly decrease towards low redshift, but the change is within the error. We thus compute the global dust-to-HI ratio for Mg ii absorbers,
| (17) |
Including the mass contribution from Helium and heavier elements, it gives a dust-to-gas mass ratio of about , which is consistent with the standard value for normal galaxies including the Milky Way.
Let us compare the amount of neutral hydrogen contained in Mg ii absorbers to the cosmic density. The HIPASS HI survey with 1000 galaxies (Zwaan et al. 2003) gives
| (18) |
from the integration of the HI mass function assuming the Schechter form. The objects with are all identified with optical galaxies at least in high latitude fields where one can avoid confusions. This suggests that a smooth interpolation of HI objects is also likely to consist of the small galaxy population, rather than another population such as Mg ii clouds around galaxies, although the possibility is not excluded that it includes contributions from Mg ii clouds.77 7 For reference, the molecular hydrogen abundance from the CO survey of Keres et al. (2003) is . Fukugita & Peebles have estimated that, at the present epoch, the total cosmic density of HI amounts to
| (19) |
Our result shows that Mg ii absorbers add about a third of the neutral hydrogen amount in galactic discs and bear a fourth of neutral hydrogen amount in the Universe.
VI. Summary and implications
Large quasar samples, aided with precision photometry, have enabled us to study the dust content of Mg ii absorbers over a broad redshift range. In addition the combination of high-redshift systems and UV observations allows us to study the short-wavelength extinction properties of their dust grains, all the way to the Lyman edge.
With minimum assumptions we have estimated the cosmic density of dust borne by Mg ii clouds. At low redshift it amounts to
| (20) |
This is comparable to the amount of dust in galactic disks: (Fukugita & Peebles 2004, Driver et al. 2007).
Fukugita (2011) estimated the total amount of dust produced in the Universe to be
| (21) | |||||
This implies that the amount of dust expelled from galaxies is about . Mg ii absorbers therefore carry about 1/3 to 1/2 of the total amount of dust expelled by galaxies.
The ratio of the abundances indicates that the gas responsible for Mg ii absorption should have integrated dust for the corresponding fraction of the cosmic age: Mg ii clouds should have persisted for a time scale of order several Gyr. The overall gas distribution does not disperse too quickly and lasts effectively for a significant fraction of the cosmic age. The gas distribution traced by Mg ii absorbers should have received dust produced in nearby galaxies and integrated it at least for a few Gyr period.
In the present study we measured the shape of the extinction curve from Å, at which the absorption of Lyman edge contributes predominantly, to longer wavelengths where the opacity is characterized by dust extinction. The presence of metal absorption lines such as Mg ii and Fe ii is indicated in the broad-band brightness changes due to the presence of absorbers. Larger samples would allow detections of Lyman lines and additional UV metal lines in photometric observations.
We also estimated the hydrogen mass density borne by Mg ii cloud to be . This means that the dust-to-hydrogen mass density is of the order of , which is similar to the fraction for normal galaxies, indicating that Mg ii clouds, thought to be devoid of stars and hence have no sources of dust, cannot be aggregates of pristine gas, but are a secondary product from the activity of galaxies. This supports their outflow origin, which was indicated for star forming galaxies [23, 4] and the overall redshift dependence of star formation [20, 16]. Our effective lifetime estimate of the clouds, inferred from the abundance consideration, indicates that such clouds are not ephemeral but last for a long time, consistent with the fact known from early times that Mg ii absorbers are not only associated with star bursting galaxies but also with galaxies of any morphological types, irrespective of on-going star-forming activity [30]. Wherever stars exist, there was bursting phases in the past, and the cloud can integrate outflows.
The neutral hydrogen abundance in Mg ii clouds is 5% of the mass density of stars in galaxies, or 10% of gas shed by stars during evolution in the cosmic time, assuming the Chabrier initial mass function (Fukugita 2011). For some actively star-forming galaxy samples it is observed that a significant fraction of, sometimes as much as, the star-forming mass is outflowed (e.g., Heckman et al. 2000; Pettini et al. 2002; Veilleux et al. 2005; Rupke et al. 2005; Weiner et al. 2009). Our estimate of the neutral hydrogen abundance in Mg ii absorbers also supports these observations of outflows. The present analysis is an example of the use of dust as a tracer of mass transactions in the universe with the implication that can be derived by tracing the fate of dust.
References
- [1] Adelman-McCarthy J. K., et al., 2006, ApJS, 162, 38
- [2] Bahcall J. N., Peebles P. J. E., 1969, ApJ, 156, L7
- [3] Bergeron J., Boissé P., 1991, A&A, 243, 344
- [4] Bond, N. A., Churchill, C. W., Charlton, J. C., & Vogt, S. S. 2001, ApJ, 562, 641
- [5] Budavári, T., Heinis, S., Szalay, A. S., et al. 2009, ApJ, 694, 1281
- [6] Budzynski J. M., Hewett P. C., 2011, MNRAS, 416, 1871
- [7] Driver S. P., Popescu C. C., Tuffs R. J., Liske J., Graham A. W., Allen P. D., de Propris R., 2007, MNRAS, 379, 1022
- [8] Fukugita M., Peebles P. J. E., 2004, ApJ, 616, 643
- [9] Fukugita M., 2011, arXiv, arXiv:1103.4191
- [10] Heckman, T. M., Lehnert, M. D., Strickland, D. K., & Armus, L. 2000, ApJS, 129, 493
- [11] Holwerda B. W., Keel W. C., Williams B., Dalcanton J. J., de Jong R. S., 2009, AJ, 137, 3000
- [12] Kacprzak, G. G., & Churchill, C. W. 2011, ApJ, 743, L34
- [13] Kennicutt, R. C., Jr. 1998, ApJ, 498, 541
- [14] Lanzetta, K. M., Wolfe, A. M., & Turnshek, D. A. 1995, ApJ, 440, 435
- [15] Martin, D. C., Fanson, J., Schiminovich, D., et al. 2005, ApJ, 619, L1
- [16] Matejek, M. S., & Simcoe, R. A. 2012, arXiv:1201.3919
- [17] Ménard B., Scranton R., Fukugita M., Richards G., 2010, MNRAS, 405, 1025 (MSFR)
- [18] Ménard B., Nestor D., Turnshek D., Quider A., Richards G., Chelouche D., Rao S., 2008, MNRAS, 385, 1053
- [19] Ménard B., Chelouche D., 2009, MNRAS, 393, 808
- [20] Ménard, B., Wild, V., Nestor, D., et al. 2011, MNRAS, 417, 801
- [21] Nestor, D. B., Turnshek, D. A., & Rao, S. M. 2005, ApJ, 628, 637
- [22] Nestor D. B., Turnshek D. A., Rao S. M., Quider A. M., 2007, Ap J, 658, 185
- [23] Norman, C. A., Bowen, D. V., Heckman, T., Blades, C., & Danly, L. 1996, ApJ, 472, 73
- [24] Pettini, M., Rix, S. A., Steidel, C. C., et al. 2002, Ap&SS, 281, 461
- [25] Quider, A. M., Nestor, D. B., Turnshek, D. A., et al. 2011, AJ, 141, 137
- [26] Steidel, C. C., & Sargent, W. L. W. 1992, ApJS, 80, 1
- [27] Rao S. M., Turnshek D. A., Nestor D. B., 2006, ApJ, 636, 610
- [28] Roussel H., et al., 2010, A&A, 518, L66
- [29] Rupke, D. S., Veilleux, S., & Sanders, D. B. 2005, ApJS, 160, 115
- [30] Steidel C. C., Dickinson M., Persson S. E., 19 94, ApJ, 437, L75
- [31] Steidel, C. C., Dickinson, M., Meyer, D. M., Adelberger, K. L., & Sembach, K. R. 1997, ApJ, 4 80, 568
- [32] Steidel, C. C., & Sargent, W. L. W. 1992, ApJS, 80, 1
- [33] Stoughton, C., Lupton, R. H., Bernardi, M., et al. 2002, AJ, 123, 485
- [34] Veilleux, S., Cecil, G., & Bland-Hawthorn, J. 2005, ARA&A, 43, 769
- [35] Weiner, B. J., Coil, A. L., Prochaska, J. X., et al. 2009, ApJ, 692, 187
- [36] Weingartner, J. C., & Draine, B. T. 2001, ApJ, 548, 296
- [37] York, D. G., Adelman, J., Anderson, J. E., Jr., et al. 2000, AJ, 120, 1579
- [38] York D. G., et al., 2006, MNRAS, 367, 945
- [39] Zibetti, S., Mé2011AJ….141..137Q, B., Nestor, D. B., Quider, A. M., Rao, S. M., & Turnshek, D. A. 2007, ApJ, 658, 161
- [40] Zwaan, M. A., Staveley-Smith, L., Koribalski, B. S., et al. 2003, AJ, 125, 2842