Sub-milliKelvin spatial thermometry of a single Doppler cooled ion in a Paul trap
Abstract
We report on observations of thermal motion of a single, Doppler-cooled ion along the axis of a linear radio-frequency quadrupole trap. We show that for a harmonic potential the thermal occupation of energy levels leads to Gaussian distribution of the ion’s axial position. The dependence of the spatial thermal spread on the trap potential is used for precise calibration of our imaging system’s point spread function and sub-milliKelvin thermometry. We employ this technique to investigate the laser detuning dependence of the Doppler temperature.
pacs
37.10.Vz,37.10.Rs,37.10.TyI Introduction
In the final stages of laser cooling the motion of an atom is dominated by the random recoils of photon absorption and emission events [1, 2]. If the atom is harmonically confined, this Brownian motion [3, 4] is expected to result in a Gaussian distribution of its position and velocity [5, 6, 7]. The width of this distribution can be intuitively interpreted as temperature, which we define as the time averaged energy divided by Boltzmann’s constant for a single particle. This is a powerful notion, since many experiments require low residual kinetic energy, e.g., for precision metrology [8, 9, 10, 11, 12] or quantum computation and simulation [13, 14]. In this article we study the spatial probability density of a Doppler cooled Mg+ ion trapped in a linear radio frequency (rf) trap, confirm the expected Gaussian distribution, and demonstrate that our straightforward imaging approach enables precise thermometry, as required for a wide range of experiments.
While in the strong-binding limit the comparison of the strengths of motional sidebands allows precise temperature measurements [15, 16], in the weak-binding limit the sidebands are not resolved. In this regime, ion temperatures are usually derived from the fluorescence line shapes which are decomposed into their Lorentzian lifetime contribution and the thermal distribution [17] by fitting a Voigt function. However, this method relies on the assumption of a Gaussian thermal distribution and the separation of the lifetime and thermal widths can be accompanied by rather large uncertainties [18, 9]. Upper limits for the temperatures of cooled ions have also been obtained by measuring the (thermal) spatial distribution in early laser cooling experiments [19]. Uncertainties down to 5 mK have recently been reported [20] by means of a specifically designed Fresnel lens with high spatial resolution. A similar technique has also been applied to atoms [21]. Thermometry on large ion crystals has been performed by comparing crystal images to the results of molecular dynamics simulations [22, 23].

In this work (see also [24]), we investigate the time-averaged spatial distribution of a single Mg+ ion confined in a linear quadrupole trap and laser-cooled close to the Doppler limit. The trap is operated with weak axial dc confinement which results in an axial spatial spread considerably larger than the resolution of our imaging optics. As expected for Doppler cooling, we observe a Gaussian fluorescence distribution. By accurately calibrating both the magnification and the resolution of our imaging optics, we are able to measure accurate values of the thermal spread which allow to extract ion temperatures with sub-mK uncertainties. We employ this precise thermometry to investigate the laser detuning dependence of the Doppler temperature.
II theoretical background
We consider an ion of mass , trapped along the -axis in a harmonic potential with secular frequency , leading to motional quantum mechanical oscillator states of energy . Under the assumption that the ion’s random walk caused by the stochastic photon absorption and emission is ergodic, the single ion can be assigned a temperature which quantifies the time-averaged occupation number of the states [25] with the Boltzmann constant . The population probabilities of the states follow the distribution [25] which translates into a time-averaged spatial distribution of the ion around its mean position
| (1) |
In the evaluation of the sum we used Mehler’s Hermite polynomial formula [26]. The variance of this Gaussian is . For as appropriate for the weak binding regime we have and the root mean square (RMS) width
| (2) |

The temperature limit of a Doppler-cooled ion due to secular motion in a harmonic potential results from an equilibrium of laser-induced cooling and heating rates and is given by [27]
| (3) |
It depends on the laser detuning and the laser intensity , where and are the saturation parameter and intensity, respectively. is the natural linewidth of the optical dipole transition and takes the dipole emission pattern into account. The temperature diverges for , , and . The minimum of is obtained at a detuning of which, for small , reduces to .


III Experimental Setup
Our experimental setup is shown in Fig. 1 (see also [11]). A single 24Mg+ ion is trapped in a linear rf quadrupole trap which operates at a trap frequency MHz and generates radial rf confinement with a secular frequency MHz. The trap electrodes are surrounded by two rings with a dc voltage applied to generate axial confinement tunable from to kHz. These frequencies are measured by secular excitation with a weak external signal and can thus be controlled with an accuracy of kHz. Since , axial and radial motion are decoupled so that we can neglect radial movement in the following. Due to its zero nuclear spin, the alkali-like spectrum of 24Mg+ shows no hyperfine structure and the D1 and D2 lines constitute clean cycling transitions well suited for Doppler cooling without the need for repumper lasers. Two laser beams each stabilized in frequency and intensity address the - D2 transition near 280 nm (natural linewidth MHz [28], kW/m2). One beam is aligned along the axial trap direction. The second laser beam is slightly tilted by 14∘ against the first beam to provide radial cooling. The beams are detuned with respect to each other by kHz to avoid a stable interference pattern. The ion is imaged with a condenser lens and a microscope objective onto a single-photon camera (SPC, Quantar Mepsicron II). Because of the SPC’s limited spatial resolution of 56 m, a magnification of is chosen for the imaging system. The detector plane is digitized in pixels of 49 m size. The conversion factor between the real space object size in m and image size in pixels is calibrated accurately by measuring the distance between two simultaneously trapped ions in the imaging plane of the camera for several trapping potentials [29]. The RMS resolution of the imaging system’s point spread function (PSF) at 280 nm is m for optimal alignment. It derives from the resolution of the lens system, the resolution of the camera, and the discretization of the camera data. However it is diminished when the ion is shifted out of focus, particularly by varying laser forces, and thus becomes slightly detuning dependent. After conversion into m in object space, the RMS spot size of a recorded ion image appears as a convolution of the thermal spread with the finite PSF width . Assuming the PSF to be Gaussian, we have:
| (4) |
IV Measurement and results
IV.1 Time-averaged spatial distribution
The inset of Fig. 2 shows an image of a Mg+ ion trapped with a secular frequency kHz and cooled close to the Doppler limit of about mK (). From Eq. 2 follows a RMS spatial spread of m which is about eight times larger than the PSF of our imaging system. In this case, with Eq. 4, the PSF only contributes to the width of the image. The laser detuning is set to MHz , and the total laser intensity – with both laser intensities equal at the location of the ion – is limited to which is monitored by the observed photon scattering rate. Figure 2 shows a histogram of the axial spatial distribution obtained from the image. No statistically significant deviation from a Gaussian could be found with a fit, as can be seen from the residuals, which confirms the stochastic nature of the ion’s motion. The RMS spot size of the ion image of m is indicated by the horizontal bar, while the vertical bar shows the resolution of our imaging system.
IV.2 Spatial thermometry measurement
In order to obtain a precise value of the absolute temperature for larger oscillation frequencies as well, we need to determine more accurately. We use the fact that, according to the laws of Brownian motion, the width of the thermal distribution varies (Eq. 2). From measurements of the spot sizes for different , we obtain , , and thus the absolute temperature of the ion from a fit of Eqs. 2 and 4. This method depends on the shape of the PSF and the constancy of its width . The ion images at high secular frequencies which reflect the PSF do not show a significant deviation from a Gaussian. To ensure the constancy of its width, we readjust the imaging system for optimal resolution at each data point, thus compensating the effects of ion position changes due to the varying balance between the trap potentials and the laser force. At the same time we minimize radial micromotion at each data point to avoid axial heating via possible coupling to the radial motion. Figure 3 (a) shows such a measurement for MHz and with between and kHz. The insets show corresponding images and the resulting axial RMS spot sizes obtained from Gaussian fits to the image histograms are plotted versus . Note that the radial widths only increase slightly by about 15 % towards lower axial potentials because radial micromotion compensation becomes increasingly difficult. The behavior of is confirmed by a fit (Eq. 4), which yields an ion temperature of mK and a PSF of m, both with statistical uncertainties.
IV.3 Systematic effects
The main systematic uncertainty arises from residual axial micromotion caused by the axial component of the rf fringe fields. The simultaneous presence of dc and rf fields leads to a parametric potential . is the trap frequency. and are trap parameters associated with the dc and rf voltages and , respectively. Without damping and diffusion, the ion’s equation of motion is a Mathieu equation and for certain parameter sets there are stable trajectories of the ion with amplitude and [30]. The latter can be interpreted as the secular frequency of the ion in a time averaged pseudopotential. For vanishing it reduces to pure rf confinement while pure dc confinement results for . Superimposed on the secular motion, the ion performs micromotion at the trap frequency with an amplitude . For an ion cooled close to the Doppler limit of 1 mK, is of the order of 50 nm and does not influence the apparent spread or lead to significant deviations from a Gaussian distribution [31, 6].
A stronger effect due to micromotion is expected via the kinetic energy which is given by [30]
| (5) |
The first term is due to secular motion, the second reflects the contribution from the unavoidable ordinary micromotion that is associated with the secular motion. It depends on the secular amplitude and is significant for low secular frequencies . The third term is caused by a mismatch between the rf and dc potential minima positions. It results in a displacement of the ion out of the rf minimum so that it is exposed to excess micromotion [30] that contributes an energy . A cooling laser introduces both damping and a stochastic force to the equation of motion. Blatt et al. [6] have solved the corresponding Fokker-Planck equation for the first two terms in eq. 5, which results in Gaussian spatial and velocity distributions. It turns out that the presence of a stochastic force transforms part of the micromotion energy into irregular motion (temperature) by rf heating which is reflected in a broadening of the velocity distribution as well as the spatial distribution as compared to the case of pure secular motion.
From the lowest secular frequency that we have observed when lowering the dc potential , we estimate an upper limit for the residual axial rf confinement of kHz, corresponding to . According to [6], the corresponding ordinary rf heating broadens the spatial distribution by a factor of 1.15 for the lowest secular frequency of kHz. This broadening decreases strongly towards higher . For the estimated upper limit of kHz, our Eq. 2 thus overestimates the temperature by a factor of 1.3 which results in a systematic uncertainty of mK in our experiment.
IV.4 Thermometry of a Doppler cooled ion
In the next step, we employ our thermometry method to investigate the detuning dependence of Doppler cooling. Figure 3 (b) shows absolute temperatures measured for laser detunings between and indicated by squares while the circles are the Doppler temperatures predicted for pure secular motion by Eq. 3. Our measurements follow the detuning dependence of Eq. 3 qualitatively, but show an offset of mK. The higher temperatures are on the order of our conservative estimate for the systematic uncertainty. However, such a temperature rise can also be caused by excess micromotion in a significantly smaller residual axial rf potential [30]. While the ordinary micromotion becomes insignificant for , excess micromotion due to a large leads to a -independent contribution in Eq. 5 and may thus increase the ion temperature through rf heating correspondingly.
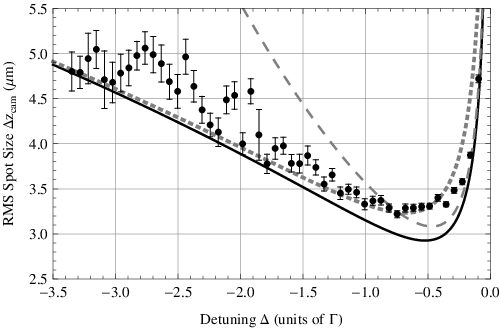
In order to study the temperature over a wider range of detunings
between 0 and , we measure the image spot sizes of the ions for fixed values of kHz and
(Fig. 4). At this secular frequency the
ordinary micromotion increases the ion temperature by less than 1%.
Due to possible variations of the resolution during
the laser scan, we do not extract the temperature in this
measurement. Nevertheless, the spot size can still
serve as a decent measure for the temperature. The solid line in
Fig. 4 represents the behavior according to
Eq. 3 in combination with Eqs. 2
and 4, using and m.
The latter is estimated to be an upper limit. Quantitatively, the
measured values are again up to 10% higher. The data supports our
hypotheses that rf heating due to excess micromotion is the main
cause of the higher observed temperatures. Since rf heating is
related to the photon scattering of the cooling laser [6],
its rate is expected to be detuning-dependent similar to the cooling
rate. The wide tuning range in this measurement allows to exclude
two other possible effects as causes for the excess temperature. As
a comparison, the long-dashed line shows the expected broadening
taking an additional, detuning-independent heating rate into
account. The short-dashed line assumes that the line width is
homogeneously broadened to caused, e. g., by the Zeeman
splitting or micromotion-induced line broadening [30].
From earlier spectroscopy experiments [9], we know that for
our experimental parameters the homogeneous broadening is in fact
lower. In conclusion, both effects can be excluded as causes for the
observed higher thermal spreads (temperatures).
V Summary
To summarize, we have demonstrated that a single, Doppler cooled ion weakly bound in an ion trap, shows a Gaussian thermal spatial distribution as expected from Brownian motion. We show that this time-averaged spatial distribution can be used for sub-milliKelvin thermometry with an accuracy of mK unchallenged by similar methods in the unresolved sideband regime. Further, we have employed this thermometry to investigate the detuning dependence of the temperature in Doppler cooling. Note that this method which was demonstrated for the axial trapping direction here, can in principle be applied to any projection of an ion on the imaging plane. The use of high NA objectives with resolutions close to the diffraction limit [32, 20] would allow to further improve on accuracy and to perform thermometry in steeper trapping potentials.
References
- [1] D. J.Wineland and W. M. Itano, Phys. Rev. A, 20, 1521 (1979).
- [2] S. Stenholm, Rev. Mod. Phys., 58, 699 (1986).
- [3] R. Brown, Phil. Mag. 4, 161–173 (1828).
- [4] A. Einstein, Annalen der Physik 17, 549–560 (1905).
- [5] G. E. Uhlenbeck and L. S. Ornstein, Phys. Rev. 36, 823, (1930).
- [6] R. Blatt, P. Zoller, G. Holzmüller, and I. Siemers, Z. Phys D. 4, 121-126 (1986).
- [7] D. M. Meekhof, C. Monroe, B. E. King, W. M. Itano, and D. J. Wineland, Phys. Rev. Lett. 76, 1796 (1996).
- [8] C. W. Chou, D. B. Hume, J. C. J. Koelemeij, D. J. Wineland, and T. Rosenband, Phys. Rev. Lett., 104, 070802 (2010).
- [9] M. Herrmann, V. Batteiger, S. Knünz, G. Saathoff, Th. Udem and T.W. Hänsch, Phys. Rev. Lett. 102, 013006 (2009).
- [10] R. Maiwald, D. Leibfried, J. Britton, J. C. Bergquist, G. Leuchs, and D. J. Wineland, Nat. Phys., 5, 551 (2009).
- [11] S. Knünz, M. Herrmann, V. Batteiger, G. Saathoff, T.W. Hänsch, K. Vahala and Th. Udem, Phys. Rev. Lett. 105, 013004 (2010).
- [12] Shlomi Kotler, Nitzan Akerman, Yinnon Glickman, Anna Keselman, Roee Ozeri, Nature 473, 61 (2011).
- [13] A. Friedenauer, H. Schmitz, J. T. Glueckert, D. Porras, and T. Schaetz, Nat. Phys., 4, 757–761 (2008).
- [14] D. Kielpinski, C. Monroe, and D. J. Wineland, Nature, 417, 709–711 (2002).
- [15] J. C. Bergquist, Wayne M. Itano, and D. J. Wineland, Phys. Rev. A, 36, 428 (1987).
- [16] L. Slodička, G. Hétet, N. Röck, S. Gerber, P. Schindler, M. Kumph, M. Hennrich, and R. Blatt, e-print arXiv:1202.4559v1.
- [17] W. Nagourney, G. Janik, and H. Dehmelt, Proc. Natl. Acad. Sci. USA, 80, 643-646 (1983).
- [18] Taro Hasegawa, Daisuke Tanooka, and Tadao Shimizu, Phys. Rev. A, 58, 2327 (1998).
- [19] W. Neuhauser, M. Hohenstatt, and P. E. Toschek and H. Dehmelt, Phys. Rev. A, 22, 1137 (1980).
- [20] B.G. Norton, E.W. Streed, M.J.Petrasiunas, A. Jechow, and D. Kielpinski, arXiv:1106.1708v1 (2011). N. J. Phys. 13, 113022 (2011).
- [21] Y. Miroshnychenko, D. Schrader, S. Kuhr, W. Alt, I. Dotsenko, M. Khudaverdyan, A. Rauschenbeutel, and D. Meschede, Opt. Express 11, 3498-3502 (2003).
- [22] M. Drewsen, C. Brodersen, L. Hornekaer, J. S. Hangst, and J. P. Schiffer, Phys. Rev. Lett. 81, 2878 (1998).
- [23] D. Offenberg, C. B. Zhang, Ch. Wellers, B. Roth, and S. Schiller, Phys. Rev. A, 78, 061401(R) (2008).
- [24] S. Knünz, PhD thesis, Ludwig-Maximilians-Universität, Munich, Germany (2011).
- [25] F. Reif, Fundamentals of Statistical and Thermal Physics (McGraw-Hill, New York, 1965).
- [26] G. N. Watson, J. London Math. Soc. 8, 194 (1933).
- [27] D. Leibfried, R. Blatt, C. Monroe, and D. Wineland, Rev. Mod. Phys., 75, 281 (2003).
- [28] W. Ansbacher, Y. Li, and E. H. Pinnington, Phys. Lett. A, 139, 165 (1989).
- [29] D. F. V. James, Appl. Phys. B, 66, 181–190 (1998).
- [30] D. J. Berkeland, J. D. Miller, J. C. Bergquist, W. M. Itano, and D. J.Wineland, J. of Appl. Phys., 83, 5025 (1998).
- [31] J.I. Cirac, L.J. Garay, R. Blatt, A. S. Parkins and P. Zoller, Phys. Rev. A 49, 421 (1994).
- [32] A. Jechow, E. W. Streed, B. G. Norton, M. J. Petrasiunas, and D. Kielpinski, Opt. Lett., 36, 1371 (2011).