23Na NMR study of sodium order in NaxCoO2 with 22 K Néel temperature
Abstract
We report a systematic study of the lattice parameter in the NaxCoO2 phases versus Na content , in which sodium always displays ordered arrangements. This allows us to single out the first phase which exhibits an antiferromagnetic order at a Néel temperature 22 K which is found to occur for . Pure samples of this phase have been studied both as aligned powders and single crystals. They exhibit identical 23Na NMR spectra in which three sets of Na sites could be fully resolved, and are found to display dependencies of their NMR shifts which scale with each other. This allows us to establish that the variation of the shifts is due to the paramagnetism of the Co sites with formal charge state larger than 3+. The existence of a sodium site with axial charge symmetry and the intensity ratio between the sets of 23Na lines permits us to reveal that the two-dimensional structure of the Na order corresponds to 10 Na sites on top of a 13 Co sites unit cell, that is with . This structure fits with that determined from local density calculations and involves triangles of 3 Na sites located on top of Co sites (so called Na1 sites). The associated ordering of the Na vacancies is quite distinct from that found for .
pacs
76.60.-k, 61.66.-f, 71.27.+aI Introduction
Since the discovery of high thermo-electric power[1] and superconductivity[2] in layered cobaltates NaxCoO2, extended efforts have been made in order to understand the importance of electronic correlations in their metallic and magnetic properties. While the compound is a band insulator,[3, 4] a slight reduction of Na content down to results in various antiferromagnetic (AF) phases with distinct Néel temperatures detected by local probe measurements such as SR [5, 6], NQR/NMR [7, 8, 9] or by thermodynamic properties [10, 11]. Neutron scattering data established that the AF state is of -type that is ferromagnetic in the CoO2 planes and AF between planes as long as .[12, 13] NMR studies established that similar Curie-Weiss paramagnetism occurs above 100 K down to , though ordered magnetism does not occur below of the order 0.75.[7] The study of the spin dynamics by spin lattice measurements in NMR also has evidenced that ferromagnetic correlations are still dominant in plane [7], but switch abruptly to AF correlations in plane for .[14]
While many experiments and theoretical calculations have considered that the Co magnetism is uniform, it has been evidenced by NMR that Na displays an atomic ordering associated with Co charge disproportionation in the planes.[15, 16, 17, 18, 19, 7, 8, 20] Such Na ordered atomic structures have been observed by TEM,[21] neutrons,[22] and x-rays.[23, 24, 25] In Na1CoO2 the single Na site is located on top of the center of a Co triangle, in a configuration usually called Na2. Numerical simulations [22] and electronic structure calculations [26] suggest that the Na2 vacancies formed for , are ordered in the Na plane. These vacancies have a tendency toward clustering and, depending on , these clusters induce altogether the appearance of isolated Na1 sites (on top of a Co) in divacancy clusters or of trimers of Na1 sites in trivacancy clusters.
Of course the incidence of the structural order on the charge disproportionation and on the physical properties is still an important pending question. However, the experimental situation that prevails so far is quite unusual in solid state physics, as most experiments do not permit altogether to establish reliably the relation between the local order proposed, the actual Na content and the local magnetic properties of the studied samples. We have demonstrated that NMR/NQR is a powerful technique allowing us to establish this correlation, and applied it to the specific phase.[27] There we found ordered divacancies resulting in isolated Na1 sites in the Na plane. They are accompanied by the differentiation of Co3+ non magnetic sites, on top and below the Na1, with respect to Co sites with a formal valence located on a kagomé substructure of the triangular cobalt lattice. The local magnetic properties of these cobalt sites could be studied in great detail.[20] Theoretical work suggests that the electronic correlations are enhanced for this composition,[28] and that this Na content is indeed the turning point between AF and ferromagnetic in-plane correlations.[29]
To expand our work toward higher Na contents for which the Na order might have a prominent incidence on the magnetic 3D order, we have selected to study here the magnetic phase with a well defined K which we had detected quite early by SR.[6] This appears to be one of the most stable magnetic phases, which has been found by many authors. However a large controversy still exists on the actual Na content of this phase which some have found near the composition [13, 6, 8, 30] while others reported a composition of .[23] This latter estimate of Na content introduced some confusion in the scientific community and required considering complicated staging structures with different Na contents on alternating planes, a situation which has been therefore proposed for most Na concentrations.[23]
Here we present experimental work that resolves these data differences but also allows us to characterize the in plane Na atomic order in this K phase. We could synthesize both a single phase powder sample of this phase that has been aligned in the NMR field, and single crystals in which this phase could be isolated. The x-ray data analysis and the 23Na NMR results allow us to confirm on secure physical grounds our calibration scale, which has been recently confirmed by electrochemistry.[31] We demonstrate that the 22 K phase corresponds to a Na content of and matches the simple planar Na order proposed in Ref. 26 with 13 Co per unit cell containing only Na trivacancies (or Na1 trimers). The 23Na NMR data are not sufficient so far to permit us to fully resolve the 3D stacking of this unit cell. But they allow us to conclude that this stacking does not require any complex staging, and that the concentration , which can be deduced from our curve permits one to reconcile most existing data.
II Sample synthesis and characterization
We discuss here the preparation of the sample powders, and give evidence that we could produce single phase samples. The analysis of the x-ray data allows us then to determine a calibration curve for the variation of the axis parameter versus and report the existing composition gaps. Preparation of samples with a floating zone technique which usually allows to synthesize homogeneous single crystals will then be discussed and it will be shown that in such conditions multiphase samples with various Néel temperatures are usually produced.
II.1 Powder samples
We have detailed in former publications the method used to synthesize powder samples suitable for NMR experiments in the range of concentrations between 0.45 and 0.78.[14, 7] There we have shown that x-ray diffraction allowed us to select single phase samples, that is phases with a well defined Na ordering. Indeed, the systematic study of the powder x-ray spectra for various nominal Na contents allowed us to separate pure phases from multiphase samples with distinct axis parameters. We took systematic x-ray spectra for samples with for increasing Na content, by steps of 0.3% in Na content. We could then track all the hexagonal two layers phases (, n∘166) which can be quenched at room up to the 22 K phase.
This preparation procedure also allowed us to produce the distorted rhombohedral (monoclinic) phase conventionally named three-layers which cannot be prepared in oxygen atmosphere at high temperature (850-900∘C). They are only obtained either by Na de-intercalation starting from or by direct synthesis in argon atmosphere at 600-700∘C depending on composition.
We illustrate that point by displaying the powder diffraction Bragg peaks shown in Fig. 1 for the pure K phase and the closest phase with lower Na content. For intermediate concentrations between these, we always find mixed-phase samples with the two end phases. The diffraction peaks of the monoclinic phase which occurs in the same range of angles as that of the (008) for the hexagonal phase is also displayed in Fig. 1 for the pure K phase detected initially by SR in our research group.[6] The diffraction angles for our pure phases are quite similar to those reported by Shu et al on single crystal multiphase samples (see their Fig. 2 in Ref. 23). So we certainly identified the same ordered phases, but we have synthesized them as pure phases. We could not synthesize in powder form the pure magnetic phase with K which is located between the K and K phases, although we got mixed phase samples. We shall see later that we also found this K phase embedded in single crystals.

The actual Na content of these phases can then be monitored by the axis parameter value, which could be accurately obtained in our case by full Rietveld analysis of the diffractions on a range of angles (for Cu Kα). But estimates of the actual Na content require a determination of the calibration curve on such single phase samples. We determined accurately three points:
(i) the phase for which the structure is well established and Å;
(ii) the phase for which we have determined the structure by NMR/NQR, [27] which has then been fully confirmed by x-ray Rietveld analysis with 10.9383(3) Å;[24]
(iii) the pure phase, which has a characteristic NQR spectrum,[9] quite distinct from that for , and could be synthesized with full thermogravimetric control from the constituents Na2CO3 and Co3O4 without mass loss. For this phase 10.8874(3) Å.
We notice, as shown in Fig. 2, that these three points define a linear relation between and . This plot allowed us to determine the concentration of the pure phases which could be stabilized at room in the absence of air contamination for all intermediate concentrations. We have reported in Fig. 2 their parameters and delineate there the composition gaps for which only mixed phase samples can be produced. This allows us to locate the sample compositions we have been studying so far by NQR/NMR up to .[14, 7] It is clear that the large composition gap which occurs above , and the structural change which occurs above allowed us to identify reliably and reproducibly the K phase. Indeed, the single phase sample with the (008) diffraction peak located at at room temperature was found to display a single magnetic transition detected at K by SR experiments.[6] Notice that, for the powder samples of this phase we did not succeed in indexing the weak superstructure or incommensurate satellites due to Na order, contrary to the case of all the samples with .

The recent study [31] of the phase diagram done by electrochemical control of the Na content allowed us to verify our structure, and permitted us to confirm a phase diagram in overall quite good agreement with ours. There, the difference between the 0.71 and 0.72 phases quite well evidenced from NMR/NQR data [7, 9] could not however be resolved. Their calibration curve, in good agreement with ours, is displayed on Fig. 2, together with the quite distinct one determined in Refs. [23, 32] by the inductively coupled plasma method and electron probe analysis. 11 1 This has lead them to associate their four magnetic phases with 0.763, 0.820, 0.833 and 0.859. We do not think that any of the existing data could determine the concentration of Na in a pure phase sample to better than 0.5%
For the K composition, assuming that a linear extrapolation of our curve applies, one would deduce , slightly above the value that has been assumed by many including us and in total disagreement with the value of Shu et al. [23] The results of Ref. 31 indicate that the curve might, however, not be linear up to the highest Na contents and might bend slightly down so that the K phase might correspond to .
Let us point out that powder samples with composition larger than 0.78 could only be synthesized in the three layer monoclinic structure O3. The corresponding axis values projected on the hexagonal cell axis also have been reported in Fig. 2. The values are however reliable as the samples were synthesized at relatively low with therefore negligible Na loss.
The linear variation that appears to apply from the monoclinic phase up to about is only slightly different from that for the hexagonal phases and does not extrapolate at the axis value for the rhombohedral composition, which is a completely different structural modification with a large composition gap above .
For all the high Na content phases with the samples evolved if submitted to any humid air as had been monitored from detailed evolution of the NQR spectra, which allowed to evidence the Na loss.[9] NQR and zero field NMR experiments at 4.2 K on a non oriented fraction of a K phase sample allowed us to ensure that the sample was not contaminated at the 10% level by any paramagnetic phase with lower , for which the NQR signals had been perfectly identified.[9]
After alignment in an applied field, with the procedure described in Ref. 34, the very sample on which most of the NMR experiments had been done had been kept at liquid N2 temperature and only heated to 200 K during experimental runs and never taken back to room . NMR experiments allowed us to confirm that the phase content of this sample did not evolve significantly during the alignment process, as detailed in Appendix A.
II.2 Single crystal samples
Synthesis of single crystal samples has been performed in an image furnace by a floating zone technique. Pieces which appeared as single crystals could be cleaved in some parts of the 11 cm long synthesized bars. To permit rf field penetration for the NMR experiments on samples exceeding 100 mg, we sliced these samples into thin pieces of about 200 m thickness and piled those upon each other with teflon tape separations.
Three such samples named SC1, SC2 and SC3 have been used and their magnetic properties were controlled first by SQUID measurements which established that the Na content was not uniform in those macroscopic samples. One could easily see in Fig. 3 the signatures of three magnetic transitions at 9 K, 22 K and 29 K, which differed in the three samples. While SC1 and SC2 exhibited initially transitions at 9 K and 22 K, SC3 exhibits the 9 K and 29 K transitions. So these transitions are characteristic of independent Na ordered phases and the samples are mixed phases presumably of adjacent phases in the phase diagram.
So, such an image furnace synthesis does not allow a full control of the Na content, which was found dependent on the excess Na used in the starting materials and of the Na loss which depends critically on the growth conditions. Although the samples appear as single crystals for the ordering of the CoO2 lamellas, the homogeneity of Na content is not realized in such macroscopic samples, which often display multiphase content. This was similarly found by many others as well.[11, 23] As will be shown hereafter, 23Na NMR data helped us to better characterize the crystallinity of these samples and the phase content.
The 22 K and 29 K phases were known and isolated already in powder samples for the SR experiments,[6] while, as said above, we never were able to synthesize powder samples displaying a majority phase with 9 K. Also for the 22 K and 29 K phases SQUID magnetic transition signals were not found to depend on the cooling process of the sample. On the contrary, as can be seen in Fig. 3, the SQUID transition signal of the 9 K phase could be depressed by fast cooling below 200 K, which indicates that some specific Na ordering has to be established by slow cooling to stabilize the K phase.[11]

We expected that such bulk samples would be more stable than the powders but this happened to be only partly the case, as we found that they did still evolve slowly in time when kept in air. The sample SC1 which initially was a mixture of 22 K and 9 K phase did lose progressively the 9 K phase signal and finally had only the 22 K phase left. As shown in Appendix B, we could even control partly this type of evolution by heat treatment.
Our observations essentially agree with those done independently by specific heat and magnetization measurements,[11] and with the hierarchy of Néel temperatures with increasing Na content reported in Ref. 23 on samples which are apparently similar mixed phase single crystals. Then, contrary to our ceramic synthesis done in the solid state for the powder samples, it does not seem easy to synthesize directly phase pure single crystal samples with controlled Na content. This might explain the difficulty to fix the Na content by chemical analysis which measure the total Na/Co ratio, and not that actually involved in a specific phase. In view of this evolution of the single crystals at room , we decided then to keep our three samples in liquid nitrogen to avoid further evolutions of their Na contents. This was of particular importance for the SC1 sample which had progressively expelled its 9 K phase and had become a nearly pure 22 K phase sample, as will be confirmed below by 23Na NMR. As will be detailed hereafter, these data will furthermore allow us to get independent confirmation of the validity of our calibration curve.
III 23Na NMR data
In the first NMR work done in our group on cobaltates we immediately showed that 23Na NMR is a powerful tool, which allowed us to establish the existence of Na atomic order.[35] As 23Na has a spin , the NMR spectrum for a single Na site displays a central transition and two satellites disposed symmetrically with respect to the central line. While the shift of the central line signal is governed by the magnetism of the near-neighbor Co sites, the distance between the satellites is linked to the quadrupole frequency associated with the magnitude of the electric field gradient (EFG) at the Na site, which is governed by the distribution of ionic and electronic charges around the Na.
III.1 NMR spectra for
So, as in the phase,[35] we find here that, with an external field applied along the axis of the powder or crystal samples the 23Na NMR spectrum reflects above the diverse Na sites pertaining to the studied phase. The NMR spectra of the oriented powder sample of the 22 K phase displayed three well resolved lines on the central transition and on the high frequency satellites, but which overlap for the low frequency satellites as can be seen in Fig. 4(a). The three sets of central lines detected are similar to those found in the Ref. 8 on a single crystal of this 22 K phase. In both cases the less shifted line is the broadest so that one can anticipate that it corresponds to a superposition of unresolved lines with slightly differing shifts and values.
The 23Na NMR spectrum of the “purified” SC1 sample in which the 22 K phase is dominant displays identical features with a slightly better resolution and slightly narrower satellite lines - see Fig. 4(c). This indicates that the axis orientation is better defined there, as ensured by the easy cleavage, while perfect alignment of the axis is harder to achieve in powder samples. The differentiation of the high frequency quadrupole satellites in the SC1 sample is better and ensures the occurrence of at least four Na sites distinguished by their distinct values.
Let us point out that the 23Na NMR spectra are quite distinct in the 9 K phase as will be shown in Appendix C. It is quite important now to consider data for to be able to sort out the respective local properties of the set of resolved Na lines.

III.2 NMR spectra for : local symmetry of the Na sites
Taking the data for is essential to get good indications on the local symmetry of the sites. Let us recall that the distance between the two satellite lines which correspond for the 23Na to the and transitions depends on the orientation of the external field with respect to the principal axis of the EFG tensor which lies in the axis direction in these lamellar systems.[35, 7] can be expressed as:[36]
| (1) |
where is the asymmetry parameter of the EFG tensor and and the spherical angular coordinates of the field. In the case of powder crystallite samples, the observed spectrum for is the superposition of the spectra obtained for all possible orientations of the plane. A remarkable case, very easy to identify, is that for sites with axial symmetry for which , so that is unique whatever the orientation of the field in the plane and exactly occurs at , that is half the value obtained for . For non zero values of the quadrupolar satellites display double horn spectra in the powder spectrum as seen in Fig. 4(b), the extension of the double horn being then determined by the value.
The inspection of the spectrum of Fig. 4(b) quite easily allows us to identify the existence of an axial site, which is found to correspond to that which displays the largest shift of the central line in both and spectra. From the width of the line in the direction and the measured values of in the two field directions, an upper limit of can be put on its asymmetry parameter. As will be seen later the identification of this axial site is a quite essential element which will allow us hereafter to resolve the Na in plane atomic order. Notice that, as can be seen in the axis spectrum, the intensity of this line is much weaker than that of the other Na sites. We shall come back on these intensity determinations later.
The other feature that is easily seen when comparing the spectra for , Fig. 4(b) for the powder sample and Fig. 4(d) for SC1, is the strong analogy between the spectra. In both samples the axial site is detected as well as identical double horns. This allows us to confirm that the SC1 is not a single crystal in the plane and contains at least as many twin boundaries and more probably a mosaic of crystallites of in plane Na order, so that the SC1 spectrum appears quite analogous to the powder sample spectrum. However the number of crystallites is not large enough to span the random angular distribution of the powder sample, this being seen as an “additional noise” in the spectrum of SC1 as compared to the powder sample case. For both samples the simulations of the spectra allow us to establish that the three non axial Na sites display large values between 0.5 and 0.7 as listed in Table 1.
III.3 Intensities of the various Na lines and site occupancies
It is quite easy to see in the expanded central line spectra, for both and , and for both samples that the most shifted line is the less intense, while the middle line has lower intensity than the less shifted one, that results from the overlap of at least two signals. To get accurate relative intensities one needs to take into account the decay time of the spin-echo signal which differs from site to site, and to control very accurately the reproducibility of the results. Also, as we cannot guarantee the phase purity to better than 90% in these cobaltate samples, weak signal components of impurity phases might superimpose on those of the dominant phase and influence the data. It is then quite difficult to obtain a determination of the relative intensities on a single spectrum with an accuracy better than 10%.
The line being the most shifted hardly overlaps with the other ones and its intensity can be estimated relative to the total intensity. We find that the statistical number for this ratio, taken on a large series of spectra can be secured to (9.5 on both the powder and SC1 samples. This would indicate that this Na(1) NMR spectrum corresponds to one Na site over 10 or 11. If part of the less shifted side of the spectra includes that of some weak intensity impurity phases, the actual intensity ratio for the line could be rather 10% so that it would correspond rather to 1 site on a total of 10. The other intensity ratio which can be secured is Na(2)/Na(1), which fully excludes considering 4 sodium sites for the Na(2) NMR spectrum.
As for the less shifted part of the spectrum which involves at least two sets of lines Na(3) and Na(4), which are poorly resolved, we have refrained from determining the relative intensities of these unresolved lines and have done only careful determinations of the intensity ratio between Na(3&4) and Na(2). Here again the statistical determination of this ratio could be evaluated to be . indicating that the less shifted lines correspond to twice the number of sites of the intermediate one. Overall, the most realistic number of sites which might be retained would be 6/3/1 with increasing NMR shifts, and could hardly be 7/3/1 or 5/3/1, as one would expect then an intensity ratio of 2.33 or 1.66 between the two intense sets of lines, significantly out of the experimental error bar.
III.4 Full analysis of the Na NMR spectra and dependence of the NMR shifts
Overall it has been quite possible to simulate the two sets of spectra using the magnetic shift () and quadrupole parameters (, ) given in Table 1 for the four detected sites, as can be seen in Fig. 4. Though, the respective intensities 3/3/3/1 used cannot be ascertained solely by these fits, especially for the two components of the lowest shift lines. But one might notice that the simulations are similarly good for the powder and SC1 samples.
| NMR site | Na(1) | Na(2) | Na(3) | Na(4) | |
|---|---|---|---|---|---|
| Weight | 1 | 3 | 3 | 3 | |
| (MHz) | 2.026 | 1.94 | 1.92 | 1.88 | |
| Powder | 0 | 0.5 | 0.7 | 0.58 | |
| 30 K | (%) | 0.156 | 0.115 | 0.077 | 0.07 |
| (%) | 0.156 | 0.118 | 0.075 | 0.073 | |
| (MHz) | 2.044 | 1.951 | 1.932 | 1.88 | |
| SC1 | 0 | 0.5 | 0.68 | 0.57 | |
| 80 K | (%) | 0.1685 | 0.136 | 0.080 | 0.0923 |
| (%) | 0.164 | 0.136 | 0.099 | 0.0853 |
We did follow the dependence of the shifts of the various lines in the spectra, which are plotted in Fig. 5 and are quite similar for the powder and SC1 samples. We also plotted for reference the shift of the outer Na(1) line for that is . In all cases the shifts display a maximum at about 40K as was already reported in Ref. 7 for the mean shift of the spectrum. We found that and are nearly identical for the Na(1) lines but also for the other ones, which confirms the isotropy of the spin susceptibility found from SQUID data. Furthermore, as was found as well for the phase,[35] the shifts for the various lines scale with each other as shown in the inset of Fig. 5. This indicates that, as concluded as well for the phase, the various Na sites in the structure are detecting the magnetism of their neighbouring Co sites through slightly distinct hyperfine paths, and that a single dependence dominates the physical properties.

IV 2D Structure of the Na planes
The present results give important elements to decide about the Na order and content in this =22 K phase. We have therefore considered the Na orderings proposed by various authors for . The minimal energy structures computed for this range by Hinuma et al. by GGA calculations or GGA calculations correspond to Na concentrations (Fig. 6(b)) and (Fig. 6(c)).[26] These structures contain trivacancies, which correspond to a triangle of six vacant Na2 sites filled by a trimer of Na1 sites at the center. The stability of such a cluster of vacancies has also been emphasized by Roger et al. from simulations done for higher sodium concentrations.[22] From their neutron scattering experiments these authors later identified two distinct structures which also contain this Na1 trimer, and apparently occur for - see Figs. 6(e)(f).[22, 37] We show as well in Fig. 6(d) the unit cell with a single divacancy, proposed by Shu et al. for 0.846. They suggested that two such planar structures are stacked with one layer (Fig. 6(c)) to obtain a structure corresponding to , the Na content they proposed for the K phase.[23]
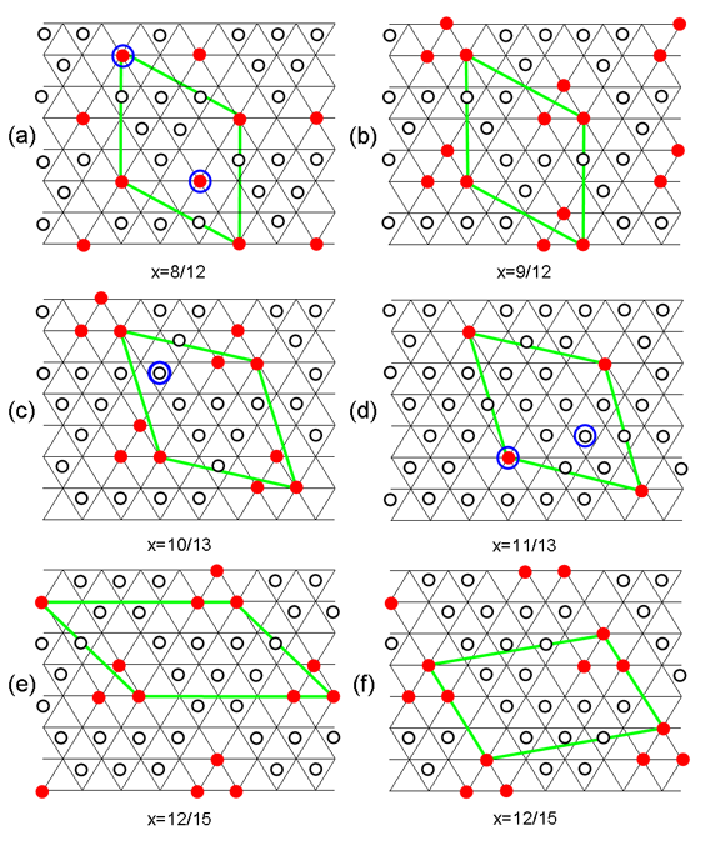
The structure of Fig. 6(c) corresponds to a 13 cobalt planar unit cell with and four Na sites with intensities 1/3/3/3. There the singly occupied Na site is an Na2 site with perfect threefold symmetry which can be assigned to the low intensity Na(1) site in our spectra. The three other have the same occupancies, so that our spectra agree with this structure if we consider that the lowest frequency line combines two lines corresponding to 3 Na sites each. The simulations done in Fig. 4 with four sites with occupancies 1/3/3/3 are therefore fully compatible with this structure.
The two structures of Figs. 6(e)(f) proposed in Refs. 22, 37 both exhibit one Na2 site with axial symmetry for their first neighbours for (e), or for both first and second neighbours for (f), but not at the third neighbour level, so that one expects a small value but not . If we tentatively assign the experimental line to this site, its intensity would be 1/12 of the Na NMR intensity, somewhat smaller than the actually measured intensity within our experimental accuracy. Furthermore these structures differentiate six Na sites with intensities 1/2/2/2/2/3 for Fig. 6(e) and even more sites with intensities 1/1/2/2/2/2/2 for Fig. 6(f). As the Na(1) and Na(2) lines correspond respectively to 1 and 3 sites, the 8 remaining sodium sites would correspond to the Na(3&4), so one would expect for the intensity ratio of the two lower shift NMR lines Na(3&4)/Na(2) = which is largely in excess of our data of .
As for the structure proposed in Ref. 23, shown in Fig. 6(d), one can see that it has one Na1 site and one Na2 site which both display a perfect axial symmetry, so that these two distinct sites would correspond to . If two such planes were stacked with the structure of Fig. 6(c), as proposed in the Ref. 23, we would expect three distinct locally axial sites, which is not compatible with our data for which a single site with is resolved. Also that would result in a quite complicated spectrum with up to 7 other different Na sites, totally incompatible with the relatively simple spectrum detected hereabove.
So, for the K phase, the structure which is compatible with all the features of our 23Na NMR data is that of Fig. 6(c) with . However in the 23Na NMR spectra, we are not able in this unit cell to assign the Na(2)-Na(4) signals, with 3 sodium positions each, which do not have axial symmetry. Such a correspondence could only be established by considering the 3D stacking of the Na planes, taking into account differentiation of the Co sites - see Section V.
If one now considers the synchrotron x-ray data reported in Ref. 23 on the samples with 22 K, with the same axis parameter as ours, as well as those on the 9 K and 29 K phase, they find that they do all correspond to a lattice with a 13 cobalt unit cell, that is . Their structural result agrees then with the fact that the cells of Fig. 6(b)(e)(f) with either 12 or 15 Co per unit cell cannot explain our 23Na NMR data. On the contrary the 13Co unit cell illustrated in Fig. 6(c) proposed in Ref. 26 from GGA calculations, for , is fully compatible with all the data obtained on the =22 K phase, that is:
- the local symmetries and signal intensities of the Na sites detected in our 23Na NMR data;
-the size of the unit cell obtained by single crystal x-ray data;
- the Na content estimated from our calibration curve and that of Ref. 31.
V 3D structure of the 22 K phase ?
So far we have only done an analysis based on a single layer of Na between CoO2 layers. In real crystals one has to stack the Na layers to define a 3D structure. We further know that in all phases with the charges of the Co sites are differentiated. For we have demonstrated the existence of 20 to 40% of Co3+ in our samples.[7] This has been found as well by others.[8, 16] So this differentiation of the Co charges depends of the stacking of the Na layers above and below the CoO2 layer.
We have studied that in detail in the case of for which the Na layer contains two identical Na1 sites and two distinct Na2 sites with multiplicity 3 as recalled in Fig. 6(a). Due to the high symmetry of that structure, the stacking of the layers does not differentiate the Na sites of the individual layers and the full crystal structure only retains the 3 Na sites of the single layer.
But with the low symmetry of the unit cell for x=10/13, the 3D stacking of this layer could differentiate the crystallographic sites of the four Na sites distinguished in the 2D structure. Weak splittings can indeed be guessed in the 7.5 Tesla spectra of Fig. 4. We have then taken data in a higher field of 13.5 Tesla to try to better resolve such splittings on the SC1 sample in which the spectral resolution is better than on the powder sample. On the spectrum displayed in Fig. 7, we can indeed see that the central line and right satellites are better resolved in this applied field, and we distinguish weak subsplittings of the Na(2) and Na(4) lines into lines labeled as Na(2′), Na(2′′), Na(4′) and Na(4′′). Similar subsplitting could be seen as well on the central line data in Ref. 8, so that seems to be sample independent and characteristic feature for this phase with K.

If one may consider that the 3D stacking establishes a perfect crystalline order, the rough analysis of the NMR intensities of the central line and high frequency satellites would indicate that both Na(2) and Na(4) split into two lines with multiplicities of (1:2). Therefore the 3D structure could correspond to 6 Na sites with respective Na occupancies of 1:2:3/1:2/1, with increasing Na NMR shift.
We attempted to use these differences between Na sites to guess the actual stacking of the 10/13 structure. We have to recall that this stacking should reveal the ordering of the Co charges differentiated in each plane depending of the Na neighbours of each Co site. This would then in turn imply a differentiation of the Na sites depending of their Co neighbours in the 3D structure. This was successfully done in the phase, where the symmetry of the 2D unit cell stacking was so high that it did not result in a further differentiation of the three planar Na sites. The situation might be more complicated in the present case as we have to determine how the Na1 trimers are positioned on the two Na layers below and above the CoO2 layers. The number of possibilities is much larger in this case than for the phase. Obviously, even in the latter case, the knowledge of the charge differentiation of the Co was necessary to solve the structure. We are therefore presently undertaking a detailed study of the 59Co NMR spectra, which might help us to finalize such an analysis and to give us indications on the Co charge disproportion in this phase.
VI Conclusion
Here we have done a systematic investigation of the stable Na ordered phases, and the composition gaps occuring in NaxCoO2 cobaltates in the range . We focused our attention on the magnetic phases, the first one occuring for with K, and did evidence that both our powder and single crystal samples give phases with magnetic properties identical to those reported in the literature. This allowed us then to confirm that the axis versus calibration curve we have established for long is in good agreement with that proposed by producing similar phases by electrochemical reduction of Na content.[31] Our results totally dismiss the curve reported by Shu et al. solely by chemical analysis of the Na content in their single crystal samples.[32] Those methods always give a larger estimate of the actual Na content of the dominant phase, inasmuch as the extra Na required to grow the single crystals remains in the sample as chemical impurities.[38]
More importantly, we have performed a specific 23Na NMR study of pure phase powder and single crystal samples of the K phase and could identify 4 distinct Na sites, one of which displaying an axial symmetry. This allowed us to identify the 13 Co unit cell of this phase, which contains 10 Na (hence ), and which agrees with the size of the cell proposed by Shu et al. from their synchrotron x-ray single crystal data.[23] The agreement of this value of with that deduced from our calibration does not call for any complex staging for this composition. The 3D unit cell should then result from a stacking of 2D Na unit cells. We could not however anticipate so far this 3D stacking solely from 23Na NMR data.
The important new feature of these results is that the unit cell established here experimentally contains a cluster of three Na2 vacancies surrounding a triangle of Na1 sites which has been suggested for long to occur by various simulations for larger Na contents.[22, 26] On the contrary for all the ordered phases for that we have studied so far Na2 divacancies order around isolated Na1 sites. In the phase the Na1 sites were found directly on top of the Co3+ sites with fully filled orbitals, and this appears to be the case for all . In the present case the disproportionation of Co states might be quite distinct. So one might anticipate that the A type AF phases which only occur above can be driven by this distinct order of the Na sites. In such a case the two significant boundaries anticipated in the Ref. 26, 39 in the phase diagram of Na cobaltates appear to be confirmed experimentally. Divacancies order in rows below ,[14], display 2D order for which transform into zigzag chains up to .[27] They disappear then for and are replaced by trivacancies which presumably persist until as suggested by GGA calculations done in Refs. 26, 39. Further detailed Co NMR data should help us to determine the 3D order of the phase and to identify how the charge disproportionation is connected with the Na order in these AF phases.
An important question remains as it is not clear so far whether the Co charge disproportionation which is not considered in the GGA calculations [26, 39] is driven by the Na order or whether it is an intrinsic property of the CoO2 planes. The kagome type of charge structure could be anticipated from electronic structure calculations,[40] is even reinforced by electronic correlations[28] and happens to match perfectly the Na order. It is however harder to imagine here that the 13 Co unit cell would be a naturally stable configuration of the charge disproportionation of the CoO2 plane!
VII Acknowledgments
We would like to thank here F. Bert, J. Bobroff and P. Mendels for their help on the experimental NMR techniques and for constant interest and stimulating discussions. We also thank here Z.Z. Li for his help for the x-ray characterization of the single crystal samples. We acknowledge the Marie Curie program for the fellowship given for the internship of Y. Dmitriev, and “Triangle de la Physique” for partial support provided for an image furnace at Institut de Chimie Moléculaire et des Matériaux d’Orsay (ICMMO), and for supporting the visits to Orsay of I.R.M. and A.V.D. Also I.R.M. and A.V.D. thanks for partial support of this work the Russian Foundation for Basic Research (Project No.10-02-01005a), and the Ministry of Education and Science of the Russian Federation (Project No.2010-218-01-192 and Budget Theme No.12-24).
Appendix A NMR control of the powder sample after alignment
To test whether the phase content of the powder sample evolved during the alignment process, and that the K remained the majority phase, we monitored in Fig. 8 the evolution of the 59Co NMR signal for K. For , the NMR signal intensity at the central line position exhibits an abrupt total loss indicating that the internal field which develops below completely wipes out the 59Co NMR signal from our observation window. Notice that the weak progressive loss seen above 22 K is due to the slowing down of the magnetic fluctuations when approaching , which shortens the transverse relaxation time and induces the weak reduction of the detected spin echo signal.
On the contrary, in the AF A type phase, in which the Co layers are ferromagnetically ordered in plane, the two cobalt planes adjacent to the Na layer induce opposite local fields on the 23Na nuclei. Those therefore should only sense weak extra local fields in the magnetic phase, determined by the actual 3D stacking of the Na planes. We indeed found that the 23Na NMR spectrum only weakly broadens below 22 K. As the central line spectra of Fig. 4(a) are somewhat complicated, we just monitored this broadening by the distance between the two extreme points in the spectrum for which the signal intensity is 20% of its maximum intensity, shown in the inset of Fig. 8. The purity of the 22 K phase could be further confirmed by the absence of any anomaly in the 23Na NMR spectra in the paramagnetic phase which could be associated with the nearby phases with 9 K and 29 K which were detected in single crystal (see Appendix C).

Appendix B Sample evolutions upon Na extraction
Here we studied the evolution with heat treatment of a small slice of the SC2 sample which contained both the 9 K and 22 K phases. We studied the progressive variation of the SQUID magnetization data after curing the sample for a few hours under argon atmosphere at increasing temperatures. As can be seen in Fig. 9 the magnetization signal below 9 K decreased progressively, quite faster than that measured between 9 K and 22 K, which is dominated by the contribution of the 22 K phase. This allowed us to demonstrate that the 9 K phase corresponds to a slightly higher Na content than the 22 K phase, as was also evidenced in the Ref. 23.
Let us point out that the magnitude of the magnetization below is driven by magnetic anisotropy parameters not well controlled so far. Therefore, from SQUID data we only get some indication of the actual phases present in the samples, and their transformations, but that does not allow us to determine the fraction of phase contents in the sample.
Finally the comparison of our x-ray data, of SQUID data taken on the three single crystal samples, shown in Fig. 3, their evolution with heat treatment, allowed us to establish that the magnetic phases correspond to increasing Na content for the 22 K-9 K-29 K phases, in quite good agreement with the data of Shu et al. on the same phases.[23]

Appendix C Comparison of the 9 K and 22 K phases
We have seen that the K phase although hardly synthesized as an isolated phase so far, has been however detected by many authors. It represents indeed a large part of our SC2 sample. We therefore compared the 23Na NMR signal of the SC2 with that of the SC1, which is a pure K phase sample. We did not see any modification of the SQUID data of the K SC1 sample with the cooling process and it can be seen as well on Fig. 10(a,b) that the =80 K NMR spectra in the paramagnetic phase are also totally independent of the cooling process.
This contrasts with our data for the SC2 sample, for which we did find radical changes of the 23Na NMR spectrum in the paramagnetic phase when quenching the sample as displayed in Fig. 10(c,d). So the phase which displays a K transition upon slow cooling displays distinct Na orders depending of the cooling process. The total independence of the SC1 signal upon the cooling process is then a further proof of the absence of K phase in this sample.

All these results are consistent with the observation by Schulze et al. that the K phase was obtained by slowly cooling their samples.[11] Our NMR results further establish that this phase is an independent phase present in multiphase samples, and not a transformation of the K phase during the cooling process.
Let us notice that Morris et al. [22, 37] have taken neutron scattering data on a sample of similar Na content in which they found a structural change occuring at 240 K. They attribute this to a shear occuring on the ordered Na structure which shifts from the unit cell of Fig. 6(e) to that of Fig. 6(f). In view of the change observed by slow cooling of the 9 K phase, it might correspond to the phase studied in Refs. 22, 37 although one would still need a complete set of data to establish the structure they proposed.
It is then easy to notice in Fig. 10 that the outer Na(1) line is characteristic of the 22 K phase spectrum, so from its intensity in the SC2 spectrum, we could estimate that the fraction of 22 K phase in the SC2 sample is about 25%. We could then obtain by substraction the 23Na NMR spectra of Fig. 10(e)(f), which are respectively characteristic of the Na order in the slowly cooled K phase, and of its modification upon quenching.

To attempt to monitor the relative Na contents of the 22 K and 9 K phases we studied the (008) x-ray Bragg reflections for the SC1 and SC2 samples. We found (see Fig. 11) that the SC2 sample displays a small splitting of the (008) reflection which, from our calibration curve, would correspond to at most a 1% increase in Na content from the 22 K to the 9 K phase.
References
- [1] I. Terasaki, Y. Sasago, and K. Uchinokura, Phys. Rev. B 56, R12685 (1997).
- [2] K. Takada, H. Sakurai, E. Takayama-Muromachi, F. Izumi, R. A. Dilanian, and T. Sasaki, Nature 422, 53 (2003).
- [3] G. Lang, J. Bobroff, H. Alloul, P. Mendels, N. Blanchard, and G. Collin, Phys. Rev. B 72, 094404 (2005).
- [4] C. de Vaulx, M.-H. Julien, C. Berthier, M. Horvatić, P. Bordet, V. Simonet, D. P. Chen, and C. T. Lin, Phys. Rev. Lett. 95, 186405 (2005).
- [5] J. Sugiyama, J. H. Brewer, E. J. Ansaldo, H. Itahara, T. Tani, M. Mikami, Y. Mori, T. Sasaki, S. Hébert, and A. Maignan, Phys. Rev. Lett. 92, 017602 (2004).
- [6] P. Mendels, D. Bono, J. Bobroff, G. Collin, D. Colson, N. Blanchard, H. Alloul, I. Mukhamedshin, F. Bert, A. Amato, and A. D. Hillier, Phys. Rev. Lett. 94, 136403 (2005).
- [7] H. Alloul, I. R. Mukhamedshin, G. Collin, and N. Blanchard, EPL (Europhysics Letters) 82, 17002 (2008).
- [8] M.-H. Julien, C. de Vaulx, H. Mayaffre, C. Berthier, M. Horvatić, V. Simonet, J. Wooldridge, G. Balakrishnan, M. R. Lees, D. P. Chen, C. T. Lin, and P. Lejay, Phys. Rev. Lett. 100, 096405 (2008).
- [9] T. A. Platova, I. R. Mukhamedshin, A. V. Dooglav, and H. Alloul, JETP Lett. 91, 421 (2010).
- [10] M. Foo, Y. Wang, S. Watauchi, H. W. Zandbergen, T. He, R. Cava, and N. Ong, Phys. Rev. Lett. 92, 247001 (2004).
- [11] T. F. Schulze, P. S. Häfliger, C. Niedermayer, K. Mattenberger, S. Bubenhofer, and B. Batlogg, Phys. Rev. Lett. 100, 026407 (2008).
- [12] S. P. Bayrakci, I. Mirebeau, P. Bourges, Y. Sidis, M. Enderle, J. Mesot, D. P. Chen, C. T. Lin, and B. Keimer, Phys. Rev. Lett. 94, 157205 (2005).
- [13] L. M. Helme, A. T. Boothroyd, R. Coldea, D. Prabhakaran, D. A. Tennant, A. Hiess, and J. Kulda, Phys. Rev. Lett. 94, 157206 (2005).
- [14] G. Lang, J. Bobroff, H. Alloul, G. Collin, and N. Blanchard, Phys. Rev. B 78, 155116 (2008).
- [15] I. R. Mukhamedshin, H. Alloul, G. Collin, and N. Blanchard, Phys. Rev. Lett. 94, 247602 (2005).
- [16] F. L. Ning, T. Imai, B. W. Statt, and F. C. Chou, Phys. Rev. Lett. 93, 237201 (2004).
- [17] R. Ray, A. Ghoshray, K. Ghoshray, and S. Nakamura, Phys. Rev. B 59, 9454 (1999).
- [18] J. L. Gavilano, D. Rau, B. Pedrini, J. Hinderer, H. R. Ott, S. M. Kazakov, and J. Karpinski, Phys. Rev. B 69, 100404 (2004).
- [19] Y. Ihara, K. Ishida, C. Michioka, M. Kato, K. Yoshimura, H. Sakurai, and E. Takayama-Muromachi, Journal of the Physical Society of Japan 73, 2963 (2004).
- [20] I. R. Mukhamedshin and H. Alloul, Phys. Rev. B 84, 155112 (2011).
- [21] H. Zandbergen, M. Foo, Q. Xu, V. Kumar, and R. Cava, Phys. Rev. B 70, 024101 (2004).
- [22] M. Roger, D. J. P. Morris, D. A. Tennant, M. J. Gutmann, J. P. Goff, J.-U. Hoffmann, R. Feyerherm, E. Dudzik, D. Prabhakaran, A. T. Boothroyd, N. Shannon, B. Lake, and P. P. Deen, Nature 445, 631 (2006).
- [23] G. J. Shu, F.-T. Huang, M.-W. Chu, J.-Y. Lin, P. A. Lee, and F. C. Chou, Phys. Rev. B 80, 014117 (2009).
- [24] T. A. Platova, I. R. Mukhamedshin, H. Alloul, A. V. Dooglav, and G. Collin, Phys. Rev. B 80, 224106 (2009).
- [25] P. Foury-Leylekian, V. V. Poltavets, N. Jaouen, J.-P. Rueff, J. E. Lorenzo, P. Auban-Senzier, C. R. Pasquier, C. Mazzoli, and M. Greenblatt, Phys. Rev. B 79, 115101 (2009).
- [26] Y. Hinuma, Y. S. Meng, and G. Ceder, Phys. Rev. B 77, 224111 (2008).
- [27] H. Alloul, I. R. Mukhamedshin, T. A. Platova, and A. V. Dooglav, EPL (Europhysics Letters) 85, 47006 (2009).
- [28] O. E. Peil, A. Georges, and F. Lechermann, Phys. Rev. Lett. 107, 236404 (2011).
- [29] L. Boehnke and F. Lechermann, Phys. Rev. B 85, 115128 (2012).
- [30] T. Motohashi, R. Ueda, E. Naujalis, T. Tojo, I. Terasaki, T. Atake, M. Karppinen, and H. Yamauchi, Phys. Rev. B 67, 064406 (2003).
- [31] R. Berthelot, D. Carlier, and C. Delmas, Nature Materials 10, 74 (2011).
- [32] F. C. Chou, M. W. Chu, G. J. Shu, F.-T. Huang, W. W. Pai, H. S. Sheu, and P. A. Lee, Phys. Rev. Lett. 101, 127404 (2008).
- [33] This has lead them to associate their four magnetic phases with 0.763, 0.820, 0.833 and 0.859. We do not think that any of the existing data could determine the concentration of Na in a pure phase sample to better than 0.5%.
- [34] A. Egorov, O. Bakharev, A. Volodin, S. Korableva, M. Tagirov, and M. Teplov, Sov. Phys. JETP 70, 658 (1990).
- [35] I. R. Mukhamedshin, H. Alloul, G. Collin, and N. Blanchard, Phys. Rev. Lett. 93, 167601 (2004).
- [36] A. Abragam, The Principles of nuclear magnetism (Oxford: Clarendon Press, London, 1961).
- [37] D. J. P. Morris, M. Roger, M. J. Gutmann, J. P. Goff, D. A. Tennant, D. Prabhakaran, A. T. Boothroyd, E. Dudzik, R. Feyerherm, J.-U. Hoffmann, and K. Kiefer, Phys. Rev. B 79, 100103 (2009).
- [38] D. Carlier, M. Blangero, M. Menetrier, M. Pollet, J.-P. Doumerc, and C. Delmas, Inorganic Chemistry 48, 7018 (2009).
- [39] Y. S. Meng, Y. Hinuma, and G. Ceder, The Journal of Chemical Physics 128, 104708 (2008).
- [40] W. Koshibae and S. Maekawa, Phys. Rev. Lett. 91, 257003 (2003).