Material evidence of a 38 MeV boson
Abstract
We present further and more compelling evidence of the existence of , a light boson that most probably couples exclusively to quarks and gluons. Observations presented in a prior paper will be rediscussed for completeness.
pacs
11.15.Ex, 12.38.Aw, 12.39.Mk, 14.80.EcIn a recent paper [1], we presented a variety of indications of the possible existence of a light boson with a mass of about 38 MeV, henceforth referred to as . These indications amounted to a series of low-statistics observations all pointing in the same direction, which will be discussed here anew, for completeness. However intriguing, the pieces just did not yet add up to a full and clear picture in Ref. [1]. In this Letter, we present three more pieces of evidence, one of which being considerably more conclusive owing to the much higher statistics. However, the latter data do not confirm the existence of recurrencies of , as previously [1] suggested.
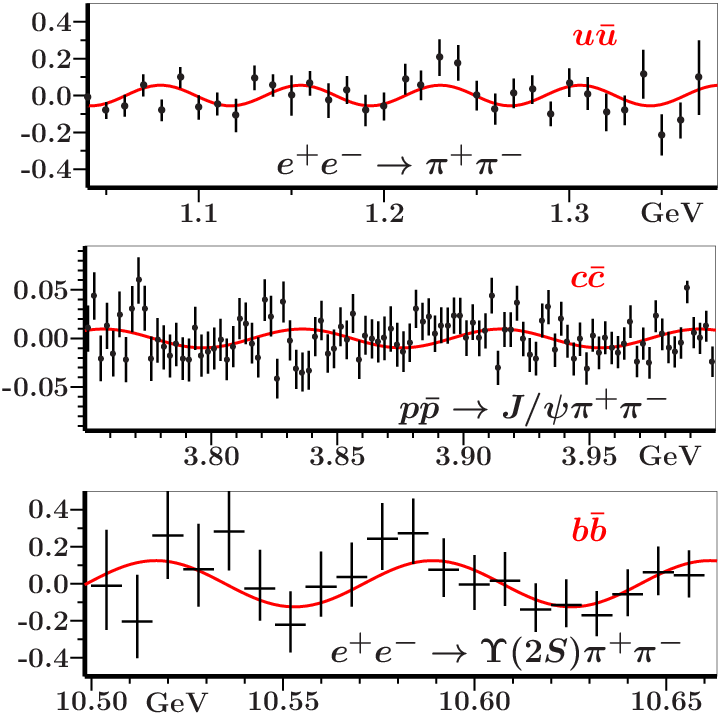
In Ref. [2], we made notice of an apparent interference effect around the threshold in the invariant-mass distribution of events, which we observed in preliminary radiation data of the BABAR Collaboration [3]. The effect, with a periodicity of about 74 MeV, could be due to interference between the typical oscillation frequency of 190 MeV of the pair, as in the model of Refs. [4, 5], and that of the gluon cloud. Later, in Ref. [6], we reported evidence of small oscillations in electron-positron and proton-antiproton annihilation data, with a periodicity of 762 MeV, independent of the beam energy. The latter observations are summarized in Fig. 1.
Amongst the various scenarios to explain the phenomenon presented in Ref. [6], one was rather intriguing, namely the postulated existence of gluonic oscillations, possibly surface oscillations, with a frequency of about 38 MeV. These would then, upon interfering with the universal quarkonia frequency MeV [4, 5], lead to the observed oscillations.
 |
Here, we will find that the phenomenon is most likely to be associated with the interquark exchange of a boson with a mass of about 38 MeV. Moreover, from the fact that the observed oscillations are more intense for bottomonium than for light quarks, we assume that the coupling of this light boson to quarks increases with the quark mass. This seems to correspond well to the scalar particle of the model of Ref. [10], and to the enigmatic mass parameter related to the pair-creation mechanism [4].
In Ref. [9], the BABAR Collaboration presented an analysis of data on ( and ), with the aim to study hadronic transitions between excitations and the and , based on 347.5 fb-1 of data taken with the BABAR detector at the PEP-II storage rings.
The selection procedure for the data is well described by BABAR in Refs. [9, 11, 12]. In Fig. 2, we study the invariant-mass distribution of muon pairs obtained from the BABAR data set [9] for the reaction , and for a bin size equal to 9 MeV.
 |
Furthermore, we show in Fig. 2 a simple Gaussian distribution (gray histogram, green in online version), with a width of 89 MeV, around the peak. We observe that, with respect to the Gaussian distribution, there is an excess of data for below the mass, and a deficit of data for thereabove. Actually, we have chosen the Gaussian distribution such that the total difference between the data under the Gaussian histogram and the experimental data vanishes. The excess signal is indicated (dark, shaded, histogram, red in online version) at the bottom of Fig. 2.
We observe from Fig. 2 that the excess of data sets out for masses some 40 MeV below the mass, viz. at about GeV, and then towards lower injvariant masses, leaving a small signal on top of the increasing background tail, up to about 9.33 GeV. The deficit data exhibit enhancements at about , 9.54 and 9.57 GeV, i.e., 38, 76, and 114 MeV above the mass, respectively.
In Fig. 3, we have collected excess signals for other reactions, thereby following similar procedures as before. We have selected all reactions with some reasonable statistics from BABAR [9] data, viz. (Fig. 3a), (Fig. 3b), and for all available data (Fig. 3c). The data binning has been chosen in order to optimize statistics.
In Fig. 3a, which is 19 MeV binned, we observe two connected enhancements at 38 and 76 MeV below the mass, and a third one, 38 MeV further downwards. Above the mass, we observe two connected negative enhancements, 38 and 76 MeV higher up in mass. In Fig. 3b, which is 38 MeV binned, we observe two connected enhancements at 38 and 76 MeV below the mass, and three connected enhancements at 38, 76 and 114 MeV above the mass.
a |
b |
c |
In itself, it is not surprising that an intrinsic asymmetry in mass distributions leads to excess on one side of the center and to a deficit on the other side, with respect to a symmetric distribution. However, we do observe structure in the excess and deficit data. This can be most clearly seen in the excess distribution of the reaction (see Fig. 3c), where we do not opt for an overall vanishing excess, as we did for the other reactions. The excess signal below is mainly due to Bremsstrahlung, as explained by BABAR in Ref. [9]. Nevertheless, on top of the Bremsstrahlung background one observes something extra in the invariant-mass interval 9.35–9.42 GeV. No doubt, it is an additional signal of hardly more than 1. However, it is in roughly the same invariant-mass interval where we find some excess signal in the other three reactions. Moreover, the pronounced deficit at about 9.50 GeV comes out also in the same invariant-mass interval where we find a deficit signal in the other three reactions. The deficit enhancements at around 9.54 and 9.575 GeV are hardly distinguishable from zero, but show up in the expected energy intervals of 76 and 114 MeV above the mass.
We found our procedure confirmed in Ref. [12], where the asymmetry was studied by the BABAR Collaboration itself, though based on a much larger set of data than here at our disposal. Their result is shown in Fig. 4.
 |
Moreover, the analysis in Ref. [12] took all known possible origins of asymmetry into account. Consequently, what is left (see Fig. 4) cannot be explained by known physics.
Moreover, Ref. [12] confirms our assumption that for background is small. Also, it states that the, here reported, systematic uncertainties due to the differences between data and simulation in the processes and cancel, at least in part, in their ratio. This implies that a similar excess is found in the decay.
In order to explain the structures in the deficit signal, we must assume that the can be loosely bound inside a state, giving rise to a kind of hybrid. This was discussed to some detail in Ref. [1].
In Fig. 5, we show the event distribution for the invariant mass , which is defined [9] by , where the latter mass is supposed to be the mass.
 |
Thus, a signal with the shape of a narrow Breit-Wigner resonance seems to be visible on the slope of the resonance, though with little more than 2 relevance. Nevertheless, by coincidence or not, it comes out exactly in the expected place, namely at MeV.
New evidence of the existence of comes from observations published by the CB-ELSA Collaboration [13] and by the COMPASS Collaboration [14, 15].
In Ref. [13] the CB-ELSA Collaboration studied photoproduction of -mesons off protons with the Crystal-Barrel detector at ELSA, for photon energies in the range from 0.75 to 3 GeV. Their data were taken in three run periods, more than a decade ago, with electron-beam energies of 1.4, 2.6, and 3.2 GeV. Of our interest here are, in particular, -mesons detected in , for which cross sections were presented.
In Fig. 6 we show a detail of the two-photon invariant-mass distribution published by the CB-ELSA Collaboration [13] for the reactions and , extracted from the 3.2 GeV data.
 |
Although with low statistics, one can observe a narrow peak in the CB-ELSA data centered at about 37 MeV. Clearly, the signal is too small to claim evidence of , but it illustrates the possible decay mode through loops of virtual light quarks.
We do not expect the mode to be very large, since couples to quarks proportionally to their masses, as we concluded above in connection with the observed oscillations. Nevertheless, the two-photon data of the CB-ELSA Collaboration stimulate us to search for similar data, in other experiments, supporting .
In Ref. [14], the COMPASS Collaboration studied and vector meson production in data, obtained at the two-stage magnetic COMPASS spectrometer attached to the SPS accelerator facility at CERN. For the indentification of the meson, the has been reconstructed from two photons. A detail of the thus obtained invariant-mass distribution for pairs is shown in Fig. 7 in which an enhancement at about 40 MeV can be observed.
 |
In Ref. [15], the COMPASS Collaboration carried out a partial-wave analysis of in order to extract the exotic -wave signal. The analysis consists of various intermediate steps. The first step is to select pairs, possibly stemming from the decay of an -meson. Either one of the two mesons or both may decay into pairs of photons. Hence, as a byproduct of their analysis, the COMPASS Collaboration produced an invariant-mass distribution of photon pairs.
 |
These data seem to have enough statistics to substantiate the existence of a light boson with mass around 40 MeV.
With this latest piece of evidence of , we conclude that it is now necessary to establish its mass and other properties by further experiments. We think that is the light scalar Higgs-type boson which was proposed in a model describing the unification of electromagnetic and strong interactions [10]. Furthermore, we believe that it consists of a micro-universe filled with glue, as formulated in Refs. [16, 17].
Finally, as appears to couple to quarks proportionally to their masses, its coupling to the top quark is expected to be quite strong.
Acknowledgments
We are grateful for the precise measurements and data analyses of the BABAR, CDF, CMD-2, CB-ELSA, and COMPASS Collaborations, which made the present analysis possible. One of us (EvB) wishes to thank Drs. B. Hiller, A. H. Blin, and A. A. Osipov for useful discussions. This work was supported in part by the Fundação para a Ciência e a Tecnologia of the Ministério da Ciência, Tecnologia e Ensino Superior of Portugal, under contract no. CERN/FP/116333/2010.
References
- [1] E. van Beveren and G. Rupp, arXiv:1102.1863.
- [2] E. van Beveren and G. Rupp, Phys. Rev. D 79, 111501R (2009) [arXiv:0905.1595].
- [3] B. Aubert [BaBar Collaboration], SLAC-PUB-13360, BABAR-CONF-08-004, arXiv:0808.1543.
- [4] E. van Beveren, C. Dullemond, and G. Rupp, Phys. Rev. D 21, 772 (1980) [Erratum-ibid. D 22, 787 (1980)].
- [5] E. van Beveren, G. Rupp, T. A. Rijken, and C. Dullemond, Phys. Rev. D 27, 1527 (1983).
- [6] E. van Beveren and G. Rupp, arXiv:1009.5191.
- [7] V. M. Aulchenko et al. [CMD-2 Collaboration], JETP Lett. 82, 743 (2005) [Pisma Zh. Eksp. Teor. Fiz. 82, 841 (2005)] [arXiv:hep-ex/0603021].
- [8] T. Aaltonen et al. [CDF Collaboration], Phys. Rev. Lett. 103, 152001 (2009) [arXiv:0906.5218].
- [9] B. Aubert et al. [BABAR Collaboration], Phys. Rev. D 78, 112002 (2008) [arXiv:0807.2014].
- [10] C. Dullemond, T. A. Rijken and E. van Beveren, Nuovo Cim. A 80, 401 (1984).
- [11] P. del Amo Sanchez et al. [The BABAR Collaboration], Phys. Rev. Lett. 104, 191801 (2010) [arXiv:1002.4358].
- [12] E. Guido [BaBar Collaboration], arXiv:0910.0423.
- [13] O. Bartholomy et al. [CB-ELSA Collaboration], Eur. Phys. J. A 33, 133 (2007).
- [14] J. Bernhard and K. Schönning [COMPASS Collaboration], arXiv:1109.0272.
- [15] T. Schlüter [COMPASS Collaboration], arXiv:1108.6191.
- [16] E. van Beveren, T. A. Rijken and C. Dullemond, J. Math. Phys. 27, 1411 (1986).
- [17] E. van Beveren, C. Dullemond and T. A. Rijken, Phys. Rev. D 30, 1103 (1984).